


 Inglês (pdf)
 Artigo em XML
 Referências do artigo
 Enviar este artigo por email
 Citado por SciELO
  Citado por Google
  Similares em
SciELO
Similares em
SciELO  Similares em Google
 Permalink
1. Introduction
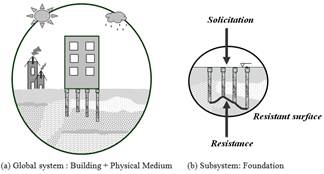
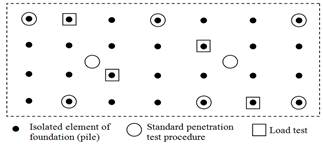
Pile foundation, which is the object of study, is the resistant surface that it is formed by the areas at the pile bases [1,2]. The definition of a resistant surface is linked to a global analysis, which considers the structural and geotechnical variabilities [3] as well as the influence of the environment and human activity on the pile foundation (see Fig. 1a). Ultimately, the problem may be condensed as part of the study of two random variables: load action effects (solicitation) and ultimate resistance (resistance) of the resistant surface (Fig. 1b).
Solicitation can be defined by the effect of actions on structural members [4], for example internal efforts, stress, strain, the structure as a whole, bending, rotation, etc. In the case of pile foundations, besides the structural element, there is a continuous medium represented by the soil massive. In each point of the massive a solicitation represented by a state of stress arises, which can be defined by the strain tensor. The random environmental and functional actions that generate the solicitation variable may be classified according to their origin (accidental, sysmic, geotechnical, etc.) and their acting mode (dynamic, static, constant, variable, uniform, periodic, etc.). These are variable throughout the service life of structure.
Usually, the weakest link in the pile-soil system is the soil. In Brazil, the verification of structural strength and geotechnical resistance are normalized by [5] and [6].
The reliability of a building’s pile foundation takes into consideration the randomness of the solicitation and the resistance values that are linked to the resistant surface under study [1]. The population we analyzed is equal to the number of isolated foundation elements, which are composed of the foundation’s structural elements and the soil massive that surrounds them, (see Fig. 1b).
[7] presents an assessment of the probability of failure and possible consequences in terms of loss of human life and the associated cost of risk inherent to some buildings. [8] establishes the probability of failure values based on field 10-2 and 10-4, respectively.
In pile foundations, the resistance of each single foundation element (pile and surrounding soil) is not usually known because the design is based on soil strength that comes from standard penetration test procedure, and its verification is based on the load test of a few piles. Thus, the probability of failure is based on resistance data before and after the execution of the piles.
In this paper, the order statistic [9,10] is a tool that will be used to estimate the probability of failure of helical pipes. This tool proposes estimates of the average and standard deviation for a set of sample data; therefore, it could be interesting to use it in pile foundations where the sample number is small: both for standard penetration test procedure as well as for load tests.
2. Background
2.1. Relation between the safety factor and reliability index
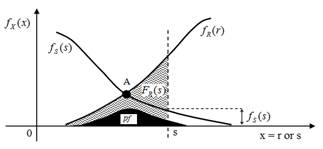
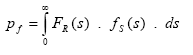
The failure probability is obtained from the relation between the solicitation (S) and the resistance (R). The failure event occurs when R - S < 0 or R/S < 1. The failure probability ( pf ) is defined as the integral from zero to infinity of FR(s) and fS(s) functions’ product, as shown in eq. (1) and Fig. 2 [11,12]. The failure probability, defined by eq. (1), considers that there is no conditioning: R and S are independent variables.
 (1)
(1)
At point A in Fig. 2, the probability density functions fR(r) and fS(s) are the same. The black area in Fig. 2 represents pf , being the area under the curves fR(r) , to the left of the point A, and fS(s) , to the right of that point. The larger the area under this curve, the higher the pf , that is, the lower the reliability of the pile foundation.
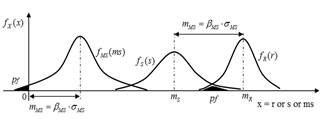
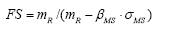
The failure probability can be determined from the margin of safety linear function (MS=R-S) and the nonlinear function factor of safety (FS=R/S), which depends on the density functions fS(s) and fR(r) . The degree of dispersion and coefficient of variation (ν=σ/m) are represented by the shape of these curves, and they influence the magnitude of the failure probability [12].
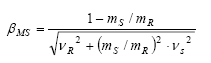
The R and S problem can be formulated analytically in terms of the MS and FS functions through their respective reliability indexes ( βMS and βFS ). These measure the distance from the failure condition in terms of standard deviations.
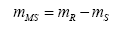
As R and S are random variables and MS is a linear function of R and S, MS is a random variable. When MS is less or equal to zero, the failure occurs (see Fig. 3). Thus, the failure probability is pf = P[MS≤0] : the hatched areas in Fig. 3.
Usually, there is not sufficient information about the extremities of the MS distribution, and the criterion pf = P[MS≤0] is replaced with another that involves the MS average and standard deviation.
From the average and standard deviation of continuous random variables R and S, the average and standard deviation of MS is determined. It is known that the estimator is a linear operator and that the variance follows the next expression [13], where X is any random variable.
 (2)
(2)
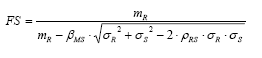
Whereas, (RS , the correlation coefficient between R and S; the average (m); and standard deviation (σ) of MS are:
 (3)
(3)
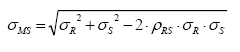 (4)
(4)
In Fig. 3, the parameter βMS , called the Reliability Index, can be obtained from different distributions of R and S. This is shown in eq. (5).
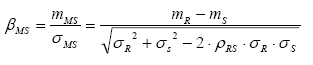 (5)
(5)
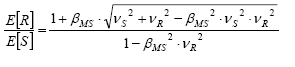
From the shape of the probability density curves R and S, synthesized by their respective coefficients of variation, there is a relation between the global safety factor ( FS = mFS = mR/mS ) and the reliability index. The deduction of this relation is shown below [1].
According to the definition of βMS shown in Fig. 3, we have:
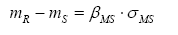 (6)
(6)
fP =0,7fy Dividing eq. (6) by mR we have:
 (7)
(7)
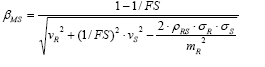
Defining (MS in the previous equation, the relation between FS and (MS is given by:
 (8)
(8)
 (9)
(9)
The Reliability Index is also found in [14,15], as shown in eq. (10)-(11), respectively. However, in these studies, the variables are mutually independent ( (RS = 0) and the direct relation between FS and (MS is not explained.
 (10)
(10)
 (11)
(11)
A knowledge of the two first probabilistic moments of the margin of safety and factor of safety functions is not enough to define the probability density function. It is also necessary to know the shape of the performance function distribution. In practice, it is usual to adopt the hypothesis of normal or lognormal distributions.
If the random variables R and S present a normal distribution, βMS and βFS are related to the probability of failure by the following expression, in which Φ is the standard normal cumulative distribution function.
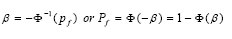 (12)
(12)
2.2. Monte Carlo method
The use of a simulation method is another way to estimate the failure probability. One of the methods most commonly used for this purpose is the Monte Carlo simulation, which consists of repeating deterministic solutions. The result is a set of values generated in accordance with their respective probability distributions, which are presumably known. This group of values is similar to a set of information derived from experimental observations. It is possible to statistically treat the generated deterministic values using all statistical inference methods.
Essentially, the Monte Carlo method is a random sampling technique, and as in any other sampling process, there is always some error involved. According to [16], in order to obtain "exact" solutions the number of simulations must approach infinity, which is one of the method’s drawbacks.
2.3. Safety and reliability in pile foundations
In pile foundations in which the population is finite, it has been verified in practice that the statistical sample, obtained from standard penetration test procedure and dynamic and static load tests, accurately represents the finite population parameters [1,7] (see Fig. 4). Thus, the average and standard deviation of the sample can be taken as the average and standard deviation of the finite population.
In foundations engineering, the sampling plan is basically comprised of the n size of the sample. This is the main factor responsible for the accuracy of the results between sample and population (Fig. 4). This is due to the fact that the sampling design does not meet the defined criteria because of the unknown soil variability. Contemplating that the sample size can reduce the variability of soil mass is a mistake as this is an intrinsic characteristic of the geological and geotechnical environment.
In practice, we work with a single sample and, therefore, we have only single estimates calculated for this sample. From the sample we can make inferences about the population values through the sampling distribution that are associated with no addiction criteria (where the estimator has an expectancy equal to the population value). We can also make inferences using asymptotic normality (when for certain sizes of samples the average sampling distribution is close to the normal distribution: meaning that the central limit theorem is valid).
2.4. Order statistic
The order statistic is based on ordering the elements of a set and using the extreme values: Xmax and Xmin . The main justification for the use of this tool is based on the fact that the number of tests (using either the in situ test or load test) will generally be small [10].
Estimates of the average value and standard deviation are given, respectively, by:
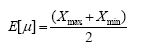 (13)
(13)
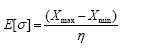 (14)
(14)
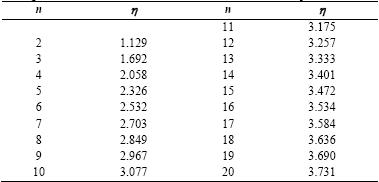
f p = 0,7f y Where η is chosen according to Table 1 below as a number (n) function of the sample:
The above relations are used to express the estimated variation coefficient E[V] (estimate of the standard deviation divided by the estimate of average value) as a function Xmin/Xmax and Xmin/Xmed . These relations are:
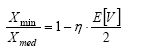 (15)
(15)
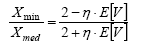 (16)
(16)
fP =0,7fy The use of sample outliers to estimate population parameters may turn out to be advantageous to calculate the failure probability, by the dispersion of sample values. It is observed that when the number of the sample is small, the use of the order statistic seems to be consistent.
3. Results and discussion
In pile foundation, it is quite unusual that the sample size is equal to the population size. If this happens, it is for a particular reason such as being orchestrated in academic research. Thus, the foundations dealt with here will aim to use the proposition [1] and the order statistic [10,17].
We analyzed the results of 13 pile foundations located in several Brazilian states, published by [18]. The similar feature of the pile foundations is the structural element that, in this case, is a continuous helical pile molded in situ. Therefore, the variability of the strength of the pile foundation is predominantly derived from the geological-geotechnical formation where each building was built.
The R and S variables related to resistant surfaces of the pile foundations are shown in Table 2. It must be noted that the resistance is determined from a static load compression test, and the number n corresponds to the amount of load tests for each pile foundation that was analyzed. The table below also includes the global safety factor FS, which shows that the only outcome of case 4 does not meet the recommendation by [6]: FS ≥ 2 and FS ≥ 1.6 for pile foundation with load tests.
Table 3 shows the calculated reliability index βMS considering simplification [1] for (RS = 0. The results obtained with this proposition are compatible with the values found in the literature: pf between 10-2 and 10-4. Table 3 also shows the βMS obtained from 20,000 Monte Carlo simulations. Note the accuracy of the results obtained with the simplification [1] and the Monte Carlo simulation.
When dealing with the quantification of reliability, expressed in terms of failure probability, it is necessary to take into account the size N of the analyzed population. Actually, the probability of failure would be cause for concern when the value is greater than 1/N. casein terms of the data in Table 2, we do not know the population size of each pile foundation.
Table 3 also shows the value of N, based on which the question of reliability is a worrying factor for the data in Table 2 and for the fixed values FS = 1.6 and FS = 2.0 (minimum recommended values by [6]). The N value for the FS constant is obtained by calculating the new average solicitation and assuming that the solicitation’s coefficient of variation is the same as the one provided in Table 2. It can be observed that the value N obtained in Table 3 is specific to no conditioning and independence between the resistance and solicitation variables, that is, factors as a group effect are not taken into consideration.
Using the order statistic based on the maximum and minimum resistance, reliability analysis of the pile foundations is indicated in Table 4.
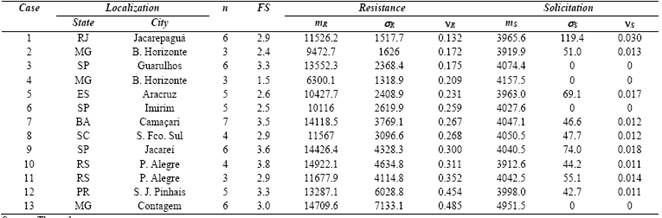
Table 3 βMS from the Monte Carlo simulation and [1]. Parametric analysis of N to conditions from βMS and FS.
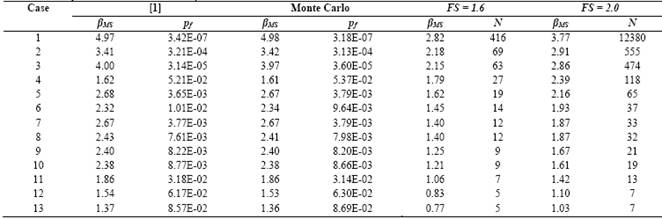
Source: The authors.
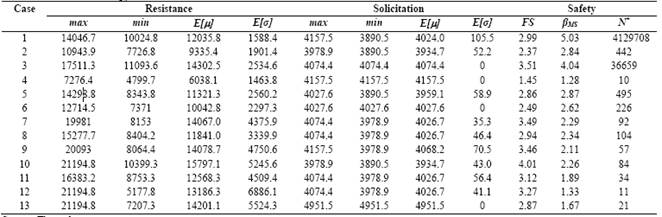
Observing the global safety factors in Tables 2 and 4, we can see that there has been no significant change because the average values of resistance and solicitation inferred by order statistic approached the proposition [1]. However, analyzing Tables 3 (2nd column) and 4 (11th column), we can see agreement on the values of reliability index expressed by the order statistic and the proposal [1]. Therefore, generally, it is concluded that the order statistic is a promising tool to estimate the finite population parameters.
Note that in many countries, it remains common to verify the safety of foundations using global safety factors. However, it is important to include an estimation of the failure probability in this verification and still ensure that the amount of tests carried out for this end is sufficient to produce a reliable estimate.
4. Conclusion
This work presented the implementation of the order statistic to evaluate the variability of the resistance and solicitation values on continuous helical type pile foundations. Therefore, it has estimated the probability of failure of such structures. From the above analysis, we can highlight the following points:
The population size of a pile foundation, defined by the foundation’s set of isolated elements, should be considered in reliability analysis.
In practice, the population size of a pile foundation is much larger than the number of samples, either in the design stage (in situ tests), or in the execution of the pile foundation stage (load test).
Facing the proposition [1], the order statistic seems to be a promising tool to estimate the population parameters for the resistance of isolated foundation elements.

