


 Inglés (pdf)
 Articulo en XML
 Referencias del artículo
 Enviar articulo por email
 Citado por SciELO
  Citado por Google
  Similares en
SciELO
Similares en
SciELO  Similares en Google
 Permalink
1. Introduction
DEA is a non-parametric linear programming-based technique to measure the relative performance of decision making units (DMUs) based on the values of chosen input and output variables, avoiding the assignment of weights and the standardization of values of variables in a homogeneous scale [1]. Therefore, these issues include model orientation, input and output selection/definition, the use of mixed and raw data, and the number of inputs and outputs to use versus the number of DMUs. DEA can be viewed as a tool for multiple-criteria evaluation problems in which DMUs are alternatives, and each DMU is represented by its performance in multiple criteria also classified in DEA models as inputs and outputs [2].
Currently, there are interesting contributions that show the relevance of DEA in international markets selection (IMS) approaches. In fact, some models consider this procedure has to be implemented with considerable attention and deliberation, especially, when some criteria can play simultaneous roles of input (cost) and output (profit) [3].
In addition, some studies show that some factors can be strategic in an IMS, like institutional government support to protect companies, geographic proximity, and cultural similarity, among others [4]. Different studies have applied DEA for IMS generically utilizing measures such as a company’s customer image, average tariff rates for destination markets, sales volumes and number of competitors [5], or specifically, in the bicycle and motorcycle manufacturing industry implementing measures such as the number of foreign competitors, the number of local manufacturers, marketing costs, average tariff rates, sales prices, and estimation of sales volumes [3].
So, governments and companies make great efforts to develop special programs based on DEA techniques to recognize opportunities in international markets to develop alternatives for economic growth [6]. Thus, every company seeking to internationalize exporting goods must identify the most optimal alternative, considering that there are many important barriers, criteria and institutional mechanisms that can influence an export process [7]. DEA models allow companies to consider many factors to identify the most efficient countries in international trade like measuring and evaluating the efficiency of international shipping line flows and their efficacy in containerized freight [8]. In this sense, in a real application of DEA for IMS, decision makers must identify appropriate inputs and outputs according to decision makers’ product specifications and preferences [5].
Therefore, the aim of this article is to propose a methodology for international market selection based on DEA models to support multi-criteria decision-making. For this purpose, the paper outlines DEA background and applications. Then, it presents a proposed methodology and models, and it is applied to select frozen beef international markets. This paper presents results and a discussion and provides a conclusion concerning the main implications of using DEA for decision makers.
2. DEA background and applications
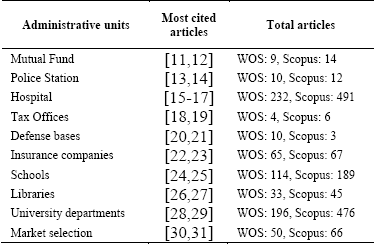
DEA is a linear programming-based technique to evaluate the performance of administrative units such as banks, mutual funds, police stations, hospitals, tax offices, defense bases, insurance companies, schools, libraries, and university departments, among others, including countries and governments [9]. In addition, it was proposed by Charnes, Cooper and Rhodes in 1978 [10]. DEA is also called frontier analysis because the performance of a unit is evaluated comparing its performance with the best performing units of a sample that forms an efficiency frontier. Moreover, if the unit is not on the efficiency frontier, it is considered to be inefficient. Therefore, this multiple-criteria method can be applied successfully to profit-making and non-profit organizations because it can handle multiple inputs and outputs as opposed to other quantitative techniques as ratio analysis or regression. Currently, there are several articles in databases like ISI Web of Knowledge, Web of Science (WOS) and Scopus about the application of DEA in administrative units, as shown in Table 1.
DEA models may be input-oriented and output-oriented. Input-oriented models state that efficient DMUs will be those that consume the least amount of inputs to achieve a given level of output, and output-oriented models provide that efficient DMUs will be those that achieve the highest number of outputs with a given level of inputs. Similarly, DEA models can be classified as CCR models [9] and BCC models [32]. CCR models assume the existence of constant returns to scale. That is to say, all units are compared as if they were subject to constant returns and not to the possibility of the existence of inefficiencies because of differences between the scales of operation envisaged in each DMU. BBC models are based on the principles of convexity, free input and output availability and variable returns to scale. BCC models are used to compare the size of similar organizations while CCR models are used to compare an organization with others, substantially larger or smaller [33].
DEA can also be combined with structured techniques like an analytic hierarchy process (AHP) to process complex data supported on mathematics and psychology [34], chance constrained programming (CCP) and multi-objective programming (MOP) in risk evaluation models [35]. In this sense, in a short time, DEA has grown into a powerful quantitative, analytical tool to measure and evaluate performance. It has also been successfully applied to a host of different types of entities engaged in a wide variety of activities in many contexts worldwide [36].
2.1. DEA and international market selection
DEA is used for market selection because it is a complicated decision making task which takes time, and needs tools and models to deal with multiple criteria, weight restrictions and inaccurate data simultaneously [5]. Moreover, DEA is applied to select international suppliers and their performance evaluation, even using complementary mathematical tools as stochastic efficiency analysis to deal with uncertainties related to supplier performance, political, legal, economic, socio-cultural and technological market features [37]. Governments use DEA to promote export programs, especially, for companies who try to find new international markets [6], and DEA can be used to show export enterprises their main threats, to increase the companies’ possibilities for [38].
DEA can be useful to identify when a company is able to compete in international markets and to recognize market export opportunities [39]. As a quantitative tool, DEA allows efficient multiple-criteria evaluation through inputs and outputs [2]. However, in IMS, many qualitative techniques evaluate the conditions to internationalize a company [40].
3. Methodology and DEA models
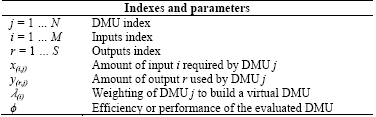
To create a DEA methodology for international market selection, DMUs represent countries with potential to import frozen bovine meat from Colombia, and DEA will be used to classify them to facilitate an IMS decision-making process. Therefore, the DEA model uses the notation presented in Table 2, where N DMU which will be evaluated consumes M inputs to generate S outputs.
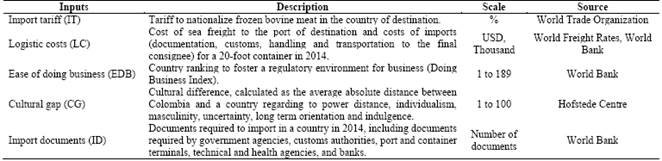
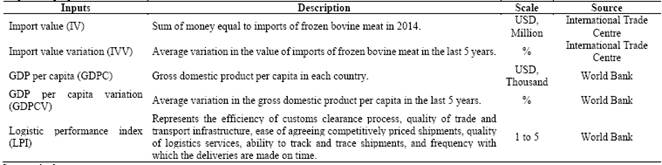
In this article BCC models are used to select international markets to export frozen bovine meat based on the nature of the inputs and outputs described in Table 3 and Table 4. Criteria set by [41], [42] and the authors were taken into account to determine the inputs and outputs, which include country-level and consumer-level variables related to economic and market development, product acceptance, cultural and geographic distances, logistics, policies that facilitate the generation of business and a flow of goods, among others.
The inputs taken into account can be interpreted as the costs and efforts required to access an international market. Inputs taking smaller values will be convenient for business performance. Hence, the outputs taken into account can be interpreted as benefits that a destination country offers, and outputs taking higher values will be more convenient for business performance.
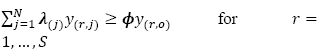
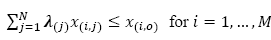
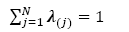
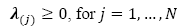
In this case, an output-oriented model is used because the decision maker is interested in finding a country where the benefits of exporting frozen beef are maximized considering certain costs and efforts. Thus, the mathematical approach of the BCC output-oriented model is described in eq. (1)-(5).
 (1)
(1)
Subject to:
 (2)
(2)
 (3)
(3)
 (4)
(4)
 (5)
(5)
For a BCC output-oriented model, ϕ represents the radial expansion of outputs given a maximum level of inputs, therefore, if ϕ > 1, it means that the combination of outputs from other DMUs are greater than the outputs of the evaluated DMU, and it is classified as an inefficient DMU.
With the information of inputs and outputs, DEA models are loaded and solved in a program developed in MS Excel, supported with Visual Basic Applications programming and the use of solver application. Using this, the efficiencies of each country are obtained with the output-oriented model. The most efficient countries are prioritized according to the number of times that each country is used to create the efficiency reference set for other countries.
4. Results and discussion
To load the proposed model, countries that imported more than US$ 50 million of frozen beef in 2014 were selected. Such information was found in the International Trade Centre’s databases [43], and the result was 39 countries, and of these, 7 countries lacked information on the input and output values (established in Table 3 and Table 4) were dismissed. Table 5 was built with results showing the values for each of the proposed models’ input and output variable. Moreover, the 32 remaining countries’ names have been abbreviated according to the World Bank [44].
As shown in Table 6, a correlation analysis between input and output variables was conducted to ensure each variable provides different information from other variables in the model, increasing differentiation among the evaluated countries. This analysis facilitates the identification of the variables which are convenient to keep or not.
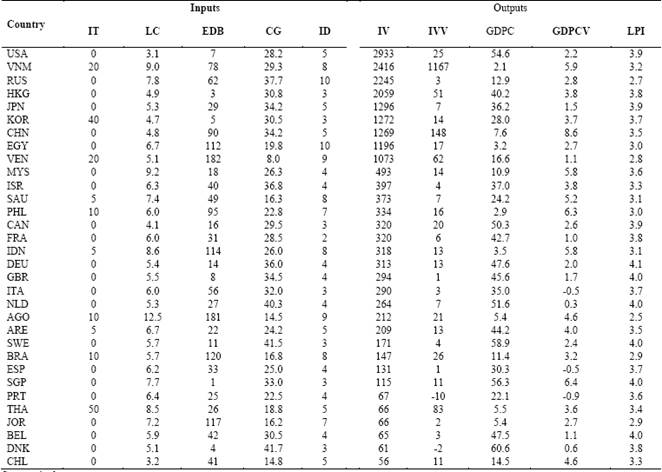
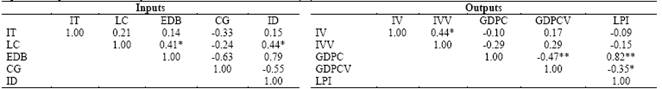
Table 6 shows a significant correlation between the logistics cost (LC) and ease of doing business (EDB), and between the logistics cost (LC) and the number of import documents required by the destination country (ID). Thus, the variable ID was eliminated because it was considered in the LC variable. Regarding output variables, there is a highly significant correlation between GDPC and GDPCV as well as between GDPC and LPI. Therefore, it has been decided to discard the GDPC. Although the GDPC has been removed, it has a representation in the model through the GDPCV variable, which takes into consideration its variation over time. This way the DEA models are left with 4 input and 4 output variables.
Once the input and output variables are refined, according to [45] and [46], the number of DMU is at least equal to (M+S) × 3. In this case, it is (4 + 4) × 3 = 24 countries, and complies having 32 countries in the data set. In this sense, the condition established by [47] would also be fulfilled as the number of DMU in DEA models should be at least equal to 2M×S, which in this case is 2 (4) × 4 = 32 countries. The DMU number used for international market selection allows a higher segregation level and gives the model more degrees of freedom.
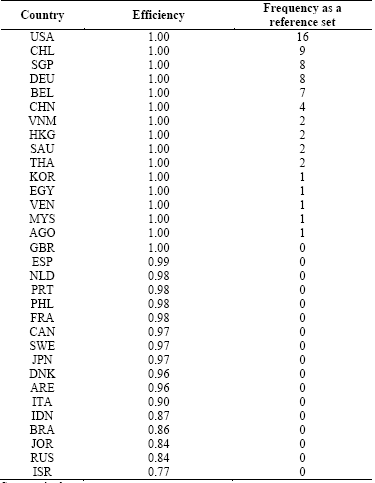
After verifying the correlations between the variables and the minimum number of countries to be considered, the proposed model is executed, obtaining each country’s efficiency and frequency as a reference set as shown in Table 7. Adjustments to the efficiency value results of the output-oriented model are done to convert those values using a 1/ϕ scale.
In Table 7 in the output-oriented model, it is observed that 47.6 % of the countries are efficient and the average efficiency is approximately 96%, showing that there is a set of countries to which frozen beef can be exported from Colombia obtaining adequate benefits according to costs and efforts required to access those countries. It is noted that countries like the United States of America (USA), Chile (CHL), Singapore (SGP), Germany (DEU) and Belgium (BEL) are efficient and are most often used in the reference set to determine the efficiency of other countries. This means that these countries are leaders and benchmarks to determine the efficiency of inputs and outputs for other countries considered in the analysis. Therefore, it is recommended to select one of these countries as an international market to export frozen beef, prioritizing the countries according to the order suggested in Table 7, and thus, it ensures selecting a country where profits are maximized and costs are appropriate for the benefits obtained.
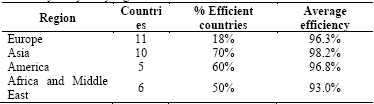
To complement the IMS analysis, Table 8 presents a study by region to which those evaluated countries belong, and it allows us to identify opportunities to perform the best market expansion strategies and export products to several countries with geographic proximity.
Therefore, the regions with the highest proportion of efficient countries under the output approach are Asia and America, which in turn are the regions with higher average efficiency. However, despite the fact that only 18% of the countries in Europe are efficient, the average efficiency in that region is similar to Asia and America.
Finally, accordingly to Table 7 and Table 8, it is recommended to select the United States of America (USA), Chile (CHL) and Singapore (SGP) as international markets for frozen bovine meat, because these countries’ efficiency maximizes outputs and is used in the reference set to determine other countries’ efficiency. Furthermore, they are located in regions with high efficiency levels, and this facilitates the opening of new markets.
6. Conclusions
DEA is a robust quantitative methodology that offers understanding and application for international market selection for different products and economic sectors. The BBC output-oriented model was applied to evaluate the efficiency of international markets to export frozen beef from Colombia.
The application of DEA models allows us to identify countries that provide greater cost/benefit, taking into account multiple criteria and measures such as import tariffs, logistic costs, ease of doing business, cultural gaps, import value, import value variations, GDP per capita variation and the logistic performance index. This indicated that the best countries to export frozen bovine meat to are the United States of America (USA), Chile (CHL) and Singapore (SGP), which are located in regions with the highest average efficiency and highest proportion of efficient countries under input and output approaches.
As shown in this article, the proposed model and its measures are not limited to products such as frozen beef or frozen food. This allows them to be applied in multiple contexts and to any product which can be exported to an international market. According to the preferences of the decision-maker, DMU selection criteria may change, and some inputs and outputs can be customized.

