


 English (pdf)
 Article in xml format
 Article references
 Send this article by e-mail
 Cited by SciELO
  Cited by Google
  Similars in
SciELO
Similars in
SciELO  Similars in Google
 Permalink
1. Introduction
In audio forensics there are two main scenarios for treating a suspect: identification and verification of the speaker [1]. In the first scenario, there is a specific group of suspects, in which the perpetrator of the crime is; the proof given as evidence is a voice recording. To identify the perpetrator of the crime, the voices of the members of the group are compared against the audio proof, and the voice that matches the evidence is the villain’s voice. In the second scenario, there is only one suspect and the purpose is to determine whether s/he participated in an audio recording given as evidence.
Speaker identification algorithms can be used for authentication purposes or for audio forensics. In the first case, the system is trained with some utterances of every speaker and then the system should identify the speaker with a new set of words. However, in the second case, the identification process is a blind task, and there is not preliminary knowledge about the owner of the audio recordings.
Generally, one of the main blocks in any speaker identification system is a decision algorithm, which makes a choice from the information obtained from the voices (feature extraction). Among decision techniques, the artificial intelligence schemes such as neural networks [1], fuzzy logic [2,3] or genetic algorithms [4] have been widely used. Since these kind of solutions need a training stage, they are very useful for authentication but not for audio forensics.
In the context of audio forensics, one of the main decision algorithms for speaker identification used by law enforcement agencies is the analysis based on voice spectrogram, according to official information reported by INTERPOL [5]. This technique is the second most used approach around the world, and the first in Asia, Africa, the Middle East, South and Central America. In the case of North America, the most frequent approaches are the semi-supervised algorithms which use signal processing methods and statistical models; here, the algorithms can use voice spectrogram but unlike visual comparison of formant shapes, human inspection is replaced by automatic analysis.
In the literature, another approach suggests carrying out voice analysis by means of cochleagrams instead of spectrograms. Although spectrograms give useful information to analyze a voice signal [6] and to compare two or more recordings [7,8], and it has been verified that impostors cannot mimic the behavior of target spectrograms [9], they work with lineal frequency resolution and are not the best way to analyze low frequencies of the signal. On the other hand, cochleagrams work with a finer frequency resolution at low frequencies, which may be useful for differentiating voice characteristics, since its energy is high at low frequencies; therefore, some recent studies of audio forensics have used cochleagrams as a feature input in speaker identification systems [10-12]
According to the above, this paper proposes a blind speaker identification algorithm that uses cochleagrams for feature analysis, and a fuzzy system for classification. With our proposal, a training step is not required before the identification task, and therefore, it is intended for audio forensics purposes.
The other sections of the paper are structured as follows: Section 2 explains the auditory features used in our proposal. Section 3 presents the proposed method. Section 4 shows the implementation and validation of the method. Section 5 presents the conclusions.
2. Auditory features
As discussed previously, in traditional approaches of audio forensics the spectrogram has been widely used as a tool for auditory feature extraction. A spectrogram is a graphic representation of a one-dimensional signal into a two-dimensional time-frequency display. In the case of the spectrogram of a voice signal, a linear frequency scale from 0 Hz to 8 KHz (or 4 KHz depending of the frequency sampling of the voice signal) is used. This linear characteristic is not adequate for speaker identification purposes, since there are little differences in the voice features for people with similar timbre and pitch. Therefore, these differences could not be detected through methodologies using spectrograms. On the other hand, the cochleagram is a two-dimensional representation of sound signals, but unlike the spectrogram, it uses a bank of gammatone filters. The result has a finer frequency resolution at low frequencies respect to high frequencies and its main consequence is a better contrast around the features [13].
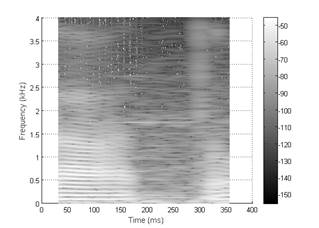
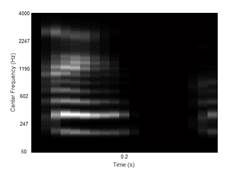
In order to illustrate the representation of a voice signal using spectrograms and cochleagrams, Figs. 1, 2 show an example of a voice signal with the pronunciation of the word “gato” (Spanish for “cat”) for two different speakers. Here, white represents high values of energy and black represents low values (or mute).
According to the above graphics, dissimilarity between the plots of the same figure is more noticeable in the case of Fig. 2. In that instance, there are (visually) remarkable differences in the region between 602 Hz and 1190 Hz.
In most cases, these differences can be enough to reject a suspect as the source of an audio proof. However, to enhance the performance of the system, the comparison can be done quantitatively through mathematical operations. Here, the aim is to obtain a value of similarity/dissimilarity that can be used by a classification block. One way to make the comparison is through Normalized Correlation (NC) between two cochleagrams. If the NC value is close to 1, it implies that the behavior (in time-frequency) is highly correlated between them, and therefore it is highly probable that the suspect is the source of the audio proof. Otherwise, if the NC value is close to 0, it means that the suspect is not. The challenge of deciding a positive coincidence relies on cases of middle values of NC. According to several tests, in some cases of the same speaker and in some cases of different speakers, middle values of NC are achieved. Therefore, datasets of high similarity and low similarity are not exclusive, meaning that some region of NC values simultaneously belong to high similarity and low similarity. This is the reason for selecting fuzzy logic within the analysis of positive or negative coincidence between the suspect and the audio proof.
3. Proposed speaker identification method
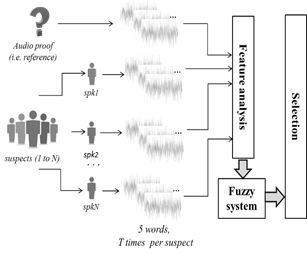
Our proposal can be discriminated in three main parts: feature analysis of speech recordings based on cochleagrams, fuzzy system, and selection. Fig. 3 shows a general outline of the proposed speaker identification method. Each of these three blocks is described in detail below.
3.1. Feature Analysis of speech recordings based on cochleagrams
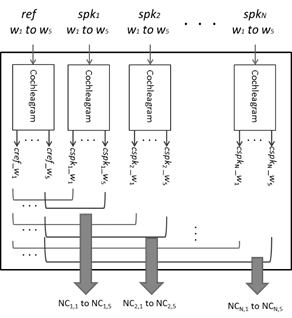
For audio forensics purposes, short utterances are selected for speaker identification in our proposal. Forensics extract five words of the audio proof (ref) and ask the specific group of suspects (i.e. spk1 to spkN ) to pronounce the selected words (i.e. w1 to wM ). These signals are the input of the block Feature Analysis (see Fig. 4).
Being N the number of suspects, it will be (N+1)*5 voice recordings corresponding to the five words pronounced by each suspect and the recordings of the five words extracted from the audio proof. Then, the cochleagram of each recording is calculated, and stored as cref_wi for the case of the recordings extracted from the audio proof, or cspkj_wi , for the case of voice recordings pronounced by each suspect (where i is the number of the word, j is the number of the suspect).
Then, the NC between the cochleagrams of the recordings extracted from the audio proof and each voice recording pronounced by each suspect (NCj,i) is computed. According to the above, there will be five values of NC per suspect (i.e.NCj,1 to NCj,5). These values are the inputs of the fuzzy system.
With the same example of Fig. 2, the visual similarity between the cochleagrams is very low, which is confirmed mathematically by an NC equal to 0.0376.
However, full certainty is not guaranteed regarding about the individual pointed by the evidence with a unique comparison. For this reason, the comparison of five different words with subsequent selection using a fuzzy system is proposed.
3.2. Fuzzy system
The aim of this system is to determine the degree of match between the recordings of each suspect and the recordings extracted from the audio proof. The selection of fuzzy system
obeys the following reason: the NC between two recordings of the same word and the source is expected to be close to 1, and for the case of different individuals is expected to be close to 0; however, in some cases, people with similar voice patterns (e.g. timbre, pitch) can have high values of NC, and in other cases, recordings of the same word from the same speaker cannot have a high value of NC (e.g. if the quality of the recordings is not good). Hence, it is necessary to classify the degree of matching in two fuzzy groups (high-similarity and low-similarity), if they are overlapped in a region of NC. This means that a given value of NC will have a certain degree of membership to the low-similarity set and a certain degree of membership to the high-similarity set. For example, an NC value of 0.4 has a degree of membership to the low-similarity set of 0.8 and a degree of membership to the high-similarity of 0.2. Therefore, these coincidence values suggest the probability of belonging to the high- similarity set.
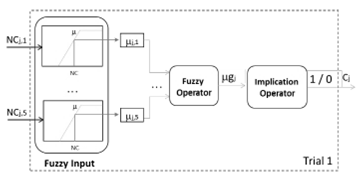
The fuzzy system block is divided in three parts: fuzzy input, fuzzy operator and implication operator as showed in Fig. 5. The Inputs of the fuzzy system are the scalar values (NC) of the output of the previous block (i.e. NCj,1 to NCj,5 for every jth suspect). The output of this block is 1 or 0. Below, the three parts of the fuzzy system are explained.
3.2.1. Fuzzy input
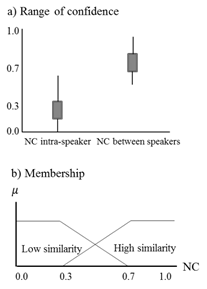
The fuzzy input works with two fuzzy sets: high- similarity and low-similarity. The level of “truth value” of a particular membership function is named µ. The trapezoidal function was selected as the membership function because it has a flat top with belonging equal to 1 and a break-point which decreases linearly to 0. This condition allows that the sum of µ in both sets of the same NC value to be always 1, and therefore, the challenge is to determine the break-point of each membership function. After several tests (with words of different phonetic characteristics), we find the NC values shown in Fig. 6a, where each box contains the 95% of the results. These graphs show that the NC value for the cochleagram of two voice recordings of the same person (saved under different conditions) ranges around 0.7, while the corresponding NC value for two different people ranges around 0.3. From these results, the membership functions of Fig. 6b were proposed.
Summarizing, in the fuzzification process, the NCj,i values are mapped by the membership functions showed in Fig. 6b. The output of the process correspond to the truth values (j,i (where i is the number of the word, j is the number of the suspect). Since there are five words for analysis, there are five values of NC and therefore five values of ( per suspect.
Source: The authors
Figure 6 NC of inter and intra-speakers: a) range of confidence of several tests, b) proposed membership.
3.2.2. Fuzzy operator
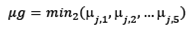
Once the five values of ( per suspect have been calculated in the previous block, the following step consists in determining a unique value per suspect related to the global similarity between him(her) and the audio proof. According to preliminary tests, it was found that a good operator among values of (j,i (for the same suspect) is the min function. However, it is neccesary to take into account that audio recordings with bad quailty can give low values of NC and then low values of (. A solution is to calculate the second-lowest value (min2) of (j,i , for i [1 to 5] and j as the number of suspect. Therefore, output of this block is the global similarity ( (g ), calculated as follows:
 (1)
(1)
For example, suppose that the probabilities of the first suspect are (1,1=0.79, (1,2=0.72, (1,3=0.75, (1,4=0.5, and (1,5=0.81, then the result of this blocks is μg=min 2 0.79, 0.72, 0.75, 0.5,0.81 =0.72. The above result is the global degree of similarity of the suspect with respect to the audio proof.
3.2.2. Implication operator
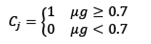
Finally, a value of coincidence (Cj) is given according to the value of (g and a fixed threshold, calculated through eq. (2). This result is calculated by each suspect (j).
 (2)
(2)
3.3. Selection
According to preliminary results, a unique set of five words is not enough to determine if a suspect is the author of the audio proof. Therefore, it is necessary to work with many trials (T). In each trial (t), five new words are selected, and the above steps (feature analysis and fuzzy system) are run again. For every trial, the suspect has a value of coincidence ( Ctj ). Then, the total score of coincidence ( Sj ) of the T trials is calculated, as follows:
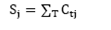 (3)
(3)
If a speaker has a score of coincidence equal to or higher than 8/10, the system selects the speaker; otherwise, the system gives a null identification. The aim of this condition is to prevent false acceptance, which means selecting a wrong suspect.
4. Implementation and evaluation of the method
The purpose of this phase is to validate the proposed scheme in terms of the accuracy of the identification process. To evaluate the performance of the proposed system, we work with databases of 28 suspects. Also, there is an audio proof, from which five words have been extracted. Each suspect has pronounced the five selected words ten times (i.e. T=10) and their recordings are compared to the recordings extracted from the audio proof. If the total number of coincidences is at least 8/10 (of the total trials), the suspect is identified as positive (whole evaluation). This procedure is repeated for all suspects.
4.1. Evaluation measures
To measure the accuracy of the identification process, the following metrics are selected: overall accuracy (OA) and Kappa (κ) index. OA ranges from 0 to 1, being the latter the ideal value (i.e. all sources and not sources of the audio proof are correctly identified). On the other hand, κ ranges from -1 to 1, where -1 means perfect disagreement, 1 means perfect agreement, and 0 means a random level of agreement/disagreement.
Knowing the recordings that correspond to the same speaker and those that are not the source of the audio proof, it is possible to compute the true positives (TP), the true negatives (TN), the false positives (FP), and the false negatives (FN). TP is the number of sources of audio proofs identified by the system as positive coincidence (correct identification); TN is the number of suspects that are not the source of audio proofs and were identified by the system as negative coincidence (correct rejection); FN is the number of sources of audio proofs identified by the system as negative coincidence (incorrect rejection); FP is the number of suspects that are not the source of audio proofs but were identified by the system as positive coincidence (incorrect identification).
With the above metrics OA is calculated, as follows:
 (4)
(4)
And the kappa index is obtained according to:
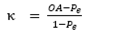 (5)
(5)
Where Pe is defined as:
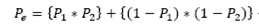 (6)
(6)
P1 is the number of suspects identified as positive coincidence divided by the total number of suspects (i.e. P1=(TP+FP)/(TP+TN+FP+FN)); P2 is the real number of sources of the audio proofs divided by the total number of suspects (i.e. P2=(TP+FN)/ TP+TN+FP+FN)).
4.2. Results and discussion
When evaluating the accuracy of the proposed method, 10 different cases were detected. Table 1 shows the meaning of each case in terms of κ and OA. According to the results, OA and κ are equal to 1 if and only if the performance of the system is perfect (1st case); it means the system identifies only the correct source of the audio proof. If the system identifies two suspects positively, i.e. the correct source and one incorrect source of the audio proof (i.e. the 2nd case), values of OA and κ are 0.96 and 0.65, respectively.
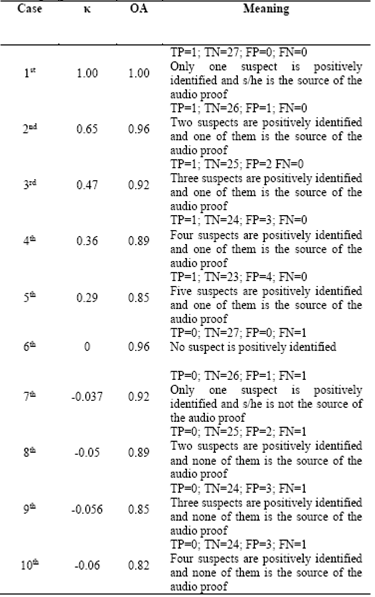
But if none of the two identified suspects are the source of the audio proof (i.e. the 8th case), OA is 0.89 and κ is -0.05. It is worth noting that in the case of four positive identifications with one of them as correct (i.e. the 4th case), the value of OA is the same of the above situation (ie. equal to 0.89), but the value of κ is 0.36. It means, for the parameter κ, having a higher number of positive identifications with one of them as the correct is better than having a lower number of positively identifications without the correct source of the audio proof. In terms of OA, identifying a correct suspect is as important as rejecting a false source of the audio proof.
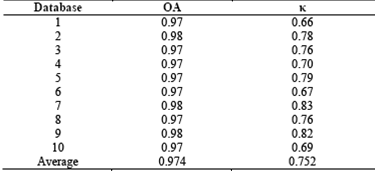
For an extensive validation, we work with 10 mini-databases each one with 28 suspects and 28 audio proofs. Every audio proof is compared with the 28 suspects of the database. At the end, there are 28 results by database, with a total of 280 tests. Table 2 shows the average of the validation parameters by database.
According to the results of Table 2 (i.e. κaverage=0.752; OAaverage=0.974), the system is expected to mostly work between the 1st and the 2nd cases of Table 1.
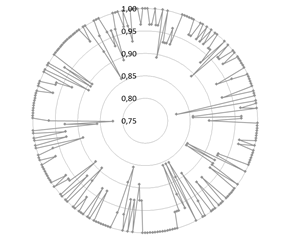
Figs. 7 and 8 show the radar charts for the results of the 280 tests (OA and κ, respectively).
It is noteworthy that all results of Fig. 7 are higher than 0.8 and most of them are on the unit circle (ideal value). This means that all results are classified in some of the ten cases of Table 1.
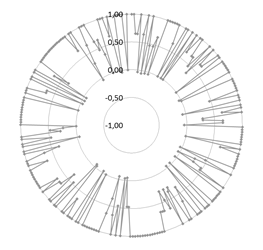
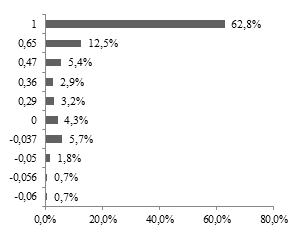
Throughout the entire circumference of Fig. 8, there are a lot of values of κ equal to 1, which means that in some tests of each database, the performance is perfect (only one identified suspect as the source of the audio proof). However, it is necessary to count the cases in which the result is not the ideal. Then, the number of results by each value of κ is divided by the number of tests (280), obtaining a normalized histogram (sum of ocurrences equal to 100%).
According to Fig. 9, most of the results of κ (62.8%) correspond to the ideal performance, and in the second place (12.5%) two suspects are identified with one of them as the source of the audio proof. The percentage of results in which one of the identified suspects is the correct one (1st case to 5th case of Table 1) is 86.7%.
4.3. Other parameter of validation
One of measure in speaker recognition/identification systems is the DET or ROC curve [14], which consists in the plot of the false acceptance (i.e. FP) vs false rejection (i.e. false negative). The AUC (area under the curve) is very useful to compare the behavior of two or more models, in which the best model is the one with the highest AUC [15]. Typically, a zero value of FP needs a high value of FP and vice versa. Then, it is very common that the plot starts in a high value of FN and it decreases as the value of FN increases.
However, with our proposal, the above behavior is not the rule. For example, our system works simultaneously with FN=0 and FP=0 in the 62.8% of the cases. It corresponds to the cases with κ equal to 1. Therefore, this parameter is not used in our project as a measure of the performance of the proposed system.
5. Comparison to related works
In this section, some related works are analyzed in terms of the selected features, the method of identification and the findings. In Avci’s proposal, the speaker identification system is based on a genetic algorithm and a fuzzy inference system. Inputs of the system are 25 Turkish words by suspect. Its correct classification rate ranges from 87.7% to 91.04%. In Almaadeed’s work, neural networks and wavelet analysis are used to identify the speaker. Several sentences are used to extract the features and results depend on the number and the kind of selected features; its performance accuracy ranges from 84% to 99%. Finally, in Daqroup’s work, the features are five formants and seven Shannon entropies extracted from vowels which are used as the inputs of a feed-forward neural network. In this proposal, recognition rate is 90.09%. In all three methods above, it is mandatory to train the system prior to the identification task; this means the system needs to know the correct answer in advance. Therefore, these systems are useful in applications of security and authentication in which a training phase is feasible.
In the context of audio forensics, the audio proof is not known by the system in advance, and then, the identification process is a ‘blind’ task. For this reason, a good way of identifying the suspect is through the similarity between the suspect’s voice and the voice in the audio proof. Unlike speaker identification for authentication, in which the output is a unique identified suspect, our output is one of three cases: null, a unique identified suspect, or with multiple identifications. Due to the above reasons, a quantitative comparison among our proposal and other methods for authentication is not feasible, and only a qualitative analysis can be performed.
In the specific area of speaker identification for audio forensics, it is remarkable that in Central and South America, identification is based on voice spectrogram (visual comparison). With our proposal, we select a fine time-frequency representation of the speech/voice signal at low frequencies (i.e. the cochleagram), as well as performing the comparison through a mathematical parameter (i.e Normalized Correlation).
6. Conclusions
In this paper a method for speaker identification is presented. The method is based on the normalized correlation between the Cochleagram of the suspect’s voice and the Cochleagram of the voice in the audio proof; then, the NC value enters a fuzzy system. Cochleagrams are selected because they can represent the time-frequency behavior of the sound in the low frequencies in a better manner, and the value of similarity/dissimilarity is closest to the perpectual assessment.
The significance of this proposal is that the system works without a training phase, which means it is not necessary to have a knowledge of the suspects in advance. Furthermore, the five words extracted from the recordings can be selected by forensics every time.
The proposed method was validated in terms of overall acuracy (OA) and kappa (k) index. According to 280 tests (every one with 28 suspects and one audio proof), averages are 97.4% and 75.2%, respectively. For the fisrt parameter (OA), selecting the source of the audio proof is as important as rejecting the other suspects. For the second parameter (k), it is better to have a higher number of positive identifications with one of them as the source of the audio proof, than having a lower number of positive identifications all of them incorrect. As a result, our proposal has a good trade-off between correct identification, correct rejection and number of identified suspects.

