


 Inglés (pdf)
 Articulo en XML
 Referencias del artículo
 Enviar articulo por email
 Citado por SciELO
  Citado por Google
  Similares en
SciELO
Similares en
SciELO  Similares en Google
 Permalink
1. Introduction
This work presents the sensitivity analysis performed on the metrics from the SCOR methodology selected for the measuring the management of a fruit-growing supply chain. SCOR is the most promising model for the measuring of strategic affairs, including the determination of opportunities that may improve the company’s competitiveness [2]; in this case, a fruit-growing supply chain. Stewart [3] cited by [4] shows some advantages offered by the SCOR model, alluding that this model enables:
A quick modeling and understanding of the supply chain.
An easy configuration of the supply chain internal and external to the company, illustrating both the current configuration and the ideal situation.
A better assessment and comparison, and better communication of business processes (through the outlining of business processes and the common language that shall be used to convey information) both in the internal and the external scope of the company.
On the other hand, in the SCOR model, very well explained by [5], it is not clear which are the metrics that influence supply chains the most; therefore, Van der Vorst, Christopher cited by [6] pose that the performance of a supply chain is linked to the satisfaction of the customer and the parties involved, and refers to the need of identifying and organizing the performance metrics to be used in the assessment process of the chain to be studied, considering the degree of complexity of the structure. Authors such as [6] and [7] attempt to consolidate, based on the literature’s review, some metrics of the SCOR model. On the other hand [8] poses that there are no studies to be found on the ranking of the metrics that allow to measure the management of a chain in a better manner and much less in regard to fruit-growing chains.
According to [9], performance indicators enable to monitor the achieving of objectives within the supply chain. The SCOR model defines indicators called Key Performance Indicators (KPIs) to carry out the assessment of the chain.
Establishing the impact of an indicator on the measuring of a fruit-growing chain’s management becomes important because the products are perishable. The SCOR model measures the management regarding delivery trustworthiness, responsiveness, flexibility, costs and efficiency in the administration of assets. In [10] it is posed, additionally, that the limited application of managerial criteria in the agricultural sector and its lack of connection with the value chain hinder its evolution and development.
In the context of the SCOR model, we performed a sensitivity analysis on the metrics, selected according to their importance, considering structural and information constraints that persist in the fruit-growing supply chains. We build three scenarios with the intent to discover how the selected metrics are affected by the usage of the Hierarchical Analytical process. The Multi-Criteria Decision Methods (MCMD) enable us to establish the metrics to be used in measuring of the management of a chain where information is scarce. Moreover, the sensitivity analysis makes it possible to identify how the selected metrics are affected if the assumptions of the analysis change. An adequate selection of the metrics with regard to the characteristics of the chain may support the intervention for improving its efficiency and effectiveness, and just as Vergara et al. (2002) propose (cited by [4]), organizational success may be achieved.
2. Problem statement
Authors such as Farhoodmans cited by [1], pose that managing the supply chain efficiently makes companies gain competitive advantages, given that in addition to planning and managing all the activities of acquiring and purchasing, transforming and distributing, it is also sought to manage the coordination and collaboration between channels such as suppliers, intermediaries, logistics providers and customers.
The rural sector in Colombia has little integration, aside from little technological infrastructure to support it which implies difficulties in its performance. The medium rural zone of the city Guadalajara de Buga where this work is carried out is no stranger to such situation according to the data reported by the Secretariat of Agriculture and by the characterization report of said system.
The fruit-growing chain of the medium rural zone of the city of Buga, which is our case study, is studied from the perspective of management using the metrics of the SCOR model, where the greatest difficulty lays in applying such great number of metrics to the fruit-growing chain given its informality, which raises the issue of identifying which are the most pertinent metrics in order to measure the administration of the chain and how this selection is altered when some conditions of the analysis vary.
The metrics presented by the SCOR model are a finite set of possible usable metrics, without proposing levels of importance, and some basic ones that may be used in an information-restricted scenario as a starting point in order to measure the management of a poorly integrated supply chain. From that approach, the following research question arises: If we want to use metrics selected from the SCOR model in a poorly integrated fruit-growing supply chain, how is this selection affected by changes in the AHP methodology?
3. Methodology
As a starting point, we present a description of the fruit growing supply chain and define the links to consider within the analysis. The metrics associated to the attributes of the SCOR model are put forth (Reliability, Responsiveness, Agility, Cost, Assets). A tree of indicators structured by categories and type of process is presented in order to proceed with the enforcement of a discrete multi-criteria decision method, and determining the metrics that bear the highest importance for each level and associated attribute. Finally, the sensitivity analysis is carried out in order to know the changes in the selection of the metrics.
3.1. Application of the multi-criteria decision method
The Multi-criteria method proposed by [10] applied, called “Analytic Hierarchy Process” (AHP), in order to choose the metrics preferred in each level of the SC. Using mathematical notation, it may be expressed as follows:
Being Xij the metric of attribute i in level j, the set of metrics that measure performance will be given by:

Where m is the number of attributes and n the number of levels.
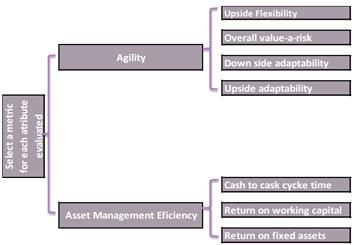
The multiple AHP is presented in Figure 1, which presents that for each attribute an AHP is carried out to select a level 1 metric; after the selected level 1 metric, another AHP is carried out in order to choose a level 2 metric, and finally one last AHP is performed on the level 2 metric to choose the level 3 metric for measuring the overall performance of the chain.

Each AHP performed must follow the sequence of steps established by Saaty just as mentioned in (12). The multi-criteria methodology adjusted to the case study is presented in a detailed manner next:
Step 1: We need to establish the objective of the problem that will be approached in each one of the AHPs in each level, and to identify the criteria that most influences the achievement of the indicated objective respectively, using the characterization of the supply chain.
Step 2: We then proceed to graphically represent the magnitude of the decision tree for each level as the structure set forth is built. This means that the starting point is the level 1 tree after the respective AHP has been applied, then the level 2 tree is built and the decision tree for level 3 is constructed in the same manner.
Step 3: We assembled a group of experts, and inquire them about the pairwise comparison using the valuation scale previously shown. After obtaining the valuations, the priority vector of the matrices is calculated as well as the constancy coefficient. Should the matrix be inconsistent, the expert is inquired once again so as to correct such inconsistency.
Step 4: After obtaining the valuations and weights for each of the alternatives (metrics) the one with the highest score will be chosen as the metric to measure the performance of the chain for the respective level of the specified attribute.
It is important to clarify that in order to perform the procedure on the level 2 metrics, said procedure must have been performed on the level 1 metrics first; and on the same line of thought, in order to carry out the procedure on the level 3 metrics, it must have been finished on level 2 and at the same time, the level 2 AHP will be the input that marks the beginning of the level 3 AHP.
Step 5: Once the results have been obtained, it is necessary to define how to use such results to measure the supply chain’s management with the SCOR model. It is attempted to set a plan in order to begin with the arrangement of the measures in the supply chain.
4. Application and results
In order to begin the application of the methodology, it is important to specify that the attributes of the SCOR will not be revised, and that this study will only focus on the metrics for each level. Given that the SCOR version 11 revises some metrics, it may be found that for some attributes where the SCOR model assesses the management of the supply chain, the metrics have been reduced to only one in the level I or strategic, which is why applying the tools for metrics selection is not necessary. Specifically, in order to measure the attributes of Reliability, Responsiveness and Cost they will not be subject to analysis in the first level of decision, leaving the metrics for the attributes of Agility and Asset Management Efficiency as the ones to be analyzed in the first level of the metrics structure. For the following levels 2 and 3 the metrics are multiple, therefore, the decision process on the metrics to be used will be completely pertinent.
Step 1: defining the problem’s objective.
We seek to define the most pertinent metrics for each one of the attributes established by the SCOR model to measure the overall management of a supply chain. This analysis is done in a tiered manner, which is why the metrics to be used in the measuring of each attribute are analyzed as first level, the most pertinent metrics to measure the level I or strategic metric associated to the attribute.
Finally, once the level 2 metric has been chosen, the level 3 metric that best responds to the measurement of the level 2 metric associated to the level 1 metric and its respective attribute is applied. In order to attempt a generalization of this procedure, the objectives are defined with the following:
Given: A set of attributes i ={1, 2...,5}, where i= Reliability, Responsiveness, Agility, Cost y Asset management efficiency.
Also given: A set of j level I or strategic metrics for attribute 1 given by = {Perfect order fulfillment); k for attribute 2 given by = {order fulfillment cycle time}; l for attribute 3 given by = {upside flexibility, upside adaptability, downside adaptability, overall value-at-risk}; m for attribute 4 given by = {total cost to serve}; and n for attribute 5 given by = {cash to cash cycle time, return of fixed assets y return on working capital}.
The goal of the AHP methodology applied to the first level is to establish such an arrangement (i,r) that enables to measure the management of the supply chain of the jurisdiction of Monterrey, considering its constraints and characteristics. Where the r set is formed by the metrics = {j, k, l, m, n} and there can only be one metric of the j, k, l, m and n type to define a set of arrangements (i,r) that becomes the solution vector v = {(1,j) (2,k) (3,l) (4,m) and (5,n) }.
The goal of the second level will be constituted by a set equal to the previous one, where the set i will be formed by the level 1 metrics selected in the previous process, which must correspond to 5 metrics {1, 2, 3, 4, 5}, and the set of level 2 metrics will be established to conform the solution vector with the arrangements (i, r), where r is just a metric associated to the level 1 metric. The same procedure is applied to the level 3 metrics.
4.1. The fruit-growing supply chain of Monterrey
The description of the fruit-growing supply chain is based on the characterization performed by [13] on the supply chain of the jurisdiction of Monterrey. We present some relevant information about this supply chain in the following paragraphs.
The jurisdiction of Monterey is made up by 5 small towns: La Unión, Miraflores, Miravalle, Monterrey and San José. It is inhabited by 242 families of which 180 work in agricultural activities. Forty three banana crops are identified with a yearly yield of 522,320 kgs; 36 plantain crops with 310,980 kgd/year; 3 blackberry crops with a yearly yield of 9,290 kgs, 5 crops of other citrus fruits with a 5,470 kgs/year, 6 lulo crops for a yearly yield of 61,160 kgs, 4 coffee crops that yield 6,630 yearly kgs approximately, 1 pitahaya crop with a yearly yield of 6,000 kgs and lastly an avocado crop with a yearly yield of 600 kgs; beans, corn pumpkin and yucca crops are also taken into account. The average production cost of bananas is 167 pesos/kg, 223 pesos/kg for plantain, 1500 pesos/kg for lulo, 3625 pesos/kg for coffee, 200 pesos/kg for pitahaya and lastly, beans are yielded at a 400 pesos/kilo cost.
As for pricing, 80% of time the price is set by the buyer. The cost and expiration criteria present no influence in determining the sale price. The study identifies a difference between the producer’s sale price to the intermediary that reaches up to 657% in the case of citrus, with regard to the final sales price to the final consumer. It is identified that the main difficulty in the process is transportation.
For trading, the study reports that in 62% percent of the cases the producers deliver their products at the door of the farm where the buyers pick them up; the other 38% takes charge of transportation themselves, and from that amount 24% uses a rented means of transportation or the “chiva” bus that goes around town; 14% have their own vehicle. The products are 43.41% marketed through intermediaries, 24.03% through associations, and 5.56% through points of sale, 2.12% through neighborhood stores and 24.89% through individuals.
The information regarding the supply chain’s characteristics points to a general breakup of the chain, due the following aspects:
Monterrey’s fruit-growing supply chain does not have a clearly defined distribution system, and does not show an integral strategic objective for its development.
Save for a group of banana producers, whom are associated, producers of other fruit types do not display interest towards integration with the purpose of improving performance and SC management.
The large difference in price between what the producer receives and what the final costumer pays is evident. This presents an opportunity to improve the livelihood of the producers, given that such price gap is not being distributed equitably among the links of the chain.
In general, in this supply chain producers grow the crops and sell them at their farm; intermediaries buy and carry to consumption centers, and retailers buy and sell at their retail center. This shows the supply chain is not articulated, which permits putting forth the hypothesis that income is not optimized.
Step 2: Graphical representation of the decision tree.
The tree structure for the hierarchical analysis begins with the level 1 of SCOR, keeping in mind that the attributes will not be subject to analysis but the metrics associated to each attribute will. As it was previously explained, the attributes of Reliability, Responsiveness and Cost are not within this level since a single level 1 metric corresponds to them.
According to the Agility criterion (see Figure 2) only one level 1 metric must be picked from the 4 alternatives available. Likewise, according to the Efficient Management of Assets criterion, a level 1 metric must be picked from the 3 alternatives available.
Once the level 1 metric has been selected, it is posed as a criterion, and the best fitting level 2 metric (alternative) is defined for that criterion. Lastly, we will select the level 3 metric (criterion) that responds to the level 2 metric (criterion).
After defining the metric that will measure reliability (See Figure 3) based on the perfect order fulfillment criterion, it becomes the objective; the criterion corresponds to the selected metric and the alternatives will be the level 3 associated indicators. As an example, if documentation accuracy is defined as the metric to consider, the decision tree will look as follows:


Step 3: Methodology for the selection of experts.
In the next step, the alternatives of metrics must be appraised in each one of the levels for each attribute. Such appraisal must be carried out according to the AHP methodology through a group of experts. Selecting the experts is a key stage which impacts on the results of the process since they are the people that will provide the appraisals.
For the selection of a group of case experts, Okoli and Pawlowski’s 2004 model (cited by [14]) is taken into account, which consists of 5 fundamental steps:
Elaborating a nomination table for knowledge resources.
Assigning the names of specific experts to the categories identified in the previous step.
Identifying additional experts.
Ordering of experts according to their experience.
Formally inviting the experts.
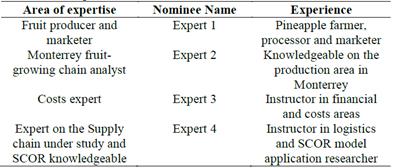
Next, Table 1 presents the development of steps 1 and 2 respectively.
Step 4: Synthetizing local priorities over the hierarchy to obtain a global result for each alternative
After choosing the relevant experts for the appraisal, a survey for each one of them was formulated. In such survey, the metrics were compared by pairs for each one of the attributes in every corresponding level.
After applying the surveys on the four experts, a global AHP initial appraisal was obtained with the following results:
Table 2 shows the total matrices appraised for each attribute as well as the total matrices for the issue at hand. Likewise, we can observe the amount of inconsistent and consistent matrices respectively. From the above, we will generate the percentages of consistencies and inconsistencies per attribute and totals on Tables 3 and 4, from the information gathered from the experts.
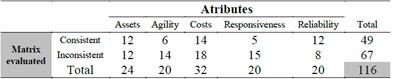
Table 3 Percentage of consistencies and inconsistencies per attribute.
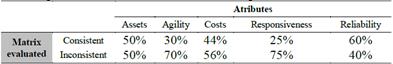
Source: Authors’ own elaboration.

After reviewing the previous results, in order to ensure the effectiveness of the method, we apply the methodology posed by [15] for the complete consistency of the matrices (method of the rectangles).
So, after having the matrices completely corrected and obtaining the weighings for each criterion (metrics and attributes), it was weighted with the criteria weights of each of the experts showed in Table 5 in order to finally reach the following results:

4.2. Importance weights of each attribute in the case study supply chain
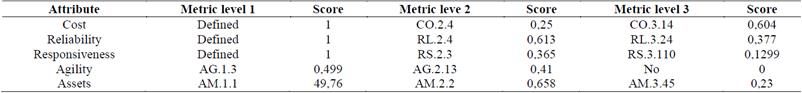
It is clear from Table 6 that the most important attribute in this supply chain is Cost with a 30.3% of importance, followed by Reliability with a 22.4%. Moreover, it is clear that the least important attribute is Assets with a weight of 8%. Next, we will show the metrics selected in each level for every attribute, in order of importance.

Costs: the level 1 metric for this attribute is defined by default according to the SCOR model, and it is the total cost of supplying.
The level 2 metric selected for this attribute is CO.2.4 which corresponds to the cost of production, obtaining a 25% importance according to Table 7.
Table 7 Level 2 comparison metric for the metric Total cost of supply (CO1.1) Level 1
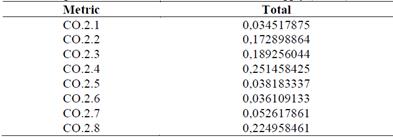
Source: Authors’ own elaboration.
Finally, the level 3 metric for this attribute is CO.3.14 (direct labor cost of production) with a 60.4% weight of importance according to Table 8.
Table 8 Level 3 comparison metric for metric Cost of Production (CO2.4) Level 2
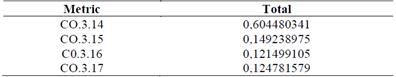
Source: Authors’ own elaboration.
Reliability: The level 1 metric selected for this attribute comes defined by default, according to the SCOR model, and it is the perfect fulfillment of the order.
The level 2 metric selected for this attribute is RL.2.4 which corresponds to perfect conditions, obtaining a 61.3% weight of importance according to Table 9.
Table 9 Comparison metrics for measuring Level 2 Compliance with perfect order (RL1.1) Level 1
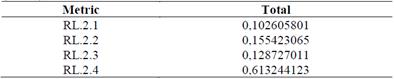
Source: Authors’ own elaboration.
Finally, the level 3 metric for this attribute is RL.3.24 (% of damage-free orders received) with a 37.7% weight of importance according to Table 10.
Table 10 Level 3 metric comparison for Perfect Conditions(EL.2.4) Level 2
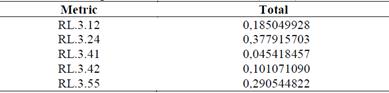
Source: Authors’ own elaboration.
Responsiveness: The level 1 metric for this attribute is already defined by default, according to the SCOR model, and it is the Order fulfillment cycle time.
The level 2 metric selected for this attribute is the RS.2.3 which corresponds to Delivery cycle time, obtaining a 36.5% of importance according to Table 11.
Table 11 Comparison metric level 2 for the metric Order Fulfillment Cycle Time (RS1.1) Level 1
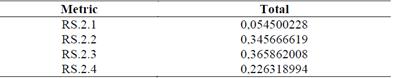
Source: Authors’ own elaboration.
Finally, the level 3 metric for this attribute is RS.3.110 (Delivery cycle time) with a 12.99% weight according to Table 12.
Table 12 Comparison metric level 3 for the metric Deliver Cycle Time (RS.2.3) Level 2
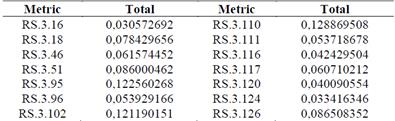
Source: Authors’ own elaboration.
Agility: the level 1 metric selected for this attribute is AG.1.13 which corresponds to Forward Adaptability, obtaining a 49.9% weight of importance according to Table 13.

The level 2 metric selected for this attribute is AG.2.13 which corresponds to forward Adaptability, obtaining a 41% weight of importance according to Table 14.
Table 14 Comparison metric level 2 for the metric Downside Supply Chain Adaptability (AG1.3) Level 1

Source: Authors’ own elaboration.
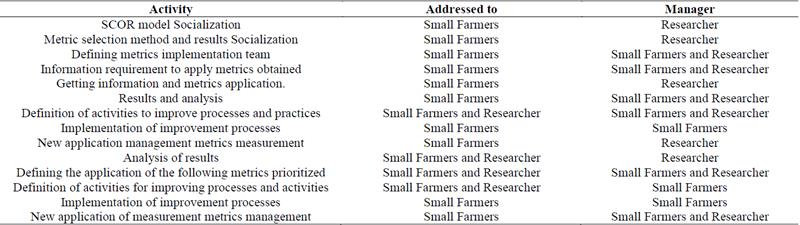
Step 5: Defining a path for the usage of the results obtained within the measurement of supply chain management with the SCOR model.
The multi-criteria analysis developed in this document is oriented towards determining the most important metrics for the set of the five attributes defined by the SCOR model as key in measuring the management of a supply chain. The results obtained enable us to establish at least one metric per attribute and level of analysis. However, the results also offers a prioritization that might be used as a critical route to apply additional metrics once the steps to implement the precedent metrics have been completed. This means that the defined metrics are shared with the actors in the SC, the required practices to obtain information are implemented, the metric is applied and initial information on the state of the SC management is obtained. By having these metrics implemented, it is possible to go back to the results and from there to continue to the next prioritized metric and perform the same process. All of this under the understanding that at present, the management of a supply chain bearing characteristics such as the one under study cannot be measured by implementing the SCOR model in full due to the fractured nature of the SC, which is why these metrics initially prioritized turn into a baseline to begin with the measuring process and implementing improvements.
This work plan (see Table 18) must systematize the application of the metrics in such a way that the priorities in the AHP are gradually covered and therefore improve the management of the chain over time. This suggests that small producers and other actors of the chain must participate decisively, most likely through several years, as required by the process of intervention.
For this attribute, the SCOR model does not present level 3 metrics.
Assets: The level 1 metric selected for this attribute is AM.1.1 which corresponds to cash-to-cash cycle time, obtaining a 49.76% weight of importance according to Table 15.

The level 2 metric selected for this attribute is AM.2.2 which corresponds to Days of Supply Inventory, obtaining a 65.8% weight of importance according to Table 16.
Table16. Comparison metrics level 2 for Cash-To-Cash Cycle Time (AM1.1) from Level 1

Source: Authors’ own elaboration.
The level 3 metric for this attribute is AM.3.45 (Days of Inventory for finished goods) with a 23% weight of importance, according to Table 17.
Table 17 Level 3 comparison metric for the metric Inventory Days of Supply (AM2.2) Level 2
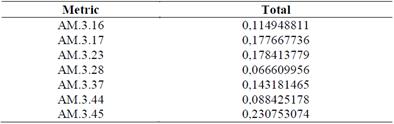
Source: Authors’ own elaboration.
5. Sensitivity Analysis
After selecting the metrics for each level of every attribute, the sensitivity analysis of the system is carried out taking into account three new scenarios, and taking the initial system as the baseline (see Table 19).
The first scenario assigns a weight equal to 25% for each of the expert opinions, which modifies the initial situation that assumes a differential weight for every one of them.
The second scenario considers the limitations for gathering information related to the metrics obtained from the initial system. In such sense, simulations are carried out removing the metrics obtained initially for the whole system, and leaving only the weightings for the expert judgement according to what was established in the initial system.
The third scenario combines the previous ones, meaning that the system is evaluated by eliminating the metrics obtained from the initial system and then pondering with weights equal to 25% for the expert judgement.
In the simulation of scenario 1 (Table 20), a change is produced in the level 2 metric of the costs attribute, moving from CO.2.4 (Production cost) to CO.2.8 (cost of sold goods). The level 3 metric CO.3.14 (Cost of direct production labor) is removed. Additionally, there is a change in the level 3 metric associated to the assets attribute which moves from AM.3.45 (Days of finished goods inventory) to AM.3.17 (Days of inventory - WIP).
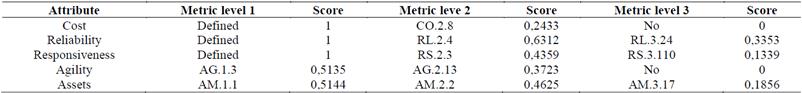
Regarding the level 2 metrics, CO.2.4 and CO.2.8, the new metric obtained is convenient since it includes costs associated with production, giving a wider outlook on the element of cost. This metric could be more useful in the measurement of the management of a SC, despite not having an associated level 3 metric.
Regarding the level 3 metric associated to the assets attribute, which went from AM.3.45 (Days of Inventory of finished product) to AM.3.17 (Days of Inventory - WIP) it could be said that both metrics measured separately offer a partial outlook on the chain. However, if we consider the capacity or rate at which the money invested in the productive process is recovered, it could be more useful to work with the AM.3.45 metric.
In the simulation of scenario 2 (see Table 21), the results obtained enable the metrics that scored second in the pondering, a fact that might seem obvious, but it must be understood that this generates significant changes in the level 2 and 3 metrics. For instance, the costs attribute moves from CO.2.4 to CO.2.28, a metric that corresponded to the second place when pondering among level 2 metrics. The attribute of reliability moves from RL.2.4 (Perfect Conditions) to RL.2.2 (Delivery to clients on the agreed-upon date) in level 2. Finally, the same occurs to the attribute of responsiveness where it moves from RS.2.3 (Delivery cycle time) to RS.2.2 (Production cycle time) in level 2.
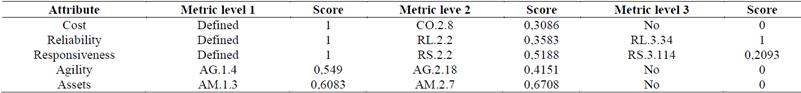
On the other hand, the level 1 metrics corresponding to the attributes of agility and assets move respectively from AG.1.3 (Forward adaptability) and AM1.1 (Cash flow cycle time) to AG.1.4 (Amount at full risk) and AM.1.3 (Return on work capital), which corresponded to the second pondering in the order of the level 1 metrics of the initial system.
Even though it’s complicated to precise the convenience of the metrics for this particular case, it seems that metrics obtained provide a wider outlook on the management of the SC.
When simulating scenario 3 (See Table 22), we observe that the metrics obtained for the level 1 and 2 metrics are consistent with the results obtained in scenario 2. In the case of the level 3 metrics, it presents a variation regarding scenario 2 for the attribute of responsiveness, passing from RS.3.128 (Cycle time of the finished product stage) to RS.3.114 (cycle time for releasing the finished product).
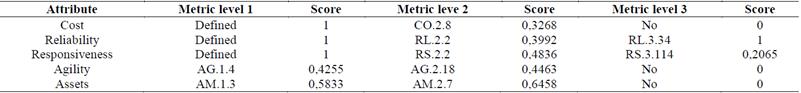
In general, according to the result obtained from the simulations, it may be observed that the variation of the percentage weights in the expert judgement does not change the model significantly, since it only modifies the percentages of selection but the preference is still the same in most cases.
On the other hand, a radical intervention such as removing the highest scores attained in the initial system completely modifies the system and brings about a completely different metrics approach given the escalated and sequential dependency of the lowest level with the highest level of the system. All of the above suggests that for this model, where all the metrics are given and selecting the most adequate ones is attempted according to the judgement of some experts, the AHP in general performs a reading very close to the intention or preference of the experts, since the obtained metrics finally reflect what the experts as a set have determined as the most important ones.
6. Conclusions
An important challenge of fruit-growing supply chains is to measure their management. Even though this measurement could be approached from various perspectives, the SCOR model offers a wide and integral outlook in order to determine the chain’s administration’s rate. However, the model assumes an integrated chain, which is far from the reality of small producers in fruit-growing chains; but by using multi-criteria decisions models it is possible to define a starting point that promotes the measurement of integration and management, starting off from the basic metrics selected by experts that permit to move forward in continuously improving the chain in terms of administration.
The multi-criteria analysis methodology is suitable to approach a complex problem such as selecting the metrics from the SCOR model, since there is a wide range of metrics, to identify those that best fit measuring the equally complex management of a supply chain, given its poor integration characteristics. Above all, this tool offers an alternative to adapt and propose an improvement route for the administration of the chain by using a widely accepted model such as the SCOR as reference for measuring the management of supply chains.
The sensitivity analysis shows that there are no major changes in the selected metrics when changing the weights of the metrics of the process, which points to an adequate soundness of the selected metrics, and it enables us to trust the application of these indicators as a starting point for a process of management improvement.
Developing a work plan is vital as a starting point for management measuring, but also as a proposal of adjustment and adaptation of an alternative route to implement the SCOR model in a fruit-growing chain that, in this case study, becomes highly important given the potentially great contributions it could bring to the development of small fruit-growers.

