


 English (pdf)
 Article in xml format
 Article references
 Send this article by e-mail
 Cited by SciELO
  Cited by Google
  Similars in
SciELO
Similars in
SciELO  Similars in Google
 Permalink
1. Introduction
Network data envelopment analysis (NDEA) models [1] have an increasing use in service evaluation. Despite standard data envelopment analysis (DEA) models having been widely used in assessing efficiency in education, to the best of our knowledge, NDEA models have not been used in this area, with the exception of a study by Johnes [2]. In that paper, the author used an NDEA model to assess the efficiency of English universities taking into account qualitative variables. In this paper, we propose using a NDEA model to assess the efficiency taking into account quantitative variables (bibliometric information). We will apply this NDEA model to the evaluation of some Brazilian post-graduated programs.
Post-graduation programs in Brazil have been evaluated since 1976 by CAPES (from the Portuguese Coordenação de Aperfeiçoamento de Pessoal de Nível Superior). This evaluation includes, among other things, following these courses yearly and assessing the performance of all programs and courses that compose the National System of Post-Graduation every three years. The results of this procedure are expressed in marks of a scale going from 1 to 7 and justify the course recognition renewal for the next three years. Although this assessment considers several factors, such as duration of classes, number of students and infrastructure, it focuses mainly on bibliometric evaluation.
CAPES evaluation considers published papers and, with two different measurements, divides that figure by both the number of professors and total number of theses presented. CAPES also ranks articles, considering the journal in which they were published by means of a system of fixed weights. This ranking, known as QUALIS, can be found at the institution’s site, www.capes.gov.br.
However, the fixed weight system is thought to be too rigid by some critics, and the two measures used do not reflect on their own the quality and productivity of the program [3]. It is also possible to use variable weights and one single measurement instead of fixed weights and two measurements. The variable weights should reflect the importance of the journal in which the article was published. One technique that allows us to do what is proposed is DEA. DEA usage has been widely spread over various areas of application, particularly in educational evaluation and as a bibliometric tool [4], whether to evaluate universities, as in Abramo et al. [5], or in post-graduation programs [3].
Weights allocated by traditional DEA models are calculated by a linear programming problem in such a way that each decision benefits the best combination of these weights with the purpose of maximizing their efficiency [6]. However, these weights may not be accepted as “fair” by all programs. However, as a certain “freedom” to determine these weights is given, an opportunity is created for each program to enhance its best features. As such, inefficient programs under these conditions do not perform well in any CAPES requirements.
A two-stage DEA model called NDEA [7, 8] is proposed in this work. It allows two indexes to be jointly calculated, whereas otherwise, they would be calculated independently as CAPES does in the evaluation of post-graduate programs. A set of engineering programs known within CAPES as “Engineering III” will be evaluated. The programs include mostly industrial and mechanical engineering courses. Subjective opinions that are consensual among the majority of the docent staff are also included in the models as weight restrictions [9].
As opposed to traditional DEA models, an NDEA model defines each DMU as a network of processes; in other words, it takes into account the internal system structure. In the NDEA model used in this work, the number of docent staff is taken as initial input, the number of dissertations and theses as intermediate products, and scientific production as final outputs. Thus, this model computes efficiency both under the productivity and quality of research aspects for post-graduation courses. In this article, both models of productivity and quality used in Soares de Mello et al. [3] are aggregated in one single DEA model. Data are those divulged by CAPES in its last evaluation triennium (2010-2012).
The proposed NDEA model is an alternative to the educational evaluation performed in Brazil. Nonetheless, its relevance goes beyond local use, as it takes into account variables inside the “black box” of standard DEA models in efficiency evaluation based on bibliometrics.
This article is organized as follows: Section 2 contains a literature revision both from the DEA education aspects and NDEA models. Section 3 describes the NDEA model and its formulation. Section 4 describes the modelling used in this work. Section 5 displays the results and discussions, and Section 6 presents the conclusions of this work.
2. Brief review of literature
2.1. Review of DEA in education
Charnes et al.[6] published the first ever article on DEA dealing with an educational evaluation. Initially, DEA was developed to evaluate organizations, with no financial considerations included, its focus being on educational aspects.
Since that publication, several articles and techniques have been developed in educational evaluation. Soares de Mello et al [3] evaluated the post-graduate programs of COPPE (Engineering Post-Graduate and Research Institute) of the Universidade Federal do Rio de Janeiro and revised DEA literature in education up to 2005. The aim of this study was to assess quality efficiency rather than strict educational efficiency. Thanassoulis et al. [10] have used DEA to evaluate the cost structure of UK universities.
Gomes Jr et al. [11] have shown the use of non-radial indexes in DEA and their application to identify non-radial targets for CEDERJ poles. This application included the calculation of the non-radial efficiency of these poles. Several other works have used this methodology to calculate either efficiency or benchmarks for professors, courses and teaching institutions. For example, Tyagi et al [12], França et al [13], Bougnol and Dulá [14] can be mentioned, among others.
2.2. Review of NDEA
The foundations of NDEA were established by Färe and Grosskopf [7], who proposed the opening of the so-called “black box”. However, the first works that used NDEA implemented a traditional DEA model for each stage independently, paying no attention to the continuity of the relationship between stages. Among these works, Zhu [15], Sexton and Lewis [16] and Soares de Mello et al. [3] should be mentioned.
Chen and Zhu [17] proposed a DEA model with constant scale returns that would not treat the efficiency of each stage independently. More recently, Kao [8] took into account the continuity among stages with a multiplicative relation called the relational NDEA approach. However, Chen et al. [18] proposed an additive relation among stages in the so-called additive NDEA model. Soon after, Tone and Tsutsui [19] adapted the SBM (Slack-Based Measure) model to the additive NDEA model. Moreno and Lozano [20] have successfully used it to evaluate the efficiency in the NBA (National Basketball Association). An application to evaluate Brazilian electricity distributors has been performed by Moreno et al. [21]. A comprehensive review of NDEA in both theoretical and application aspects can be found in Kao [1].
It should be mentioned that, until now, no use of relational NDEA models to measure efficiency of post-graduate programs, as has been done in this work, has been found. Nonetheless, to the best of our knowledge, an NDEA model in educational evaluation has been used by Johnes [2] and Toloo et al. [22] but not in a bibliometric context.
3. Multiplicative relational NDEA model
Traditional DEA models, such as CCR (Charnes et al. [6]), have been shown to be adequate for efficiency analysis of production units that use multiple inputs and outputs. These production units are usually called decision-making units (DMUs). Efficiency is computed by comparing each DMU’s input and output level with all other DMUs.
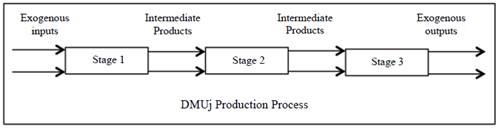
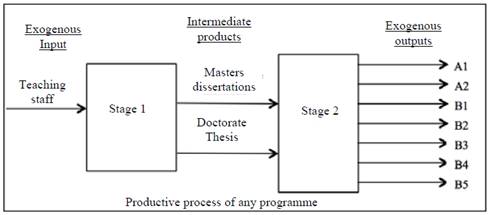
As previously mentioned, one of the characteristics of traditional DEA models is the neglect of the internal stages of each DMU and its connections (intermediate products). The existence of connections between activities is indeed an indispensable characteristic of NDEA models. Although NDEA models can be found in various configurations, the serial multistage model is the most common. The production diagram of three hypothetical stages is shown in Fig. 1.
To be globally efficient, the structure of NDEA models makes it imperative for a DMU to be efficient in each sub-process or stage. It may even happen that not a single fully efficient (100%) DMU exists when the whole process is taken into account. This modelling implies that all intermediate products are produced and consumed within the DMU, whereas input and output are exogenous to the internal structure. Other than computing overall efficiency, NDEA models provide efficiency indexes for each stage as all possibilities of production are modelled for each stage. In other words, each sub-process has its own technology and thus defines its own set of weights and reference units.
Kao and Hwang [23] have proposed the multiplicative relational model to relate the stages to each other. This model is based on the constant return scale DEA model [6], in which E0 is DMU 0 efficiency. Its fractionary mathematic formulation is presented in (1). Let s be the number of outputs and m the number of inputs, 0 being the DMU under assessment.
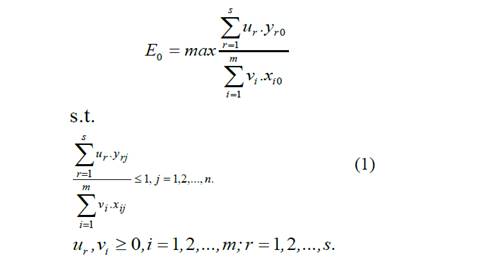
Where yrj is the output r of DMU j and xij to the input i of DMU j, whereas ur and vi are the multipliers associated with output r and input i, respectively.
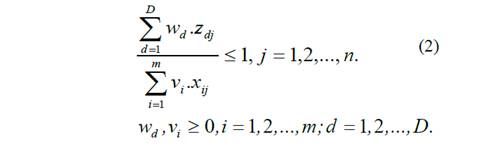
In a two-stage model, there will be D intermediate products that behave as outputs from the first stage and inputs to the second stage. Intermediate products are therefore both consumed and produced within the system. Efficiencies that are computed independently are obtained from models (2) and (3), where E 0 1 and 𝐸 0 2 correspond to stages 1 and 2.

s.t.

s.t.
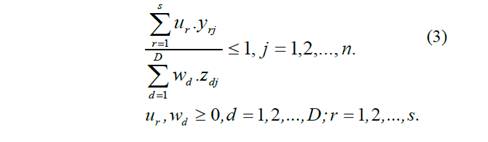
Where z dj corresponds to the intermediate product d of DMU j, w d being its multiplier. According to the relational model proposed by Kao and Hwang [23], global efficiency E0 of a two-stage series system is computed by model (4). They included restrictions of models (2) and (3), namely restrictions concerning stages 1 and 2, into model (1) to incorporate the interaction between the two stages.

s.t.
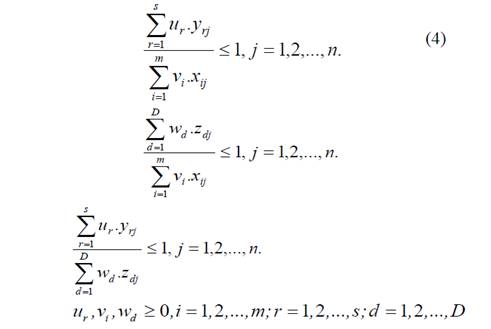
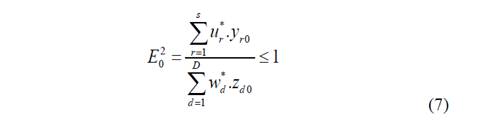
Please note that the additional constraints to model (1) (i.e., the second and third restrictions of model (4)), ensure that the efficiency of stages 1 and 2 are not greater than one. Once model (4) is computed, overall efficiency E 0 and the individual efficiencies 𝐸 0 1 and 𝐸 0 2 of stages 1 and 2 of DMU0 are obtained from equations (5), (6) and (7) respectively.


Where 𝑢 𝑟 ∗ , 𝑣 𝑖 ∗ and 𝑤 𝑝 ∗ are the optimal weights calculated by model (4). Overall efficiency (8) is the product of the individual efficiencies for each stage.

This formulation assumes that the intermediate products have the same weight (i.e. the same multiplier) irrespective of being output in the first stage or input in the second stage. This assumption provides the link between the two stages and allows factionary model (4) to become the linear programming model (9).

s.t.
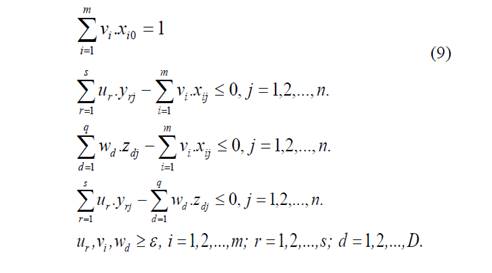
The optimal weights of model (9) may not be the only possible ones, and neither may the decomposition of overall efficiency E0 into stage efficiencies 𝐸 0 1 and 𝐸 0 2 be the only possible ones. Kao and Hwang [23] have proposed the maximization of one of the individual efficiencies, 𝐸 0 1 , for instance, while overall efficiency E0 computed by model (9) is kept constant. Thus, the other individual efficiency 𝐸 0 2 is obtained from (10).

4. Modeling
When assessing the quality of post-graduate courses, the objective is to evaluate the ability of each program to publish the development of their research both at the master and doctoral degree levels. If a program has a low index of publications of its research, it is considered low quality. If it has a high ratio of published papers (or any other academic production), mostly in reputed international journals, this is taken as the program being of high quality.
The objective of this work is to evaluate the ability of the teaching staff in the CAPES Engineering III area programs to lead their students to obtain their master’s or doctoral degrees and therefore to publish their research. As the research for the thesis or dissertation is an intermediate step for the final publication, a two-stage relational multiplicative NDEA model is applied, as described in Section 3. In this model, DMUs are the post-graduation courses in which the master’s degree or doctoral thesis is finished during the 2010-2012 three-year period. The initial input variable (exogenous inputs) is the number of teaching staff in the post-graduate programs. The number of dissertations and doctoral theses are the intermediate products, and the final outputs (exogenous outputs) are the publication of scientific articles in scientific journals evaluated by CAPES. There are seven final outputs corresponding to the QUALIS ranking of such journals: (A1, A2, B1, B2, B3, B4, and B5). The NDEA model assesses the efficiency of the post-graduate programs both from productivity and quality perspectives, as it provides efficiencies in both stages: production of dissertations and theses during the first stage and scientific articles in the second. It also provides the overall efficiency of the programs: productivity in the first stage and quality in the second. Fig. 2 displays a post-graduation program process scheme. We shall note that the term “exogenous” is used as in standard NDEA literature; that is, it refers to a variable that is not inside a production process, as done for instance by Kao [8] or Moreno et al. (2015).
It should be noted that the period of time for the model was selected to be coherent with that of CAPES, which considers publications and thesis for the same three-year period. The hypothesis accepted in this work is that there is a certain stability during time between dissertations, theses, and their publications. This is also accepted by CAPES evaluation, as there is no way to determine when a thesis will be published as an article. In truth, it can be either before or after being judged by an academic jury.
Moreover, for the final outputs (exogenous outputs), some considerations are made. To consider publication in different journals, we have introduced weight restrictions respecting the same ordinal preference stablished by CAPES with its fixed weights system. In short, the weight for one A1 publication is greater than or equal to the weight for one A2 publication; that is, a publication in an A1 journal is more important or least equal to a publication in an A2 journal. Similar restrictions are included to compare A2 and B1, B1 and B2, and so on. In addition, we use the same saturation criterion used by CAPES for publications in B2 or lower classified journals: the maximum number of publications in each of these classes cannot exceed three times the number of teaching staff. Finally, the weights of number of theses is greater than or equal to the weights of number of dissertations.
Concerning the choice of returns to scale, we shall note the following: if the program has well-defined criteria to hire professors, it is reasonable to believe that an increase in the number of professors will correspond to a proportional increase in the number of publications. For the same reason, the number of students can also be increased proportionally. Thus, the unbounded radius axiom [24], a condition to be able to assume constant returns to scale, is respected regardless of whether the size of institutions is similar. The use of constant returns to scale is coherent with the CAPES evaluation that uses plain ratios, which is equivalent to a simplified CCR model.
The model used in this work is presented in (11). It is an evolution of Kao and Hwang [23] shown in (9), from which the restriction 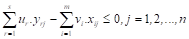 has been withdrawn. The restriction is redundant, as demonstrated by Kao [8] and Chen et al. [18].
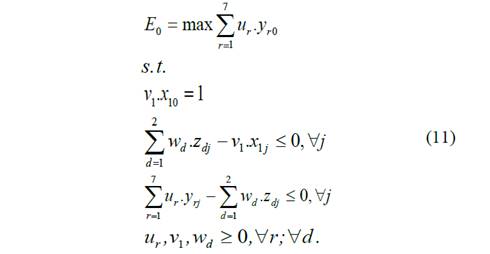
where x 1j refers to the number of teaching staff in post-graduate programs, y rj (r = 1...7) to the number of papers published in journals classified in the seven QUALIS grades and z 1j , z 2j the number of master’s dissertations and doctoral theses, respectively, of DMU j. Moreover, weight restrictions were included as described previously, being related to dissertations and doctoral theses, which are more important or at least equal to dissertations, as well as related to publications. These set of restrictions are shown in (12):

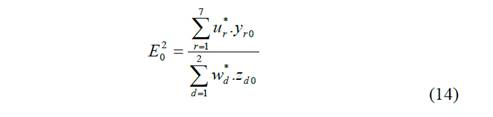
Different from standard DEA models, the objective function is not an efficiency. The efficiency of both stages 1 and 2 are given by equations (13) and (14), respectively, whereas overall efficiency is given by equation (15).


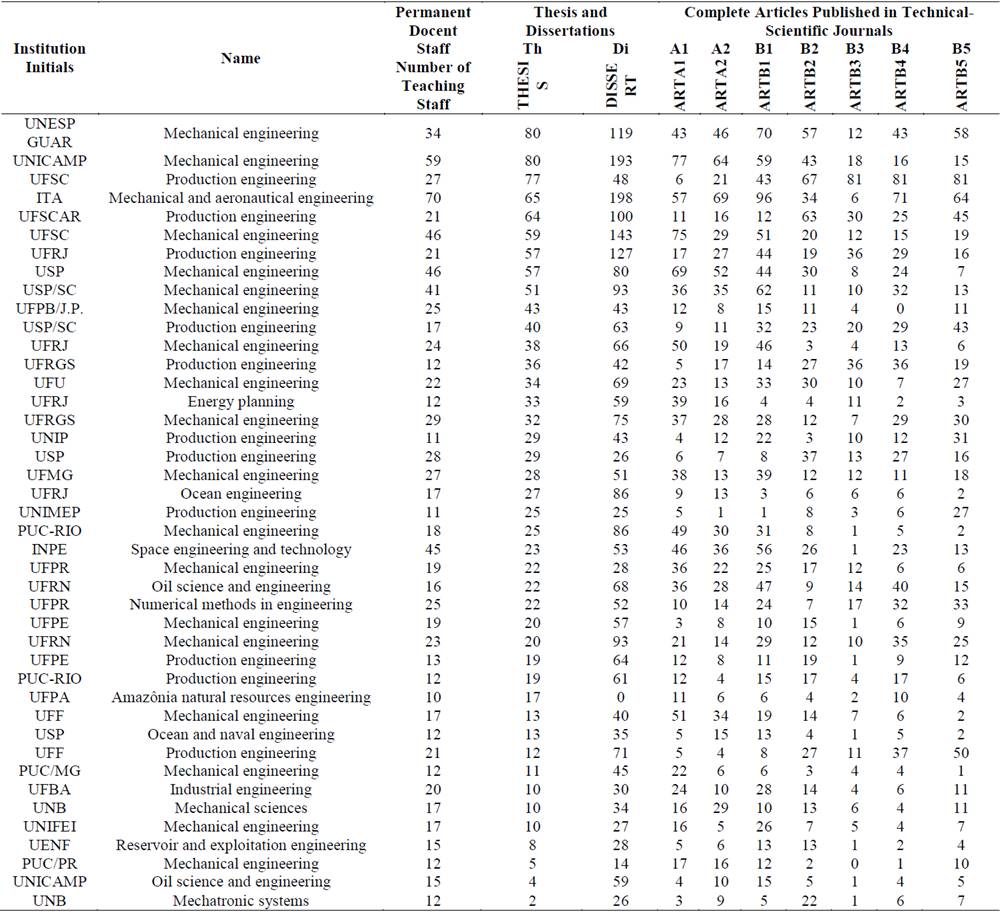
Data from the last three-year period (2010-2012) from 42 programs divulged by CAPES are depicted in Table 1. Only PUC/PR - Pontifícia Universidade Católica do Paraná Production Engineering and Systems program was not analyzed, as it only began in 2011.
5. Results and Discussion
Table 2 shows the efficiencies obtained by the two-stage relational multiplicative NDEA model used.
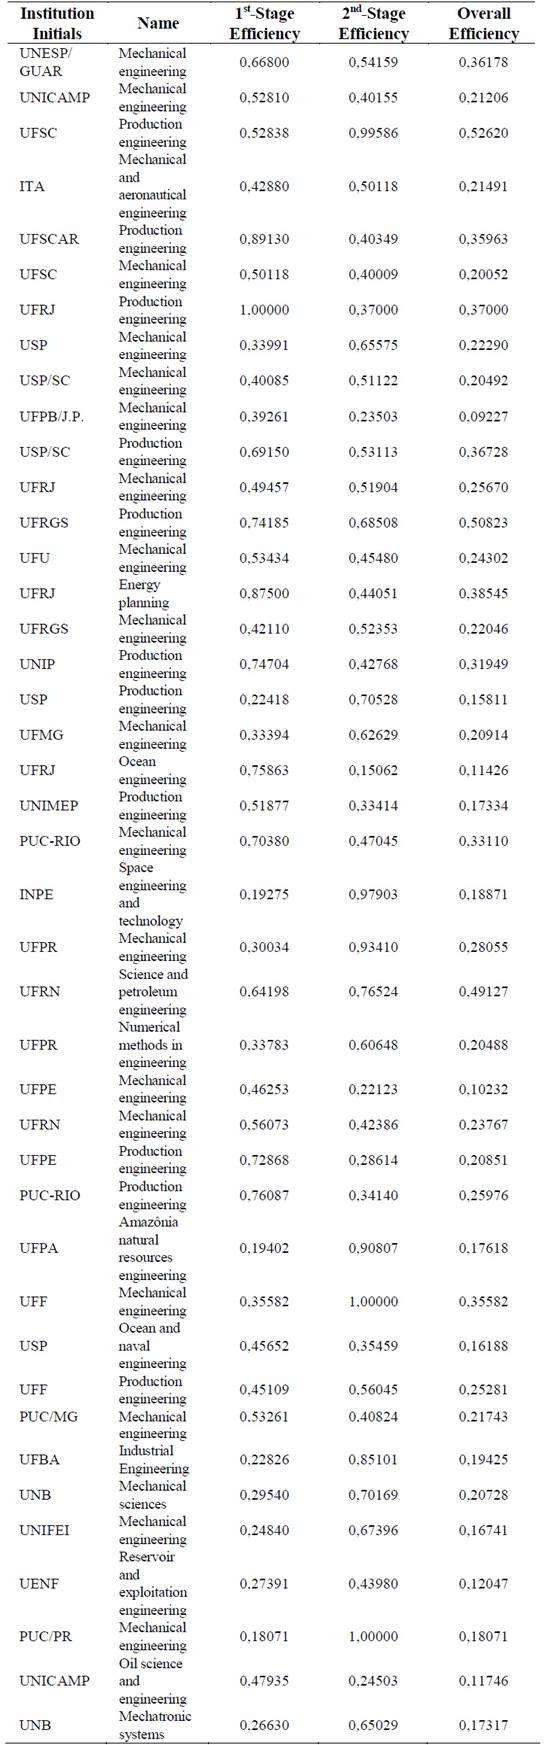
From the results, the Mechanical Engineering of Universidade Federal do Rio de Janeiro (UFRJ) was the only efficient one in the first stage. This is because the program produces a high number of dissertations and theses and has a low number of teaching staff registered in the program. Nonetheless, efficiency is not maintained in the second stage, as the number of publications is not as high as for other programs. Thus, the overall efficiency of the program is low despite the high number of theses that do not succeed in being published.
The sole efficient program in the second stage was that of mechanical engineering of the Pontifícia Universidade Católica do Paraná (PUC/PR), as it a high number of publications in relation to the number of dissertations and theses. However, this program has low first-stage efficiency with a low number of theses, resulting in low overall efficiency.
The highest overall efficiency program is that of production engineering at Universidade Federal de Santa Catarina (UFSC), as it produces a high number of dissertations, theses and publications. For instance, it was the only course that succeeded in reaching publication saturation in three different categories of journals (B3, B4 and B5).
Finally, Universidade de São Paulo (USP) the production engineering course displays the lowest index for overall efficiency, as it has the highest number of teaching staff and a low number of publications.
5. Conclusions
In this paper, we use an NDEA model as an alternative to evaluate some post-graduate programs in Brazil using bibliometrics. The use of NDEA rather than classic DEA has had the advantage of separating the post-graduate production process in two consecutive stages. Both the preparation and argumentation of master’s degrees or doctorate theses were taken just as intermediate products for the creation of process outputs. These included publications in journals accepted by CAPES in its three-year review of post-graduate programs and the individual efficiency of those publications. In addition, splitting the production process has allowed detection of the sources of inefficiency in all of these programmes. We can say that if CAPES were to use a model such as this, it could take advantage of its comparative structure, as CAPES’ performance measures are always comparative. However, we cannot compare the results obtained here to those obtained by CAPES because its entire performance evaluation takes into account factors other than those that are bibliometric.
It should be noted that no single program was assessed as wholly efficient.
It is also clear that every program needs to be improved upon, and targets can be provided for each program.
Although the NDEA model was used for a local educational efficiency problem, we have shown that, like standard DEA, NDEA can also be used as a bibliometric tool, along with other educational evaluations.
Moreover, NDEA models are more suitable to evaluate efficiency of post-graduate programs or research teams than evaluations based on the h-index or h-type indexes. In fact, for evaluation of research teams, the h-index presents serious inconsistencies [25,26].

