


 English (pdf)
 Article in xml format
 Article references
 Send this article by e-mail
 Cited by SciELO
  Cited by Google
  Similars in
SciELO
Similars in
SciELO  Similars in Google
 Permalink
1. Introduction
A basic requirement for propulsion of electric vehicle is a portable energy source which allows conversion of electrical energy into mechanical energy in the electric motor. One of the technologies widely used to feed the electric vehicle is obtained by transforming the chemical energy stored in devices such as batteries and fuel cells; therefore, these devices become a focus of research to improve the services they can provide according to the recharging system.
This research has given great importance to the charging model, whereas battery allows the characterization of the vehicle depending on traveled distance, power capacity, weight, cost, and lifetime [1], through an attempt to ensure that behavior during recharge will be close to reality and the model can be applied to the most representative electric vehicles in the market.
Considering battery behavior within a dynamic frame of reference, it is possible to evidence the impact of recharging a set of vehicles with different characteristics, which can be extended if the traveled distance by these vehicles is different until their next battery recharge.
This random component is a starting point for adding the load represented by the vehicles in a residential distribution system and allows analyzing different case studies.
The objective of this research is to present a methodology for characterizing the consumption of electric vehicles based on the battery capacities, considering the model proposed by Tremblay [2] and the characteristics of some batteries presented by Martinez [3], so the increment of power consumed by a residential distribution circuit can be evaluated from the random behavior of three variables: battery capacity, time of connection, and discharged energy.
2. Methodology for characterizing the dynamic consumption of electric vehicle based on battery capacity
This paper proposes a methodology for finding the probability function of battery capacity of vehicles connected to the distribution system at a given time. In this regard, the characteristic curve for charge and discharge of battery is constructed using data provided by manufacturers and implementing the battery discharge model developed by Tremblay [2].
Additionally, it is possible to know the probability function of energy requirement of batteries. To that end, a number of hourly electric vehicle connections is randomly generated from mobility data of the city. The steps defined in this methodology can be summarized as follows:
Define the distribution system to which a number of electric vehicles are expected to be connected.
Generate a random number of electric vehicle connections based on the number of load nodes in the system and the quantity of trips by private vehicles in the city.
Select a battery charging method seeking to preserve battery life and set the variables involved in the non-linear recharging model of the battery.
Group batteries according to the capacity of those commercially available.
Construct the characteristic curve of battery charge and discharge, from steps 3 and 4.
Run the load flow to determine the hourly power consumption of electric vehicles according to charge characteristics of the batteries.
Construct a probability distribution of expected battery capacities.
Construct the probability function of the energy consumed by electric vehicles connected to the system using average specific consumption of the most representative electric vehicles in the market.
3. Battery charging and discharging methods
An electric battery has the capacity to store certain amount of energy to be delivered later. This parameter determines the distance that an electric vehicle can travel until battery discharge, and it is expressed in Ampere-hour (Ah) as a measure of current flowing by the battery during an hour [4]. However, in practice, this is not how it works, because batteries are highly non-linear electrochemical systems, governed by a complex mixture of laws of thermodynamics, electrode kinetics, and ion transport phenomena [5].
In order to make a distinction between battery capacities, indices were established to obtain battery capacity when discharging at a certain rate, denoted with letter C. For example, when indicating that a battery has a capacity of 40 Ah, this is interpreted as C = 40 Ah, and if it discharges at a rate of 0.2 C, discharge current is 8 A. Similarly, a subindex that allows determining the time in hours the battery takes to discharge is included; this means the slower discharge is, the more energy the battery can provide [6].
A battery is considered fully discharged when its voltage drops below certain value [3]. Usually from that value, battery voltage decreases abruptly; this directly affects the relation capacity [Ah] voltage [V], i.e. the energy stored in the battery [Wh].
From this relation, parameters of the main charging methods to preserve battery life in each recharge are defined, as summarized below:
3.1 Constant voltage method
It consists in applying a fixed voltage on battery terminals initially limiting the input current; due to low battery voltage, current would be very high and overcharge the device. Charge current can be high at the initial stage and it gradually decreases to zero when the battery is fully charged. The disadvantage of this method is the requirement of very high power at the initial stage of charging, not available for most residential structures [7].
3.2 Constant current method
In this scheme, charging voltage applied to the battery is controlled, thereby allowing its increase while the battery is charged with a constant current. The challenge of this method is to define the time when the battery completes its recharge. At this time, the supply cuts to avoid temperature increase, the minimum voltage changes or the expected charging time exceeds [8,9].
3.3 Combination of constant voltage and constant current method
At the initial stage, the battery can be pre-charged at a high constant current, while voltage increases. When battery voltage reaches certain threshold, the voltage remains constant and the current begins to decrease. In this way, battery voltage remains constant if recharging is complete and it is still connected to power supply [3].
One of the most used methods for recharging lithium ion (Li-ion) batteries is the combination of constant voltage and constant current [10] due to the sensitivity of the cells to overcharge, since charge control can accurately modify the variables determining the power consumed by the battery.
The effectiveness of this method also depends on the estimation of battery state of charge (SoC). This provides a percentage of battery capacity with respect to its nominal capacity, in order to control voltage and current under its actual charge condition. However, more variables are expected to determine this, such as temperature and useful life of battery, so that several methods can take into account the dynamic behavior of cells to determine the state of charge [11].
In order to develop the proposed consumption model, the recharges using the combination of constant voltage and constant current method as well as the estimation of the state of charge (SoC) for a given consumption condition are considered.
4. Electric model of battery recharge
Experimental and electrochemical models are not well adapted to the representation of dynamic battery for estimating the state of charge; this requires extensive experimentation and more complex computer processing [12,13]. By contrast, electric models represent electrical variables in a simple way, including analysis of state of charge.
The simplest electric model is an ideal voltage source in series with an internal resistor [14]. Although it does not take into account battery state of charge, it was extended to a circuit which includes the open-circuit voltage in series with a resistor and a parallel RC circuit; this arrangement is known as Warburg impedance [15]. The identification of the parameters of this model is based on the technique of impedance spectroscopy [16].
However, Shepherd wrote an equation to describe the electrochemical behavior of a battery in terms of terminal voltage, open circuit voltage, internal resistance, discharge current, and state of charge [17]. This model has been widely used, improved and even adopted in battery simulation as a generic element in Matlab/Simulink libraries [18]. One of the main modifications to the Shepherd model was to define a polarization voltage instead of a polarization resistance in order to remove the loops generated in Simulink. This model, proposed and validated by Tremblay [2] in electric vehicles, is used as a reference to describe the behavior of battery recharge during this research. The model consists of a dependent voltage source and a resistor in series, as shown in Fig. 1.
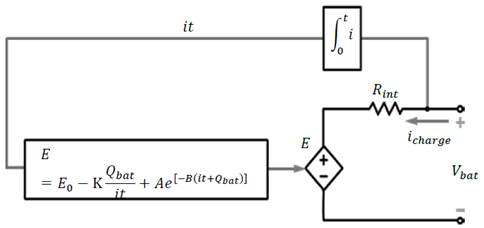
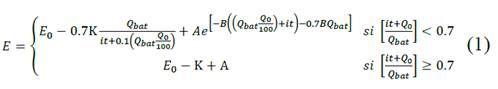
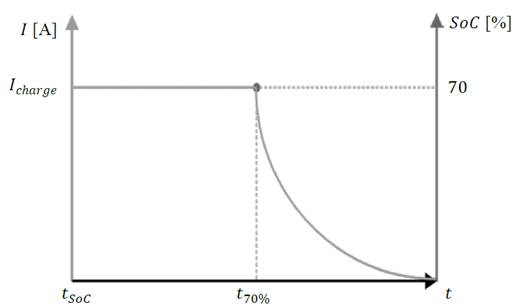
Based on this model, the behavior of internal voltage of battery is described in (1) and graphically represented during recharge in Fig. 2. It is important to note that the maximum voltage is reached at 70% of charge and remains constant while the battery is still connected to the power supply.
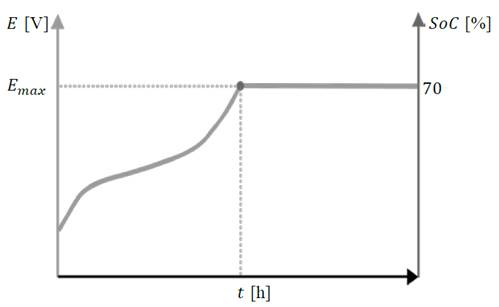
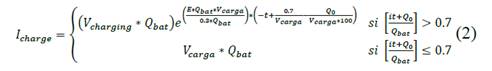
Likewise, as the selected method establishes, the behavior of the charging current of the battery would be opposite to the internal voltage, as shown in Fig. 3, exponentially decreasing to zero when it reaches 70% of charge, as shown in (2).
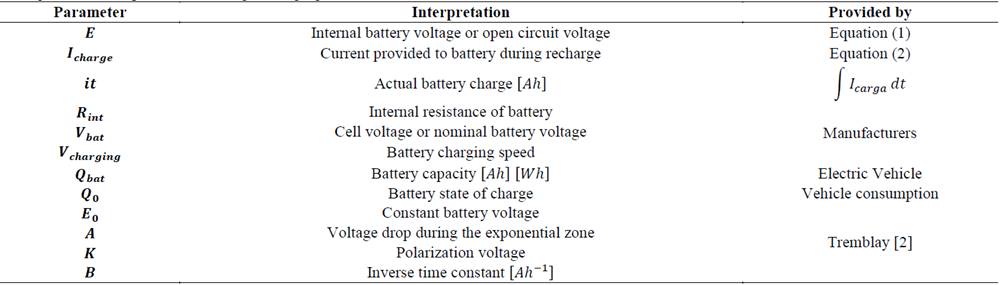
In order to identify the parameters in voltage and current equations, battery manufacturers show the characteristics for one cell. However, an electric vehicle battery consists of several cell arrangements; this involves determining the parameters of a particular battery based on a set of cells. To do this, the characteristics of a set of cells up to reach battery capacity and voltage are associated in [3]. Once the number of cells and their distribution are determined, other model parameters are calculated as described in [2]. In order to determine the parameters characterizing equations (1) and (2), values adopted in [3] are shown in Table 1 and used as a reference.
4.1 Battery classification based on capacity
Based on the electric model proposed by Tremblay [2] and data sheets of manufacturers, Martinez [3] calculated the parameters of some types of batteries of the most representative electric vehicles in the market and classified them into five categories according to their nominal capacity, as summarized in Table 2.
Table 2 Battery parameters of the most representative electric vehicles available in the market
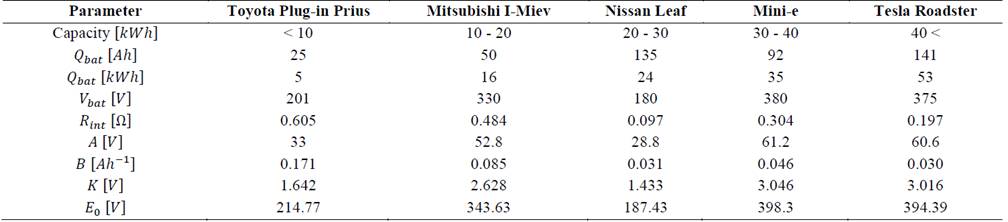
Source: D. Martinez [3].
The parameters shown in Table II will be used as a starting point in the research to calculate the characteristic of consumed power by an electric vehicle while charging its battery, considering that this will depend on the SoC, charging rate, and battery capacity. This ensures that several vehicles that have traveled the same distance will not necessarily follow the same charging curve, since the capacities of their batteries are different.
5. Probability function of expected battery capacities for electric vehicle
In order to consider the variability of the batteries used by electric vehicles, the expected battery capacities are modeled by means a probability distribution [3], generating random samples based on the characteristics of electric vehicles available in the market, as shown in Table 3 [3].
Table 3 Expected Capacity and Consumption Characteristics of Different Types of Electric Vehicles Available in the Market
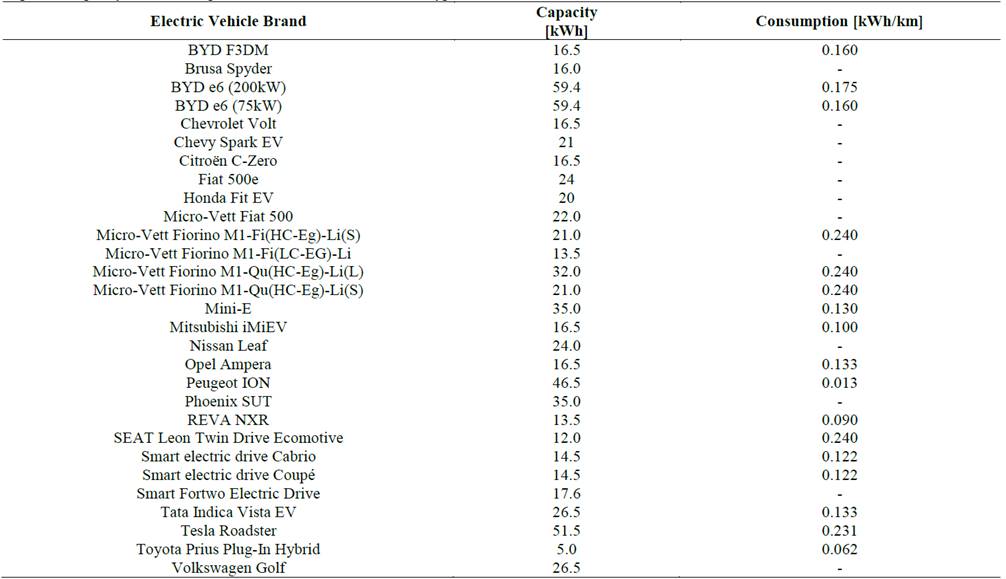
Source: The Authors.
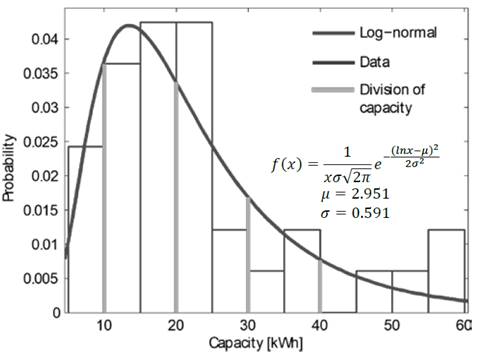
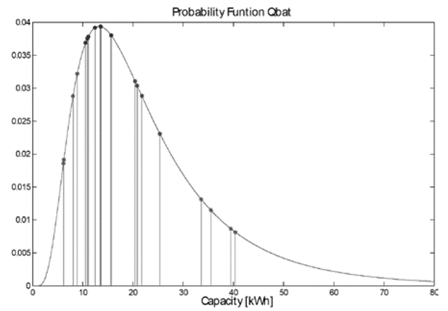
Grouping these capacity values, as shown in Fig. 4, a logarithmic normal probability function is obtained [3,19] divided into five segments. As can be seen, it is more likely that those vehicles with batteries between 10 and 20 kWh are connected. However, advances about batteries are related to the increase in their energy density in order to extend traveled distances; therefore, it is expected that current capabilities will be multiplied by 10 by 2020 [20].
6. Case study: 56 node distribution system
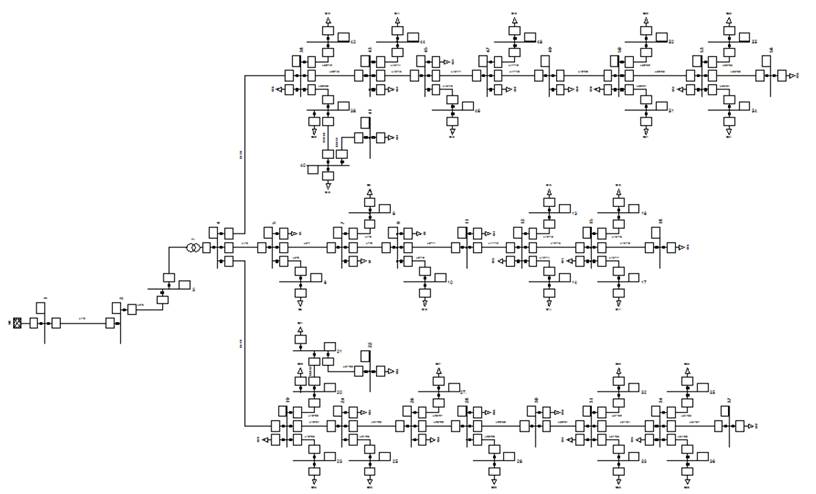
In order to develop this case study, a 56-nodes test system was selected; it has bus bars of 23 kV and a low voltage network of 415 V. The system has three low voltage feeders with 18 nodes representing residential users. It is assumed that each node has the same probability of one electric vehicle connected. This topology was taken from the study conducted by Deilami and Masoum [21] in order to compare obtained results; it can be seen in Fig. 5.
Once the system is selected, from the trip distribution by private vehicles in Bogotá Colombia and the number of load nodes in the network, a random number of vehicles expected to connect is generated [22]. Likewise, the method selected to be used for battery recharge is the constant voltage and constant current combination, considering the implicit variables of the non-linear electric model proposed by Tremblay, as explained in Section 4.
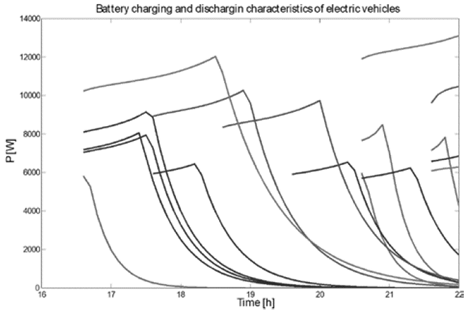
According to these considerations and taking into account battery classification shown in Table 2, battery non-linear charging and discharging characteristics are generated. To do this, a simulation between 16:00 and 22:00 with a penetration level of electric vehicles of 100% was scheduled; the results obtained are shown in Fig. 6.
Source: The Authors.
Figure 6 Battery charging and discharging characteristics of electric vehicles generated between 16:00 and 22:00 hours.
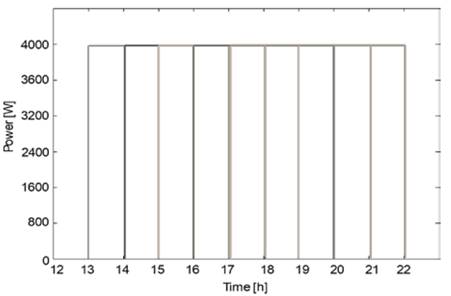
Fig. 6 shows that the proposed methodology allows the non-linear battery behavior to be determined; this makes maximum power consumption vary according to the number of connected vehicles and the capacity of their batteries. This represents a major difference from the results obtained by Deilami and Masoum [21], who pioneered the characterization of electric vehicle consumption and assumed that all the batteries of electric vehicles have the same capacity (10 kWh) and an associated charging rate of 8 kWh; this allows linear charging characteristics to be obtained, as shown in Fig. 7.
Source: The Authors.
Figure 7 Battery charging characteristics obtained from the methodology proposed by Deilami and Masoum [21].
The advantage of obtaining a non-linear charging characteristic, as the one proposed in this paper, is that the method for managing energy of electric vehicles [23] may consider this power variability and select the charging combination that meets the constraints of the system under study at a given time [24,25].
Although Fig. 6 shows the power requirement and total charging time according to battery capacity, this is important to find the probability function corresponding to the capacity of batteries expected to be connected to the system, as presented in Section 5. Based on the obtained results in this case study, it is possible to state that the batteries between 10 kWh and 20 kWh are the ones most likely to be present in the distribution network, as shown in Fig. 8.
Source: The Authors.
Figure 8 Probability function corresponding to the capacity of batteries expected to be connected to the system between 16:00 and 22:00 hours.
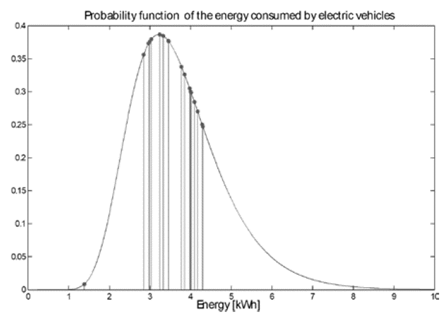
On the other hand, the energy required by the electric vehicles can be represented by a probability function [22], as shown in Fig. 9. According to these results, it was possible to state that energy consumed by vehicles connected between 16:00 and 22:00 to the distribution system under study is between 2.8 kWh and 4.3 kWh.
Source: The Authors.
Figure 9 Probability function of the energy consumed by electric vehicles connected to the distribution system between 16:00 and 22:00 hours.
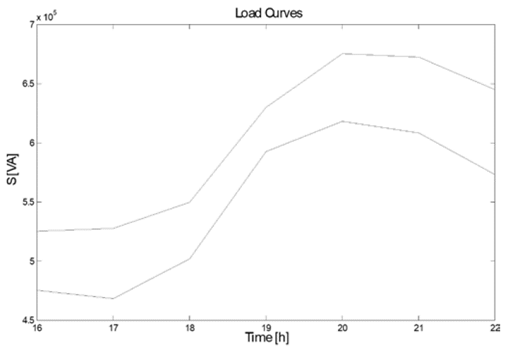
Finally, the effect of simultaneous connection of electric vehicles on the load curve of the transformer feeding the distribution circuit was analyzed [26], and it was obtained that on average the increment in the load curve is 10%, compared with the case without vehicles, as shown in Fig. 10.
7. Conclusions
By establishing the non-linear behavior of battery recharge of electric vehicles, the variation in peak demand on the system at a given time can be determined. This would allow the network operator to consider whether the charging condition would be favorable for the network.
Likewise, the non-linear model proposed by Tremblay allows the construction of different charging characteristics depending on battery capacity, SoC, and type of vehicle connected to the system. According to these and taking into account the probability function of battery capacities, it is possible to deduce that most vehicles expected to be connected to the system are hybrid.
Given that the methodology proposed in this research is based on random charging conditions, it is possible to apply it to any distribution system and for different case studies, as long as an arrival model of electric vehicles and discharged energy in battery is considered.
Finally, by finding the probability function of consumed energy, the behavior of both the batteries and the load curve of the distribution circuit can be predicted: the network operator could analyze the existing infrastructure in terms of demand increase.

