SciELO - Scientific Electronic Library Online

 
vol.85 issue204Conservation of "Paluma" guavas coated with cassava starch and pectinModeling leakage current of ceramic insulators subject to high pollution levels for improving maintenance activities author indexsubject indexarticles search
Home Pagealphabetic serial listing  

Services on Demand

Journal

Article

Indicators

Related links

  • On index processCited by Google
  • Have no similar articlesSimilars in SciELO
  • On index processSimilars in Google

Share


DYNA

Print version ISSN 0012-7353

Dyna rev.fac.nac.minas vol.85 no.204 Medellín Jan./Mar. 2018

https://doi.org/10.15446/dyna.v85n204.63712 

Artículos

Methodology to support decision-making in prioritization improvement plans aimed at agricultural sector: Case study

Metodología para soportar el proceso de toma de decisiones en la priorización de planes de mejora en el sector agrícola: Caso de estudio

Nelson Javier Tovar-Perillaa  b 

Helga Patricia Bermeo-Andradeb 

José Fidel Torres-Delgadoa 

Miguel Ignacio Gómezc 

a Departamento de Ingeniería Industrial, Facultad de Ingeniería, Universidad de los Andes, Bogotá, Colombia. nj.tovar10@uniandes.edu.co, ftorres@uniandes.edu.co

b Facultad de Ingeniería, Programa de Ingeniería Industrial, Universidad de Ibagué, Ibagué, Colombia. nelson.tovar@unibague.edu.co, helga.bermeo@unibague.edu.co

c Charles H. Dyson School of Applied Economics and Management, Cornell University, Ithaca, EEUU. mig7@cornell.edu


Abstract

Developing countries and those with agricultural tradition have, among their government priorities, the design and implementation of improvement plans to increase productivity in this sector. Prioritization of those plans tends to be based on assessment of production indicators, leaving aside key logistic aspects such as transportation, handling, packing among others. Due to this reason, this work proposes a multi-criteria methodology, based on experts’ method and planning method of technological development in agro-industrial chains proposed by ISNAR, which estimate logistic potential index (LPi) and level of competitiveness index (LCi). Joint analysis of both indicators allowed to prioritize products in an array called the prioritization matrix. Methodology was validated in a case study through prioritizing horticultural and fruit products in five zones of Tolima - Colombia to allocate resources in order to implement logistics strategies.

Keywords: multi-criteria methodology; agricultural sector; product selection

Resumen

Los países en desarrollo y aquellos con tradición agrícola tienen entre sus prioridades gubernamentales el diseño e implementación de planes de mejora para aumentar la productividad en este sector. La priorización de esos planes tiende a basarse en la evaluación de indicadores de producción, dejando de lado aspectos logísticos clave como transporte, manipulación, embalaje, entre otros. Por esta razón, este trabajo propone una metodología multicriterio, basada en el método de expertos y el método de planificación del desarrollo tecnológico en cadenas agroindustriales propuesto por ISNAR, que estiman el índice de potencial logístico (LPi) y el índice de nivel de competitividad (LCi). El análisis conjunto de ambos indicadores permitió priorizar los productos en una matriz denominada matriz de priorización. La metodología fue validada en un caso de estudio a través de la priorización de productos hortícolas y frutales en cinco zonas del Tolima - Colombia para asignar recursos con el fin de implementar estrategias logísticas.

Palabras clave: metodología multicriterio; sector agrícola; selección de productos

1. Introduction

Direct contributions from agricultural and livestock sectors (crops, cattle raising, forestry, and fishing) in the development of the economy are reflected by their participation in the total GDP, their monetary earnings, and their important role in the use of workforce [1-3]. Moreover, agriculture represents a significant fraction of the economic activity in the developed world, with 25% of the added value coming from this sector [3,4]. Thereby, it seems reasonable that growth of agricultural productivity and management of food systems have significant effects upon economic variables [5] and on the life quality of the people [6,7].

Agricultural sector continues to play a fundamental role for development, especially in low-income countries, where this sector bears relevance, both in terms of added income as in the workforce in rural zones [8]. Particularly, the horticultural and fruit sector has been the food sector with the greatest growth in the world, evidencing the need to expand and identify adequate technological solutions, innovate in market agreements, link small farmers with the market to ensure efficient supply systems [9].

The importance of agriculture in the economic development of countries shown in the 2008 report on global development: Agriculture for Development [4] and Agriculture at the Crossroads [10] has, to a large extent, renovated interests for issues of the sector.

Although the agricultural economy has a proud tradition of developing practical tools that can quantify earnings and losses due to changes in policies or programs, as stated by [11]. It is evidenced that the formation of associations for the development of agricultural innovation in Latin America is often achieved without clear perceptions of the costs involved in the benefits that will be obtained. As a result, decision-making to prioritize resources and products becomes a challenge for local governments within the agricultural sector.

It is well-known that applying multi-criteria and hierarchical analysis techniques have become into useful tools for the decision-making process in any setting [12,13]. Globally, multi-criteria analysis techniques within the agricultural sector have focused on the analysis of risk aversion among producers, productivity improvement, decision-making, and the implications in water management in agricultural irrigation systems [14-17].

Multiple attribute assessment, combined with the analytical hierarchical process (AHP) have been used to evaluate optimal locations of new agricultural food warehouses, selection and adoption of products to cultivate, land preservation, and management of wetlands, among others [18-21]. On the other hand, in Colombia, this type of work has been developed to identify governmental difficulties for economic development, to evaluate of environmental impact, to locate of facilities, and to select of power generation systems to improve life quality of life in rural zones [22-25].

Regarding hierarchy products, several matrix models exist [26-31] that allow to classify them according to a set of criteria to establish priorities in the distribution of resources. In Latin America, countries, such as Argentina, Brazil, Mexico, Colombia, Venezuela, and Chile have conducted research aimed at characterizing the forest and agro-industrial subsectors to help decision-makers on how to direct financial resources to increase productivity. These studies have been based on two factors: socioeconomic importance and competitiveness, recommended by the method from the International Service for National Agricultural Research (ISNAR) and adapted to the specific conditions of each region [32-35]. However, as it relates to the ranking of agricultural products, the aforementioned studies have not considered the feasibility of the product for its national and international commercialization, the ease of distribution, and the feasibility of industrialization; variables that are not directly linked to productivity, which are fundamental to increase the competitiveness of the chain.

In recent years in Colombia, a fund for science and technology has been implemented with resources coming from the exploitation of natural resources (royalties). This fund seeks to fund projects in science, technology, and innovation (ST+i) aimed to applied research programs and programmed to guarantee an impact upon the production sector. Given the need to develop strategies that allow to improve the agricultural sector in the state Tolima, Colombia [36,37], the state government has approved a project to design and implement a logistics model, as the basis for the integration of value on the horticultural and fruit chains. During the first phase of the project, the researchers are faced with the decision to determine which horticultural and fruit chains need to be intervened, so that logistics strategies can be implemented. The aim of this paper is to propose a methodology based on multi-criteria techniques for decision- making, bearing in mind quantitative and qualitative criteria that allow to prioritize the agricultural products.

2. Prioritization methodology

The principal methodological aspects considered during this first phase of the Project are simplified in the following four steps:

Step 1. Selection of zones and products to evaluate by zone. To select the zones in the region, the region’s geographic distribution must be considered, along with its agricultural tradition and presence of the crops object of study. Also, to select the agricultural products to prioritize it is necessary to review reports on statistical production to establish the region’s most representative products.

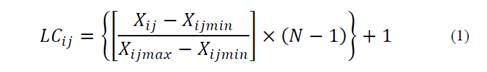
Step 2. Quantitative analysis. After preselecting the products (variable i) from each zone, it must be establish the quantitative criteria (variable j) to be analyzed in each product according to the Planning method of technological development in agro-industrial chains from ISNAR [34]. Thereafter, information is gathered on the criteria in each zone and per product (Xij). Upon obtaining the information, it is normalized and the level of competitiveness index (LCi) is calculated per product, which is within a range from 1 to N (N = Number of products to prioritize). To calculate the LCi, eq. (1)-(2) were used:

Step 3. Qualitative analysis. This analysis applies the DELPHI method [38], which suggests gathering a number (variable k) of no less than 10 experts on the topic of analysis, who according to their knowledge and expertise will score the logistic potential of the products (variable i) preselected from each zone in the previous step, bearing in mind the viability of each product for its national and international commercialization, ease of transportation and handling, possibility to obtain derived products, and its feasibility for industrialization. Additionally, this index is evaluated within a range from (1) to (N), with (N) being the best score, with the excluding valuation restriction (without repetitions). With the assessments obtained in each round of the method of experts, a descriptive statistical analysis must be performed to evaluate the experts’ consensus from the calculation of Kendall’s level of concordance (W) [39,40]. It is necessary to validate the level of concordance by applying the chi-squared (χ2) test at a 95% confidence interval (α=5%) from the evaluation of the following hypotheses:

Ho: W=0; no concordance exists in responses of experts

Ho: W>0; concordance exists in responses of experts

In case of not reaching a concordance level above 0.70 with the experts, a new valuation round must be carried out. Evaluators must are given the statistical results from the previous round. It is convenient to perform no more than three rounds per zone. If the concordance coefficient calculated during the third round is below the minimum recommended (W < 0.70), an alternative would be to perform the cluster analysis by grouping the responses via hierarchical clustering to identify atypical data. Furthermore, recognize the experts that converge in their scores. The logistic potential index (LPi) of each product is calculated based on the scores by the experts. To calculate the LPi, eq. (3) was used:

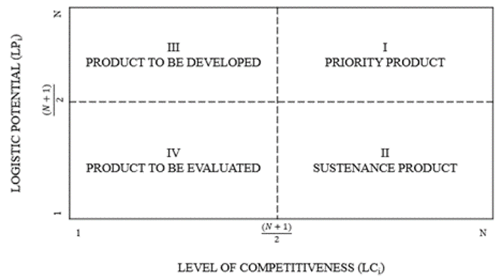
Step 4. Prioritizing of products. In order to prioritize the products, data on the indices calculated (LCi) and (LPi) must be consolidated in the prioritization matrix and then these results are mapped on an XY plane (1≤X≤N; 1≤Y≤N). The graphic must be included as a third variable of annual production analysis of each product, represented by the diameter of the bubble from the figure. To facilitate interpretation of the graphic, the prioritizing matrix is divided into four quadrants limited by the mean values of each indicator, as shown in Fig. 1.

Source: The authors

Figure 1 Product prioritization matrix 

3. Results

3.1. Selection of zones and products to evaluate per zone

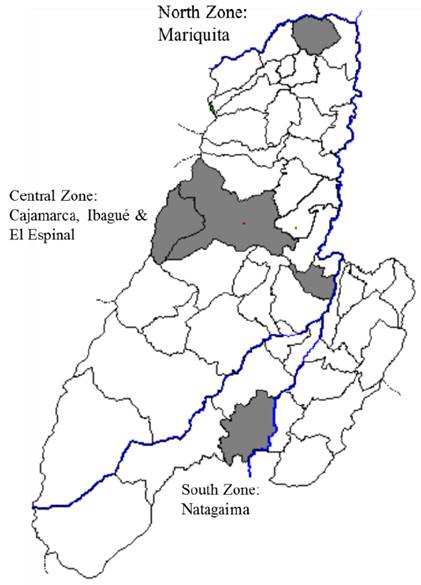
The zones (epicenters) selected to carry out the work are geographically distributed throughout the state of Tolima. It is recognized for their agricultural tradition and its large areas cultivated with fruits and vegetables. Fig. 2 shows the distribution of the zones selected within the State.

Source: The authors

Figure 2 Epicenters of zones selected to apply the methodology 

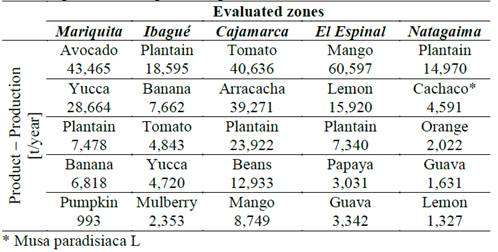
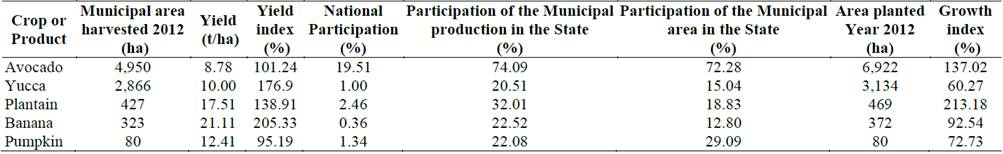
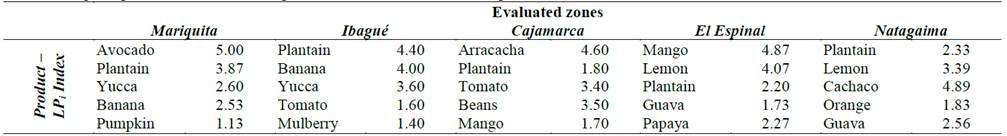
After reviewing the statistical figures for the State in the horticultural and fruit sector available from the State Secretary of Agriculture [41-44], five products were preselected with the highest production in each of the zones selected. Results of the pre-selection are shown in Table 1.

Table 1 Products preselected to prioritize per zone evaluated 

Source: Corporación Colombiana Internacional (CCI) - national agricultural base 2007-2012

3.2. Quantitative analysis

Taking as base the variables established within the agricultural and livestock research policies developed by ISNAR [34], the following criteria are shown in Table 2

Table 2 Criteria to evaluate per product preselected 

Source: The authors based ISNAR [34]

Information from each of the criteria was collected per product and zone, thus, obtaining the necessary information to calculate the product’s competitiveness index LCi (eq. 1). Table 3 shows, as an example, the information obtained through criterion for each product in the Mariquita zone. Table 4 shows the competitiveness indices obtained for each product in each of the five zones analyzed. It can be noted that LCi is not directly related to annual production values (Table 1).

Table 3 Information of the quantitative criteria evaluated for the Mariquita zone 

Source: Corporación Colombiana Internacional (CCI) - national agricultural base 2007-2012

Table 4 Values of competitiveness indices of each product evaluated in each of the epicenters selected 

Source: The authors

3.3. Qualitative analysis

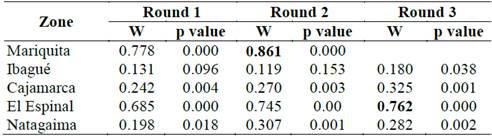
After applying the DELPHI method with the participation of 15 experts, Table 5 shows Kendall’s level of concordance obtained in the responses from experts, the p value for the chi squared test, and the number of rounds conducted in each of evaluated zones.

Table 5 Values for Kendall’s coefficient in each of the rounds conducted per evaluated zone 

Source: The authors

According to the methodology proposed, in zones where the minimum desired level of concordance was not achieved, Ibagué, Cajamarca, and Natagaima, cluster analysis was performed [45] grouping by conglomerate the responses by the experts on the third round and discarding atypical valuations. Fig. 3 shows, as an example, the dendogram carried out through hierarchical cluster analysis in Ibagué zone.

Source: The authors

Figure 3 Dendogram per cluster analysis - Ibagué zone 

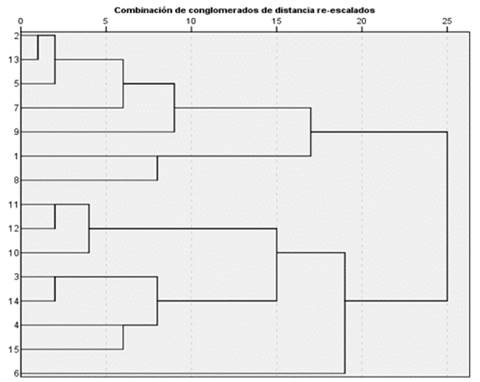
With results from the hierarchical classifications, the number of expert responses was determined to analyze the third round. With the number of adjusted valuations, Kendall’s concordance coefficient was again calculated (Table 6).

Table 6 Values for Kendall’s coefficient after the cluster analysis 

Source: The authors

For the Cajamarca and Natagaima zones, it was decided to work with a concordance coefficient below the recommended value (0.75), given that the values obtained gathered the responses of a significant number of experts and these were significantly higher than those obtained during the third round.

Upon defining the concordance levels and the number of experts (K) in each zone, LPi was calculated through eq. 2. Results are shown in Table 7.

Table 7 Values of logistic potential indices of each product evaluated in each of the epicenters selected 

Source: The authors

It can be noted that in most of the zones the product with the highest logistic potential index is directly related to the product with the highest production volume. However, this behavior is not noted in the Natagaima zone, which is partly explained because the Cachaco leaf has commercial potential as wrapping material for typical foods [46,47], which is not reflected in the results of production volumes (Table 1).

3.4. Prioritizing of products

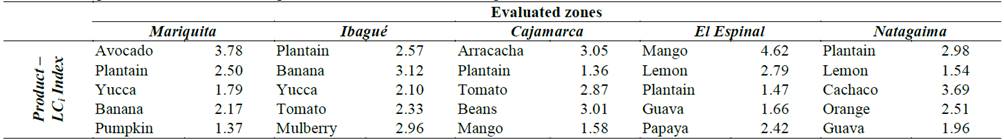
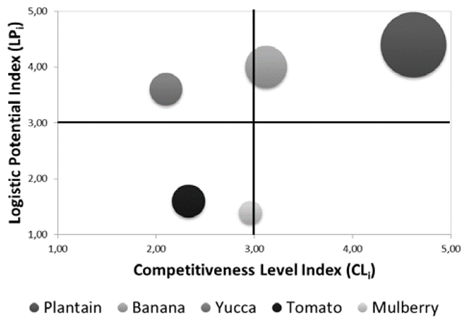
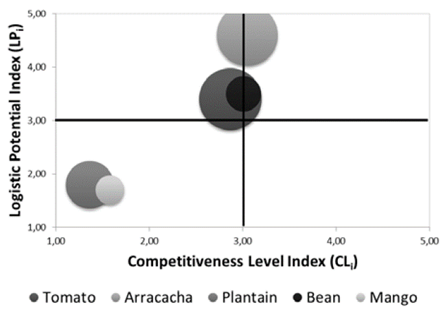
The results obtained for the competitiveness level index (LCi) and logistic potential index (LPi) for each of the horticultural and fruit products from the five zones studied were located on the product prioritizing matrix. The results obtained in each of the zones are shown in Fig. 4-8.

Source: The authors

Figure 4 Product prioritizing matrix in Mariquita zone 

Source: The authors

Figure 5 Product prioritizing matrix in Ibagué zone 

Source: The authors

Figure 6 Product prioritizing matrix in Cajamarca zone 

Source: The authors

Figure 7 Product prioritizing matrix in El Espinal zone 

Source: The authors

Figure 8 Product prioritizing matrix in Natagaima zone 

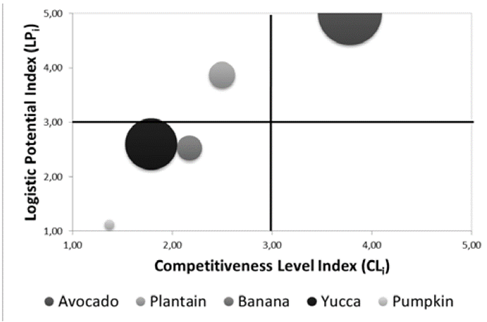
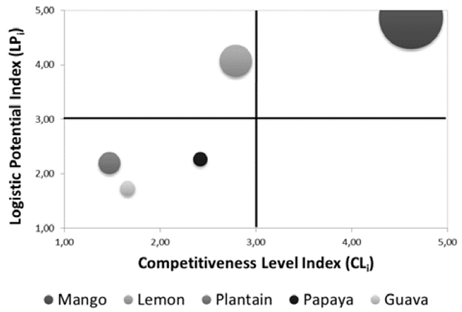
According to Figs. 4-5, in the Mariquita and El Espinal zones, the indicators of the level of competitiveness and logistic potential show a direct relationship, clearly evidencing the priority products in the zone. This behavior is related to the results found through the method of experts, which yielded high concordance coefficients as the first rounds, and its final value was above the accepted minimum. Additionally, it can be seen that in the Mariquita zone, yucca in spite of having the second production volume, was placed in the quadrant of products with low competitiveness level and low logistic potential (products to be evaluated).

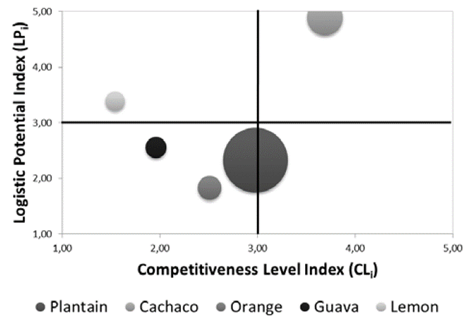
Also, the Ibagué, Natagaima, and Cajamarca zones do not show a defined tendency in the prioritizing matrix; this behavior agrees with that reflected in the results of the method of experts. The prioritizing matrix in the Ibagué zone placed plantains in the quadrant of products to be developed, suggesting their selection for productivity improvement programs of this chain. It is also important to highlight that in the Ibagué and Cajamarca zones, no product was found clearly placed in the first quadrant (priority products); this was due in part to the lack of products with outstanding competitive levels (LCi) in these zones.

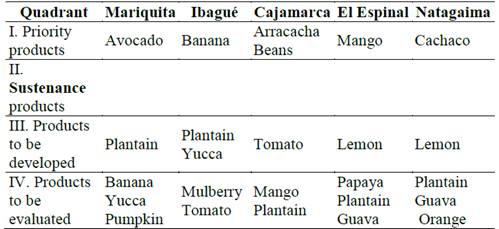
Table 8 summarizes the prioritizing of products and the location of the quadrant within the prioritizing matrix per zone

Table 8 Location of products within the prioritizing matrix per evaluated zone 

Source: The authors

4. Conclusions

The proposed methodology allows to prioritize products and serves as support in decision-making processes to implement logistic development plans in the agricultural sector. By dividing the prioritizing matrix into four quadrants, it allows to classify the production chains in the study zone, placing them into four categories defined as: ‘Priority, ‘To be developed’, ‘Sustenance’ and ‘To be evaluated’, classification that allows to define the importance of the chain in evaluated zone.

Also, the methodology proposed establishes the concept and opinion of experts from the sector, as well as indices of agricultural production of the products, combining quantitative and qualitative criteria, which leads to a broader and more reliable analysis for the decision-making process and allocation of resources.

For the conducted case study, no products were found in the sustenance quadrant; this may be because most of the products analyzed have a competitiveness level below the mean and those products above this level have high logistic potential, placing them in priority products. Additionally, in zones where the Kendall concordance coefficient yielded high values as of the first rounds, the values of the indices of competitiveness and logistic potential show direct relation. Lastly, it is worth highlighting that although some products have a significant production level, after applying the prioritizing methodology these were placed in the lowest quadrant (products to evaluate), which indicates that a high production volume does not ensure a relevant position in logistic and competitive terms (priority products).

Acknowledgments

The authors wish to thank the Government of Tolima and the General Royalty System’s Fund for Science, Technology, and Innovation for the financial support received under project: "Design and implementation of a logistics model as base of the integration of value of the horticultural and fruit chain in Tolima" through Special Cooperation Agreement N° 1032, 08 November 2013, ratified between Universidad de Ibagué and the Government of Tolima. Gratitude is also expressed to the Master’s fellows who contributed to the consultation of information and preparation of data within the framework of this project.

References

[1] Johnston, B. and Mellor, J., The role of agriculture in economic development. American Economic Review [Online]. 51(4), 1961. [date of reference Jan 15 of 2015]. Avalaible at Avalaible at https://www.jstor.org/stable/pdf/1812786.pdf?refreqid=excelsior%3A5084710c74cbac840ec7dff452730866 . [ Links ]

[2] Renza, J., Millán, N., Mora, M., Cifuentes, M., Osorio, J., Frasser, C. and Ramírez, D., Análisis de la estructura económica del Tolima y del mercado laboral en Ibagué (2005-2011). Colombia, Red de Observatorios Regionales del Mercado de Trabajo, Universidad del Tolima, 2011, 85P. [ Links ]

[3] The World Bank. Agriculture, value added (% of GDP) [en línea], Washintong DC, 2015 [Consulta: 1/15 enero 2015]. Avalaible at: Avalaible at: http://data.worldbank.org/indicator/NV.AGR.TOTL.ZSLinks ]

[4] The International Bank for Reconstruction and Development / The World Bank, World development report 2008: Agriculture for development, The World Bank, Washington DC, 2007. [ Links ]

[5] Gollin, D., Agricultural productivity and economic growth, in: Arrow, K.J. and Intriligator, M.D., Handbook of Agricultural Economics, Vol 1., Netherlands, Elsevier, 2010. pp. 3825-3866. [ Links ]

[6] Gómez, M.I., Barrett, C., Raney, T., Pinstrup-Andersen, P., Meerman, J., Croppenstedt, A., Carisma, B. and Thompson, B., Post-green revolution food systems and the triple burden of malnutrition. Food Policy, 42, pp. 129-138, 2013. DOI: 10.1016/j.foodpol.2013.06.009 [ Links ]

[7] Gómez, M.I. and Ricketts, K.D., Food value chain transformations in developing countries: Selected hypotheses on nutritional implications. Food Policy, 42, pp. 139-150, 2013. DOI: 10.1016/j.foodpol.2013.06.010. [ Links ]

[8] Dethier, J. and Effenberger, A. Agriculture and development: A brief review of the literature. Economic Systems, 36 (2), pp. 175-205, 2012. DOI: 10.1016/j.ecosys.2011.09.003 [ Links ]

[9] Mubarik, A. Horticulture revolution for the poor: Nature, Challenges and Opportunities, International Assessment for Agriculture Science and Technology (IAAST), Tainan, 2006, 43 P. [ Links ]

[10] McIntyre, B. D., Herren, H., Wakhungu, J., and Watson, R. T. Agriculture at a Croossroads, Washington DC, International assessment of agricultural knowledge, science and technology for development (IAASTD), 2009, 577 P. [ Links ]

[11] Hartwich, F. and Tola, J. Public-private partnerships for agricultural innovation: Concepts and experiences from 124 cases in Latin America. International Journal of Agricultural Resources, Governance and Ecology, 6(2), pp. 240-255, 2007. DOI: 10.1504/IJARGE.2007.012706. [ Links ]

[12] Walleniuns, J., Dyer, J., Fishburn, P., Zionts, S. and Deb, K. Multiple Criteria Decision Making, Multiattribute Utility Theory: Recent Accomplishments and What Lies Ahead. Management Science [Online], 54(7), 2008. [date of reference October 7th of 2015]. Available at: Available at: https://www.jstor.org/stable/pdf/20122479.pdf?refreqid=excelsior%3A14ff8ecd06afb1442dc1797336f5bda3 . [ Links ]

[13] Turkis, Z. and Zavadskas, E. Multiple Criteria Decision Making (MCDM) Methods in Economics: An Overview. Technological and Economic Development of Economy, 17(2), pp. 397-427, 2011. DOI: 10.3846/20294913.2011.593291 [ Links ]

[14] Gomez-Limon, J.A. and Berbel, J., Multicriteria analysis of derived water demand functions: a Spanish case study. Agricultural Systems, 63(1), pp. 49-72, 2000. DOI: 10.1016/S0308-521X(99)00075-X [ Links ]

[15] Gomez-Limon, J.A, Arriaza, M. and Riesgo, L., An MCDM analysis of agricultural risk aversion. European Journal of Operational Research, 151(3), pp. 569-585, 2003. DOI: 10.1016/S0377-2217(02)00625-2 [ Links ]

[16] Riesgo, L. and Gómez-Limón, J.A., Multi-criteria policy scenario analysis for public regulation of irrigated agriculture. Agricultural Systems , 91(1-2), pp. 1-28, 2006. DOI: 10.1016/j.agsy.2006.01.005 [ Links ]

[17] Zardari, N., Cordery, I. and Sharma, A., An objective multiattribute analysis Approach for allocation of scarce irrigation water resources. Journal of the American Water Resources Association (JAWRA), 46(2), pp. 412-428, 2010. DOI: 10.1111/j.1752-1688.2009.00410.x [ Links ]

[18] Duke, J. and Aull-Hyde, R., Identifying public preferences for land preservation using the analytic hierarchy process. Ecological Economics, 42(1-2), pp. 131-145, 2002. DOI: 10.1016/S0921-8009(02)00053-8 [ Links ]

[19] Herath, G., Incorporating community objectives in improved wetland management: The use of the analytic hierarchy process. Journal of Environmental Management, 70(3), pp. 263-273, 2004. DOI: 10.1016/j.jenvman.2003.12.011 [ Links ]

[20] García, J.L., Alvarado, A., Blanco, J., Jiménez, E., Maldonado, A.A. and Cortés, G., Multi-attribute evaluation and selection of sites for agricultural product warehouses based on an Analytic Hierarchy Process. Computers and Electronics in Agriculture, 100, pp. 60-69, 2014. DOI: 10.1016/j.compag.2013.10.009 [ Links ]

[21] Reed, B., Chan-Halbrendt, C., Tamang, B.B., Chaudhary, N., Analysis of conservation agriculture preferences for researchers, extension agents, and tribal farmers in Nepal using Analytic Hierarchy Process, Agricultural Systems , 127, pp. 90-96, 2014. DOI: 10.1016/j.agsy.2014.01.007 [ Links ]

[22] Cherni, J.A., Dyner, I., Henao, F., Jaramillo, P., Smith, R. and Font, R.O. Energy supply for sustainable rural livelihoods. A multi-criteria decision-support system. Energy Policy, 35(3), pp. 1493-1504, 2007. DOI: 10.1016/j.enpol.2006.03.026 [ Links ]

[23] Henao, F., Cherni, J., Jaramillo, P., Dyner, I., A multicriteria approach to sustainable energy supply for the rural poor. European Journal of Operational Research , 218(3), pp. 801-809, 2012. DOI: 10.1016/j.ejor.2011.11.033 [ Links ]

[24] Toro, J., Requena, I., Duarte, O. and Zamorano, M., A qualitative method proposal to improve environmental impact assessment. Environmental Impact Assessment Review, 43, pp. 9-20, 2013. DOI: 10.1016/j.eiar.2013.04.004 [ Links ]

[25] Duarte, A.E., Sarache, W.A. and Matallana, L.G., Incident factors in facility location: An application in the Colombian biofuel sector. Ingeniería e investigación [Online]. 33(3), 2013. [date of reference November 2015]. Avalaible at: Avalaible at: http://www.scielo.org.co/pdf/iei/v33n3/v33n3a13.pdfLinks ]

[26] Robinson, S.J.Q., Hichens, R.E. and Wade, D.P., The directional policy matrix - tool for strategic planning. Longe Range Planning, 2(3), pp. 8-15, 1978. DOI: 10.1016/0024-6301(78)90045-6 [ Links ]

[27] Kraljic, P., Purchasing must become supply management. Harvard Business Review [Online], pp. 1-13, 1983. [date of reference November 2015]. Avalaible at: Avalaible at: https://hbr.org/1983/09/purchasing-must-become-supply-managementLinks ]

[28] McKinsey & Company., Enduring Ideas: The GE-McKinsey nine-box matrix. McKinsey & Company, [Online], 2008 [date of reference January 10 of 2015]. Available at: Available at: http://www.mckinsey.com/insights/strategy/enduring_ideas_the_ge_and_mckinsey_nine-box_matrixLinks ]

[29] Udo-Imeh, P.T., Edet, W.E. and Anani, R.B., Portfolio analysis models: A review. European Journal of Business and Management, [Online], 4(18), 2012. [date of reference November 2015]. Avalaible at: Avalaible at: http://iiste.org/Journals/index.php/EJBM/search/advancedResultsLinks ]

[30] Team FME. Ansoff Matrix: Strategy skills [Online], Free Management eBooks, [date of reference October of 2015]. Available at: Available at: http://www.free-management-ebooks.com/dldebk-pdf/fme-ansoff-matrix.pdfLinks ]

[31] Michalopoulos, T., Hogeveen, H., Heuvelink, E. and Oude-Lansink, A., Public multi-criteria assessment for societal concerns and gradual labeling. Food Policy , 40, pp. 97-108, 2013. DOI: 10.1016/j.foodpol.2012.12.010 [ Links ]

[32] Velásquez, F., Plaza, J., Gutiérrez, B., Pulido, J., Rodríguez, G., Romero, M. y Carranza, J., Método de planificación del desarrollo tecnológico en cadenas agroindustriales que integra principios de sostenibilidad y competitividad, Países Bajos, Servicio Internacional para la Investigación Agrícola Nacional (ISNAR), 1999. [ Links ]

[33] Rey, J., Trujillo, V., Sánchez, A., Mazzani, E., Carreño, F., Salazar, R. y González, J., Evaluación del contexto institucional para definir el rol de los INIAs en la investigación y gestión de los recursos naturales, Países Bajos, Servicio Internacional para la Investigación Agrícola Nacional (ISNAR), 1999. [ Links ]

[34] Lima, S., Gomes de Castro, A., Mengo, O., Medina, M., Maestrey, A., Trujillo, V. y Alfaro, O. La dimensión de entorno en la construcción de la sostenibilidad institucional, Costa Rica, Servicio Internacional para la Investigación Agrícola Nacional (ISNAR), 2001, 135 P. [ Links ]

[35] Moctezuma, G., Jolapa, J.L., Perez, M.M., Gonzalez, A., Moreno, F. and Perez, R., Hierarchization of forest chains in the face of the vulnerability to climate change in the state of Mexico. Revista Mexicana de Ciencias Forestales, [Online], 5(21), 2014. [date of reference September 2015]. Avalaible at: < Avalaible at: http://www.scielo.org.mx/scielo.php?script=sci_arttext&pid=S2007-11322014000100002&lng=es&nrm=iso >. [ Links ]

[36] Gobernación del Tolima, Plan de desarrollo 2012-2015: Unidos por la grandeza del Tolima, Ibagué, Tolima: Gobernación del Tolima, 2012. 396 P. [ Links ]

[37] Banco de la República - Colombia and Departamento Administrativo Nacional de Estadística (DANE). Informe de Coyuntura Económica Regional (ICER) 2012 -Departamento del Tolima. Bogotá, 2013. 100 P. [ Links ]

[38] Linstone, H. and Turoff, M., The Delphi method techniques and applications. United States: Addison-Wesley Educational Publishers Inc, 2002. [ Links ]

[39] Kendall, M., Rank correlation methods. New York: Hafner Publishing Co., 1955. [ Links ]

[40] Stuart, A., Rank correlation methods. By M.G. Kendall. British Journal of Statistical Psychology, 9(1), 68 P, 1956. DOI: 10.1111/j.2044-8317.1956.tb00172.x [ Links ]

[41] Departamento Administrativo Nacional de Estadística-DANE. Oferta agropecuaria: Cifras 2010, Bogotá, Ministerio de Agricultura y Desarrollo Rural - Colombia, 2010. [ Links ]

[42] Departamento Administrativo Nacional de Estadística-DANE. Metodología cuentas departamentales: Base 2005, Departamento Administrativo Nacional de Estadística, Bogotá, 2011. [ Links ]

[43] Gobernación del Tolima. Tolima en cifras 2011. Secretaría de Planeación y Tic - Dirección Gestión Pública Territorial, Ibagué, 2011. [ Links ]

[44] Corporación Colombiana Internacional, Base agrícola nacional 2007-2012, Corporación Colombiana Internacional, Bogotá, 2014. [ Links ]

[45] Romesburg, C., Cluster analysis for researchers, North Carolina: LULU PRESS, 2004. [ Links ]

[46] Echeverry-Navarro, E., Gomez-Caicedo, L.E. y Guzmán, J.A., Validación y ajuste de tecnología para el cultivo de plátano en el Tolima centro, Corporación Colombiana de Investigación Agropecuaria (CORPOICA), Bogotá, 1999. [ Links ]

[47] Echeverry-Navarro, E., Producción de hoja de plátano soasada con destino a la agroindustria de alimentos procesados. Infomusa, 10(1), pp. 9-12, 2011. [ Links ]

How to cite: Tovar-Perilla, N.J., Bermeo-Andrade, H.P., Torres-Delgado, J.F. and Gómez, M.I., Methodology to support decision-making in prioritization improvement plans aimed at agricultural sector: Case study. DYNA, 85(204), pp. 352-359, March, 2018.

Received: March 30, 2017; Revised: October 13, 2017; Accepted: February 15, 2018

Creative Commons License This is an open-access article distributed under the terms of the Creative Commons Attribution License