


 Inglês (pdf)
 Artigo em XML
 Referências do artigo
 Enviar este artigo por email
 Citado por SciELO
  Citado por Google
  Similares em
SciELO
Similares em
SciELO  Similares em Google
 Permalink
1. Introduction
Electrical insulators used in outdoor electrical substations are continually exposed to the environment and are subject to pollution coming from vehicle emissions, sea salt, dust, chemical compounds released from nearby industries, and other sources. Over time, layers of these pollutants can accumulate on the surfaces of electrical network components. As long as these layers are dry, this event will not bring further consequences to the insulation [1]. Nonetheless, high humidity exists due to mist or light rain, a conductive path is created on the dirty surface of the insulator, which decreases the dielectric properties and may cause network failures [2,3].
Power system reliability is continually affected by the pollution of insulators [3]. This kind of problem is one of the most common of the electrical network [4]; thus, several solutions should be considered in order to prevent blackouts. Some studies have focused mainly on preventing flashover due to pollution on the insulation of electrical networks [5-8].
The effects of washing electrical insulators have been studied previously [9-13]. The studies presented by [5,6,14] established that the best method for washing insulators, from a technical and economical point of view, is by using water under pressure. Furthermore, as a way to avoid failures on electrical substations near coastal areas, an automatic pressurized water system for the washing of polluted insulators has been proposed [7]. Moreover, other researchers have studied the effect of washing insulators with pressurized water on leakage current that flows on their surface, identifying that during the insulator cleaning, the leakage current increases up to peak values [8,15]. In [16], the authors studied the risk of failure of a high-voltage substation, considering the relation between climatic periods in tropical zones and the leakage current of electrical insulators. The authors identified that there is a higher probability of circuit failures when the leakage current increase occurs during the dry period from December to Mars. Furthermore, during wet seasons or rainy periods, electrical insulators are cleaned naturally, keeping the pollutant layer at a low level.
Previous research has proven helpful in decreasing the impact of pollution on electrical networks. Some of these studies have shown how the washings need to be done in order to mitigate the effects of environmental pollution on the electrical insulators’ performance. However, without practical support, it is not possible to determine an effective application for reducing the overall costs, predicting the pollution behavior, or identifying the risk of failure.
More studies related to leakage current are required to model the pollution of electrical insulators and the effects of different environmental variables. These models can be useful to identify how frequently washing must be done and how to predict high pollution levels that affect electrical insulation. All these issues must be solved in order to plan the maintenance of the insulators and improve the operation of distribution and transmission networks and electrical substations. With this sole purpose in mind, the main goal of this research is to obtain a model to identify the electrical insulators’ pollution process through the leakage current that flows over the surface of the insulators and its relation to environmental variables.
The rest of this paper is organized as follows: Section II includes materials and methods used in the research; Section III contains the theory and calculation; Section IV shows the results of the investigation; Section V shows the discussion; and Section VI contains the general conclusions of the research, including its implications for future studies.
2. Materials and methods
To obtain the model, the leakage current and weather variables were taken into account, considering their existing correlations [17]. The created model is based on simple regressions with the purpose of determining the optimal washing times for the electrical insulators of outdoor substations.
2.1. Case location
Fig. 1 shows the location of the Nueva Barranquilla substation in the city of Barranquilla, capital of the Atlántico Department, Colombia. This substation is located 7 km from the Caribbean Sea and 6 km from the Magdalena River. This location has atmospheric conditions with naturally high pollution levels and with a high concentration of sea salt. Moreover, because it is a seaport of first order, there is a high level of industrial activity and vehicular and maritime traffic. All these factors enhance the creation of pollutant particles in the air that affect the different components of the electrical network.

Previous studies have shown that the electrical substation is located in a high pollution zone, according to the scale established on the norm IEC 60071-2, with a salt deposit of 0.45 mg/cm2 [18]. The effect of pollution on the electrical insulators and their behavior during the non-washing days, as well as the effects of the rain, have been exposed in [19].
2.2. Data collection
To develop the models in time series and regressions, measurement of the leakage current on the insulators is required. Fig. 2 shows the connections for measuring variables and gathering data on a computer. The data were measured from March to April 2014, with a lapse of one minute, transmitted wirelessly, and stored in a data logger.
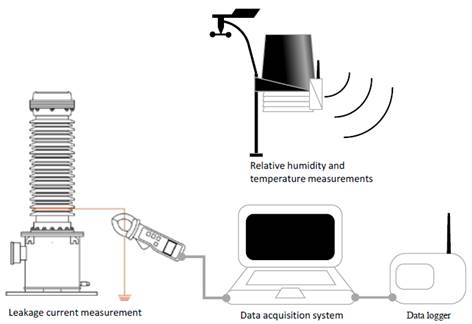
To measure the leakage current, a copper collar was used to surround a cross-sectional area of a 220 kV electrical insulator located inside the outdoor substation. The current inducted on the spire of the collar was measured through a milliamp clamp (ETCR brand model 6300), with a connection to a computer through an RS232 port. The resolution of the clamp was 0.001 mA, with a precision of ±1.5% and a measuring range from 0-60 A.
Relative humidity and temperature were measured by a Davis Instruments Vantage Pro2 Weather Station. This station has the capacity to measure solar radiation, relative humidity, room temperature, wind speed and direction, precipitation, and more.
3. Theory and calculation
3.1. Leakage current forecasting model
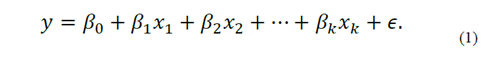
The leakage current forecasting model was created using regression techniques [20-22]. These types of regression models are useful to obtain a mathematical expression that that identifies the relationship between a dependent variable and one or more independent variables. The final model has the form presented in eq. (1). The y variable represents the dependent variable. “ x1 , x2 to xk ” represent the independent k variables. “ β0 , β1 to βk ” represent the partial regression coefficients, which are calculated by minimizing the square difference between the actual data and the forecasted data. Finally, the term ϵ represents the random error:
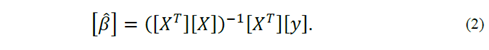
The estimated values of the regression coefficients are calculated as in eq. (2), where [ β ] is the matrix with the partial regression coefficients, [X] is the matrix with values of the independent k variables, and [y] is the matrix with the values of the dependent variables [23,24]:
4. Results
4.1. Leakage current behavior
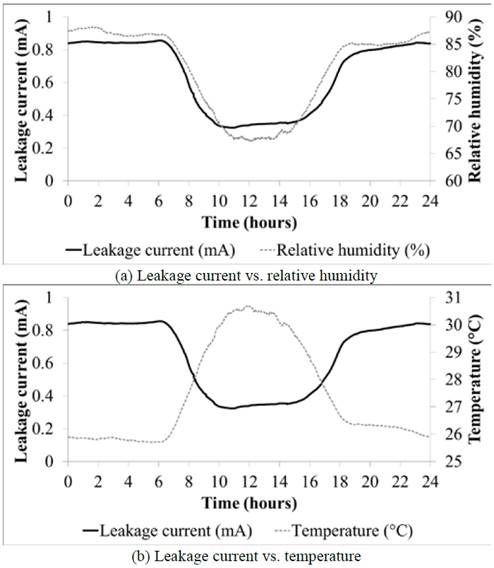
The leakage current has no constant magnitude during the day. Fig. 3 shows how the leakage current oscillates between high values during the day and night and low values near midday. Figs. 3a and 3b show the average magnitudes of the leakage current, the relative humidity, and the temperature measured in the electrical substation per hour.
Source: The authors
Figure 3 Daily behavior of the leakage current and its correlation to the weather.
During the morning hours (between 0000 and 0700 hours) and night hours (between 1800 and 2300 hours), the leakage current has average magnitudes of 0.840 and 0.800 mA, respectively. Conversely, near midday (between 0900 and 1600 hours), the leakage current drops drastically to an average magnitude of 0.351 mA. This particular behavior of the leakage current is tied to the weather conditions of the area where the electrical insulators have been established.
Fig. 3a shows a clear correspondence between the leakage current and relative humidity, which is supported with a high coefficient of correlation (ρ = 0.97). In contrast, Fig. 3b shows a high relation between the leakage current and temperature, but inversely proportional. The coefficient of correlation supports the statement, giving a value of −0.98. Several authors worldwide have investigated the high correlation between the magnitude of the leakage current and the weather [17, 25-30]. Once more, this relationship is confirmed.
4.2. Leakage current increasing trend
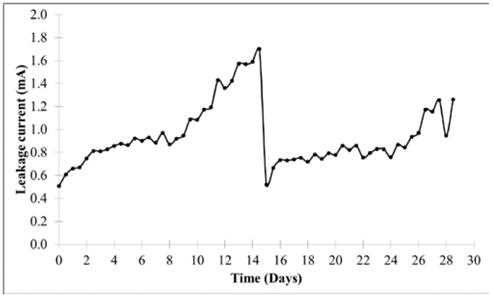
Fig. 4 shows the behavior of the leakage current during a month of continuous measuring, between March 18, 2014 and April 18, 2014.
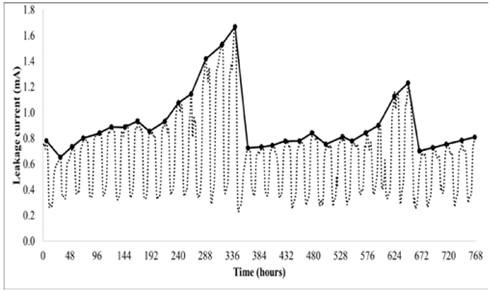
During the first day of measuring, the electrical insulators of the outdoor substation were washed and a small reduction (23%) was observed between the first and second critical peaks of the plot. For the next 14 days (hours 24 to 336) no washing was performed, although an interesting behavior can be appreciated. The leakage current progressively increased its value, which is expected as dirt gradually accumulated over the insulators’ surface. Despite all this, the leakage current during the morning and afternoon hours (valleys of the plot) always kept an average of 0.351 mA and a very low variability of 0.080 mA. This means that as the insulators became dirty over the days and, with the presence of high humidity values, the leakage current increased. In contrast, during the hours that the leakage current was at its maximum (morning and nighttime), the increase is marked and clearly not linear; for example, between days 11 and 14 (from hour 264 to hour 336) the current increased drastically.
On approximately the 347th hour (April 1, 2014), a new washing activity was performed on the electrical insulators. Unlike the first washing, this one is clearly marked by a 63% decrease of the leakage current magnitude. Comparing the results obtained from the first and second washings, we note that despite the percentage drop of the leakage current magnitude, the magnitudes are different in both cases, but the valley value oscillated around 0.3 mA and the peak value of the current around 0.65 mA. No matter how clean the insulator was before being washed, after the washing is done the magnitude does not drop from the previously described level.
The third washing activity is shown for hour 661, with a magnitude reduction of 45%. As with the previous washings, the peak value of the leakage current was 0.687 mA and the valley value was 0.265 mA, supporting the previously stated conclusion.
4.3. Leakage current model
Fig. 5 shows the maximum values of leakage current with data measured during the day and night for one month. The daytime period in the zone was defined from 0601 to 1800 hours. Meanwhile, the night hours were defined from 1801 to 0600 hours. The maximum value is set in each category and used for modeling of the leakage current. The model is developed with the first washing period (shown in Fig. 5) between days 0 and 14. Model validation is performed with the second washing period between days 15 and 29.
4.4. Model development
The proposed leakage current model is shown in Fig. 6. The graph defines the time from the first day after washing the insulators. This means that the day with the numerical value of zero will be the first day after washing the substation. Additionally, because we collected date twice daily (morning and evening), the time values equal to 0.0, 1.0, 2.0, etc. were considered to represent the maximum value of leakage current
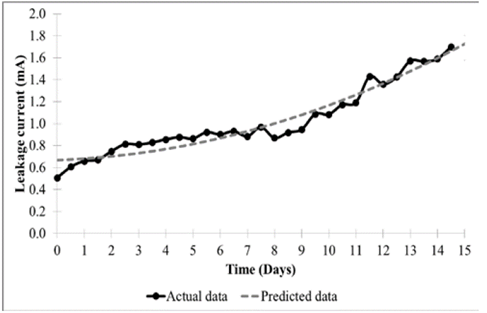
measured in the morning hours. Likewise, the time values equal to 0.5, 1.5, 2.5, etc. were considered to represent the maximum value of leakage current measured at night.
The parameters of the model gave as a result B 0 = 0.692 and B 2 = 0.005, being the linear component (B 1 ) less important. The mean absolute percentage error (MAPE) during the creation of the model was 6.14%, the standard deviation error (σ error ) was 0.078 mA, and the adjusted determination coefficient (R 2 ajust) was 93.8%.
4.5. Checking the model adequacy
Through statistical validation, we established the adequacy of the proposed model. The first test done was the signification of the regression. This procedure determines whether a linear relation exists between the response variable (leakage current) and the regression variables (time and time2) [23]. The appropriate assumptions are:
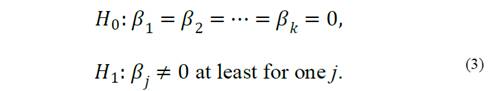
Rejecting H 0 eq. (3) implies that at least one of the regression variables is significant in the model. The P-value for this test was 1.113 x 10⁻¹⁸. Because it is much less than the alpha value used in the test (α = 0.05), the null hypothesis that all coefficients are zero is rejected and it concludes that at least one of the coefficients is nonzero. The second test, to identify which coefficient is zero, is individualized.
The second test performed is the Student’s t-test for individual regression coefficients. This test determines the value of each model regression. The test is performed for each regression coefficient model; for the case of the proposed model, the t-test for the coefficients B 0 and B 2 must be performed. Appropriate assumptions are:
The test returned P-values of 1.085 x 10⁻²³ and 1.113 x 10⁻¹⁸ for B 0 and B 2 , respectively. This result shows that both coefficients are statistically different from zero and valid for the model.
Finally, using the data measured from the second washing period and applying the Kruskal-Wallis test to verify whether there exists a statistically significant difference between the actual data and the forecasted data, the leakage current models were validated. The statistical test used in the Kruskal-Wallis test is shown in eq. (5):
where n i is the number of samples of level i-nth, N is the total number of samples, R i is the sum of the ranges of level i-nth, and S 2 is expressed in eq. (6):
The condition of rejecting the null hypothesis is achieved when the test statistic H is greater than the chi-square critical (𝐻> χ α, a−1 2 ) value or the P-value is less than the value of alpha (P-value < α). Validation of the model by forecasting the values of the second washing period resulted in a P-value of 0.570, which was higher than the alpha used in the test. Therefore, the null hypothesis is rejected and we can conclude that there are some significant differences between the actual and forecasted data.
4.6. Compliance with model assumptions
The analysis of variance is valid if and only if three assumptions are met in the residual: the normality assumption, the homoscedasticity assumption, and the independence assumption. Using the previous analysis, we can verify compliance with these three assumptions and obtain some valuable conclusions.
The normality assumption was verified by the chi-square test. The null hypothesis for this test says that the residual is distributed under a normal distribution and the alternative hypothesis is the negation of the null hypothesis. The P-value of normality test gave a value of 0.615. Because it is greater than the value of alpha used, there is insufficient evidence to reject the null hypothesis; therefore, it can be concluded that the residuals are distributed normally.
The homoscedasticity assumption was verified by the Levene test. Because the noncompliance of the assumption supposes an increase or decrease of the variance as the design factor grows in magnitude, for this test, a 30-sample residual data was divided into six groups, each with five data points. This was done to identify whether there was a growth or a significant decrease in the variance of residuals as perceived from one group to another. Therefore, the null hypothesis of this test indicates that the variances of the groups are equal to each other and the alternative hypothesis indicates that at least one of the variances of the groups is different from the rest. The P-value of the homoscedasticity test gave a value of 0.497. Because it is bigger than the value of alpha used, there is insufficient evidence to reject the null hypothesis; consequently, we can conclude that the residuals have constant variance.
The independence assumption was verified by the Durbin-Watson statistic. The null hypothesis for this test says that the residual values are independent and the alternative hypothesis is the negation of the null hypothesis. This analysis resulted in noncompliance of the assumption on all models, indicating an autocorrelation of the residual, which is common when data taken in time [31] are used. To meet this assumption, [32,33] suggest that the autocorrelation of the residual can be obtained by an autoregressive model of order 1 (AR(1)). The autoregressive model formulation is presented in eq. (7):

where εt is the error on time t, Φ is the correlation coefficient, εt-1 is the error on time t-1, and at is a random shock distributed normally with a mean of zero and variance σ2. The new adjustment in the models, adding the error model, slightly modifies the regression coefficients (B0, B1, and B2) of the model. Nonetheless, the validation test of the adequacy of the models is still valid. The readjustment of the model gives as results B0 = 0.688, B2 = 0.005, and Φ = 0.494.
4.7. Forecast limits: leakage current model
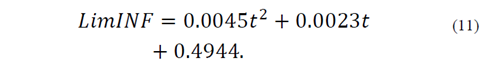
On the development of the model, the standard deviation error was 0.078 mA. This parameter is important to establish the limits in the future. The smaller the value of the standard deviation, the lower the forecast error would be, which constitutes a narrow range in which the real value of the leakage current can be established. These forecast limits can be calculated using the following equations:
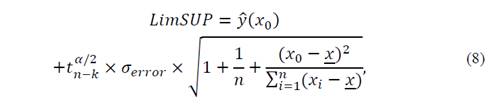
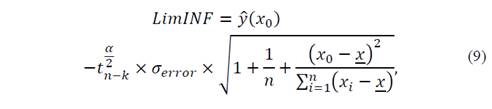
where 𝑦 𝑥 0 represents the forecast on the point x 0 , 𝑡 𝑛−𝑘 𝛼/2 is the value of the statistical Student’s t-test with a probability of α/2 and n-k degrees of freedom, α = 0.05, n is the number of data used to do the model, and k represents the number of independent variables, which for the particular case of the quadratic model is k = 1. Finally, 𝜎 𝑒𝑟𝑟𝑜𝑟 is the standard deviation of the residuals of the quadratic model. Two new expressions can be obtained as represented in eqs. (10) and (11):

5. Discussion
This research focused on the development of a leakage current model for forecasting and monitoring the accumulation of contaminants on the surfaces of ceramic electrical insulators used in high-voltage outdoor substations. The aim of this model is to determine the most appropriate days for washing the ceramic insulators of electrical substations.
The results of the investigation show that leakage current has a daily behavior that is governed by daily fluctuations in relative humidity. In the early hours of the morning and at night, humidity has a magnitude of about 87%; meanwhile, the late morning and afternoon humidity levels are around 62%. The leakage current, similar to the relative humidity, has high values early in the morning, at dawn, and at night and low values in the late morning and afternoon. The high correlation between the leakage current and relative humidity shows once again what has been studied by other authors such as [25,26,28-30,34], who verify the close relationship between these two variables.
Analyzing the measured leakage current, we observed a clear increase in magnitude that is due to the interaction between the relative humidity and pollution accumulation on the insulator surface after a few days. Although the leakage current increases, the current values in the final hours of the morning and afternoon remain approximately constant at a value close to 0.3 mA. Furthermore, as the insulators become dirty, the interaction with moisture causes the leakage current to increase. When the relative humidity increases, the leakage current is marked and clearly nonlinear.
The leakage current increases when the moisture content is high; therefore, it was possible to develop tendency models of the leakage current with the maximum values. We tested the adjustability of a quadratic regression model and demonstrated a low mean absolute error, a high coefficient of adjusted determination, and a low forecasting error in the validation process. The model presented in this paper fits in the nonlinear behavior of the increasing leakage current measured over different days.
6. Conclusion
The main objective of this work was to develop an electrical insulator leakage current model to detect and predict pollution levels on electrical insulators. This leakage current and environmental variables model was determined by quadratic regression functions. The model linked the behavior of the leakage current to different weather conditions in the area in which testing was done. This model can be used to predict the behavior of insulator pollution by continuously measuring environmental variables.
In future work, we will consider using forecasting models and assessment tools for characterizing insulator pollution and identifying the risks of failure. We will use the model for real-time monitoring to determine high risks of pollution during operation of the power grid. We expect to design a control system for electrical substations that will maintain the leakage current within acceptable values by using a water spray system.

