


 English (pdf)
 Article in xml format
 Article references
 Send this article by e-mail
 Cited by SciELO
  Cited by Google
  Similars in
SciELO
Similars in
SciELO  Similars in Google
 Permalink
1. Introduction
Product design is an iterative and complex decision-making engineering process. It starts identifying a necessity, applying a sequences of steps to provide an optimal solution to a particular problem, and that ends with a detailed description of the product.
In conceptual design, optimization techniques have been used to derive an optimal trade-off between conflicting objectives and criteria [1]. Thus the design goal can be expressed as an objective function. This objective function is a scalar for a single criterion optimization and a vector of functions for a multi-objective optimization. Some technique assume that the multiple responses are independent of each other while other techniques exploit the correlation in the responses for obtaining optimal design using statistics [2]. Many techniques have been proposed to solve optimization problems [3]. However, apart from these techniques, it is necessary to develop a robust design in order to optimize the reliability of the project.
A robust design is considered a design that works properly even when it is subjected to several variable manufacturing processes, variations in the environment, variability of the used materials, and by the behavior of the final user and by the characteristics of parts that have been provided by outside suppliers [4]. The impact of such factors has a direct effect on product quality. The first proposal of robust design can be traced to [5,6] when he presented the “Two-stage Design” method. This design method is based on two assumptions: firstly, a good design should be associated to variable settings that produce the best low variability of the response and secondly, it must be on the target value. Based on these assumptions, Taguchi introduced a univariate response using function of the product o process with emphasis on the two-step strategies. The Taguchi method consists of planned experiments, with the objective of acquiring data in a controlled way, executing these experiments and analyzing data, in order to obtain information about the behavior of the design process. Numerous studies[7-16] endorse Taguchi's method for the optimization of parameters for many applications such as erosion studies, thermal applications, process optimization, microstructures, etc. However, it is still to be developed in the field of structural mechanical components design.
It is estimated that about 80% of the engineering failures of structures are caused by fatigue [17]. Fatigue life varies due to random factors, load history and environment variables. Engineering structures fail when the service life of the structure is below than the expected design life. Therefore, robust optimization should be applied in structure design to minimize the sensitivity of service life caused by these factors. The development of modern computer technology has created favorable conditions, for robust design, giving the possibility to simulate many experiments, impacting in a spectacular way in the development cost (less parts for testing and iterative modifications looking for the acceptable specification).
Although the application of robust optimization to design purposes have been already applied in previous papers [17,18] the present paper combines a finite element method with a robust optimization of a parametrical model for geometrical design of a right angle bracket. Geometric optimization represents an effective tool that systematically pursue for an optimum design. This will help engineers to attain the optimal structure for the bracket. The effect on fatigue life due to accumulative damage was taken into consideration, and the applied methodology has allowed a robust design, aside from material selection, to optimize the design.
2. Geometric modeling
2.1. Model parametrization and materials
In this paper, the geometric design of a right angle bracket was selected due to its extensive use in the industry. Brackets are normally used to assemble different parts in a particular structure. A right angle bracket usually supports a weight in a right angle, in this context, if the weight is mounted over a structure subjected to vibrations, the bracket can fall by fatigue. The model geometry of a parametrized right angle bracket is shown in Fig. 1.
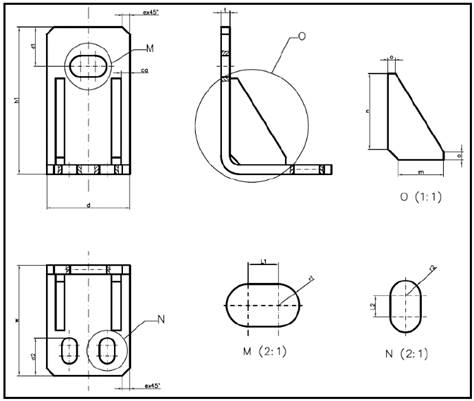
The parameters proposed are shown in Table 1 and they will be considered as the factors used in the Taguchi Method.
Table 1 Parameters used in the geometrical design of right angle bracket that have been used in Taguchi M. as control factors for the orthogonal internal array.
Source: The authors
In this paper, two different materials were used for the design optimization: carbon steel and Ti-6Al-4V. The use of two different materials is appropriate in order to obtain a design that must be independent from the used material and a way of achieving a robust design, the two different materials will allocated in an external array. Parameters determination for multiaxial fatigue is based on experimental curves of uniaxial cyclic test, for different values of the cycle asymmetry parameter R=σ_min/σ_max where σmin and σmax are the minimum and maximum stresses respectively in the cycle.
Carbon steel used in this study had a fatigue limit of 700 MPa in the case of R=-1 and a fatigue limit of 560 MPa in the case of R=0, both of them testing in torsion mode [19].
The smooth high cycle fatigue (HCF) life of the titanium alloy Ti-6Al-4V was predicted correctly by Findley parameter over a range of fatigue tests and stress ratio by Kallmeyer [20]. The fatigue data for Ti-6Al-4V in a torsion mode are a stress limit for R=0 and R=-1 of 350MPa and 450MPa, respectively.
Finite element simulations were performed with COMSOL Multiphysics® 3.5 solver and the software used for post processing was MATLAB®. Both programs can communicate with each other through a server-client connection. This allows MATLAB® to make use of COMSOL Multiphysics capabilities.
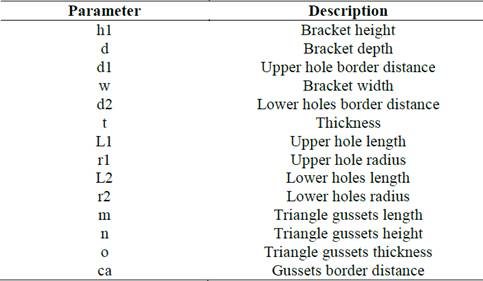
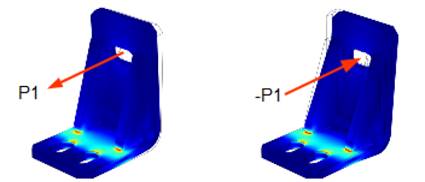
The model was subjected to a cyclic load that consists of a distributed load applied in the upper drill while the lower ones are fully constrained. Load was distributed on the inner face of the upper hole as shown in the Fig. 2. According to Fig. 2 the load is applied in the Y axis and it fully reversible.
3. Methods
3.1. Finite element method
Several multiaxial fatigue criteria have been considered based on previous papers [21-24] and results of simulated durability were compared with service data. This criterion in relation to the crack initiation phenomenon assumes that the fatigue failure of the material is due to some stress and strain components acting on the critical plane. Uniaxial tests are one of the tests used for experimental data that usually are parametrized with the stress amplitude (σa=(σmax-σmin)/2 ) and the stress range ( ∆σ=σmax-σmin.), and the results are described by Wöhler curves, which can analytically be represented by the Baskin relation, eq. 1.

where σlimit is the fatigue limit, σs is the fatigue strength coefficient, β is the fatigue strength exponent and N is the number of cycles before fracture.
In order to generalize the results obtained by uniaxial tests with Baskin, in relation with the case of multiaxial stresses the Findley model is used [24]. It consists on a “critical-plane” model defined in terms of maximum shear stress amplitude on a given plane and the maximum normal stress on that plane multiplied by an adjustable factor, k.
The critical plane method is based on experimental evidences that cracks usually initiate in preferential material planes associated with high shear stresses. The influence of mean normal stresses is also considered because these tensile stresses are expected to keep the crack faces opened, favoring the crack growth.
Findley’s critical-plane criterion has been commonly used to describe fatigue failure under multiaxial stress [25]. This criterion is exposed in Eq. 2.

where ∆τ(θ) is the shear stress amplitude on the θ plane and σmax is the maximum normal stress on that plane during a load cycle. The plane where this expression is maximized is considered to be the critical plane. Findley criterion has two independent material parameters fF and k, and it is assumed that they are constant over the considered life range. It is necessary to determine two fatigue limits with different loading conditions to obtain these data. In such a way, test with two different R values can be used to determine k and fF. In this case the fatigue limits according to the curves for R=-1 and R=0 has been used to obtain k according to eq. 3 [19]

Based on the results of earlier studies [19,20] the calculated parameters for carbon steel (fcrit =442.6 MPa and k=0.237) and Ti6Al4V (fcrit =294.3 k=0.271) were obtained.
The flow diagram in Fig. 3 describes the procedure used for fatigue assessment in the simulation.
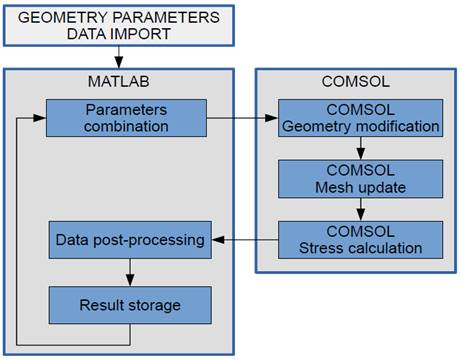
The different combinations of geometrical factors are specified through the parameters already defined in the Table 1. These combinations have to be imported in MATLAB® to further use. Computation of shear stress history is stored for each plane in every material mesh nodes. It is necessary the computation of shear stress vector history at each plane passing through a material point.
Fatigue failure assessment is carried out automatically by the communication from both sides. MATLAB® parses a combination to COMSOL® in order to modify the geometry of the model. A new mesh is then produced and the solver resolves for the load combination case. At this point, data sets which contains the stresses is exported to MATLAB® for continuing with the analysis.
Stress data sets from the simulation are used to assess the critical plane on every node of the mesh by performing a loop for a discrete number of planes. On each iteration a fF value is obtained for a plane which is defined by the angles with the Z axis (θ) and the X axis (∅) according to Fig. 4.
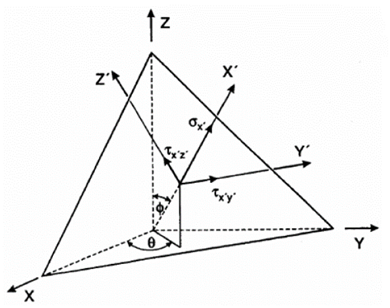
Stresses for the X’-Y’-Z’ coordinate system are computed and a fatigue failure result is produced for every plane. The critical plane is determined by the plane with the maximum fF value.
After calculation of the critical plane set of values, they are compared to the fatigue limit of the material obtained from the experiments. For this purpose a factor that relates these two values is defined as the fatigue usage factor (fus), eq. 4.

This expression implies that the nodes with a fus equal or greater than 1 are susceptible to fatigue failure.
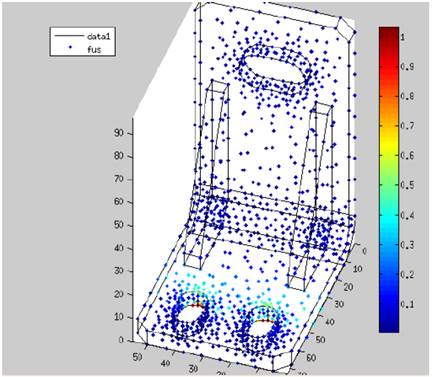
Fatigue usage factors are stored in a data set as a result of every iteration. This process is repeated for all parameters combination so that a set of fatigue results is produced (see Fig. 5).
3.2 Taguchi method
While the ideal univariate response is a minimal variation of the output variable being on-target to have a design that should be compensated between performance and variability. Taguchi uses an ideal function with two-step strategies [26]. This measure can be modeled as a transfer function of the fixed control variables (e.g. the geometry in this paper) and the random noise variables (e.g. the material in this paper) as shown in eq. 5

where M is the of signal factor vector that, in this research, has been the load applied to the right angle bracket, x=(x1,x2,x3,…) is the vector of control factors that are in this case the geometry parameters and N=(N1,N2,…) is the vector of noise factors, that in this paper represent two different materials, and f is the transfer function. The aim of the optimization design is to know a combination of control factors that minimize the influence of noise factors. Due to the material noise factors, the optimal bracket design only depends on the geometrical features.
Taguchi (Taguchi. 1987) introduces the concept of ideal function as a relationship that provides an output which is proportional to the input or signal. The linear nature of the relationship between the output response (fus) and the input signal factor (M) is adjusted to produce the desired output. It also combines the dynamic characteristics considering the different outputs which can be obtained by submitting the system to different input signals, on a progressive scale within logical range of functioning of this system. This allows, in a single design, to know the system role as a whole, facilitating future developments and thus innovation.
A dynamic characteristic study involves a two-step optimization procedure, in which initially the variation around a linear function is minimized, and secondly the sensitivity of the linear function is adjusted to an objective value by changing control factors levels, looking for the optimal combination.
Considering the dynamic relationships, the zero-point proportional equation provides a useful tool to adjust the output changing the input signal factor. This equation expresses a simple linear relationship between the response, Y , the signal factor, M, and the error, ε. This combination will be adjusted to have the appropriate slope of the linear function between the output response and the signal factor that can be adjusted (eq. 6)

where the control factors is i=1,2,… I , the signal factor is j=1,2,… J and the noise factor k=1,2. In this case when the load is zero (M=0) the output Y will be zero and bracket will not break by fatigue. As we are speaking about an ideal function the εijk has to be zero, and the ideal function of the brackets is expressed in eq. 7.

Where Yijk is the output, in this study the Fatigue Usage Factor -fus-, M is the signal that is the oscillatory load and β represents the slope of the function depending on the sensitivity of the system to the combination of controlling factors. In this case for every oscillatory load and every combination of geometrical parameters there is a directly related fus coefficient.
Changing the geometrical parameters (control factors) different results (fus) will be obtained for every load (M) and every noise factor (steel or titanium). The results can be analyzed with respect to the control factor like a Signal (S) Noise (N) ratio (η) as shown in eq. 8:
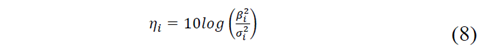
Where βi, (slope in Eq. 1) is determined by the least squares method and ( 𝑖 2 is the mean square error for the ith factor (Taguchi 1986) and is given by eq. 9:

The beta (βi) will be adjusted (optimized) to ensure that the fus coefficient does not exceed the maximum admitted value (if fus ≥1 the bracket will collapse).
Therefore, with a small amount of experiments these engineering optimization tools can provide compelling results employing some standard tables of experiments, called orthogonal arrays [27]. These orthogonal arrays provides specific arrangement of fractional experiments with regard to the influencing factor and their levels. In the Table 2 the factors and levels are listed for every factor that will be used in this paper. In the current work L36 (Table 3) orthogonal array was used, which implied carrying out 36 tests with 3 factor of 2 levels and 12 factors of 3 levels as listed in Table 2.
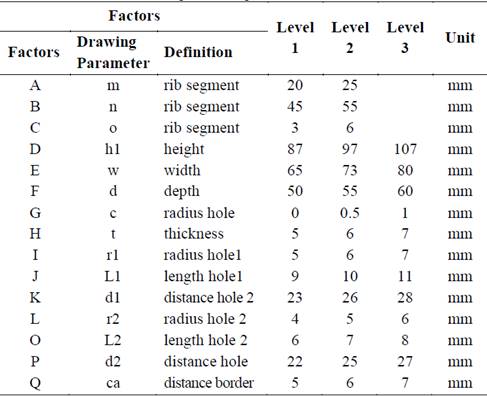
Table 3 Taguchi L36 Array to test 12 factors with 3 levels and 3 factors with 2 levels
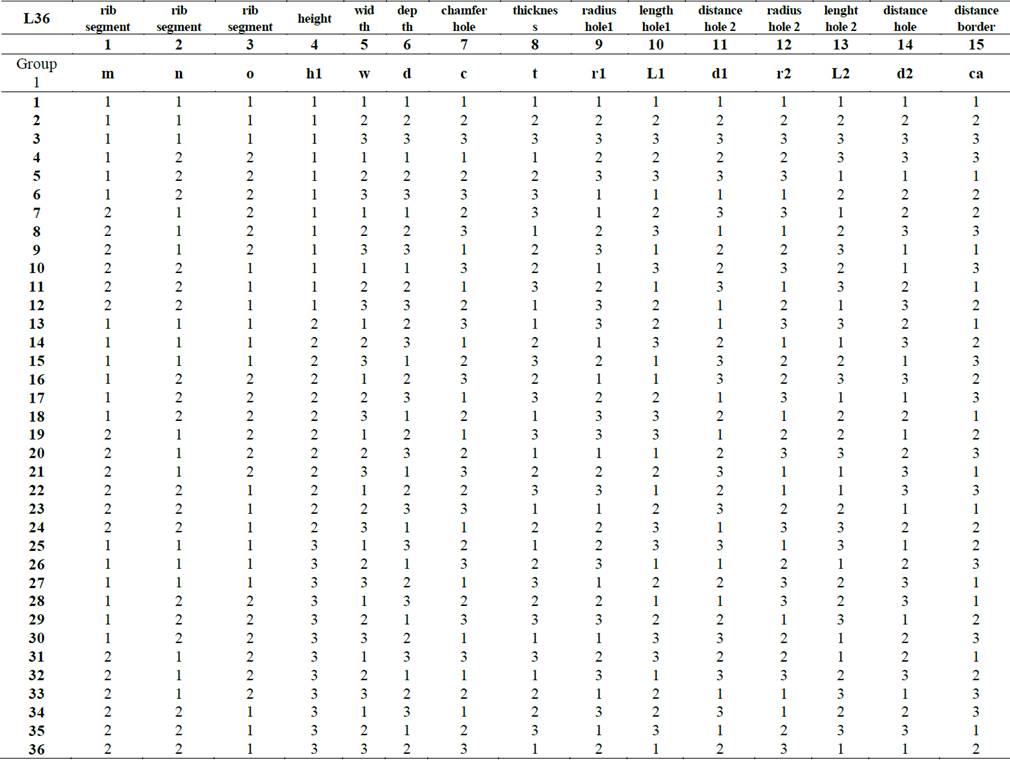
Source: The Authors.
Therefore, the present robust design case is defined as a dynamic characteristic arrangement and the main objective of the design activity is to optimize the S/N ratio defined in Eq. 8. In a parameter design experiment, the control factors are assigned to an inner array, while the signal factor and noise factors are configured in an outer array. The signal factor (Mj) will be the vibration weight supported by the bracket (50 kg, 60 kg or 70 kg). Noise will have two levels: Ti6Al4V and carbon steel materials (Table 3)
4. Robust design, with dynamic characteristic, of the geometry of a right angle bracket
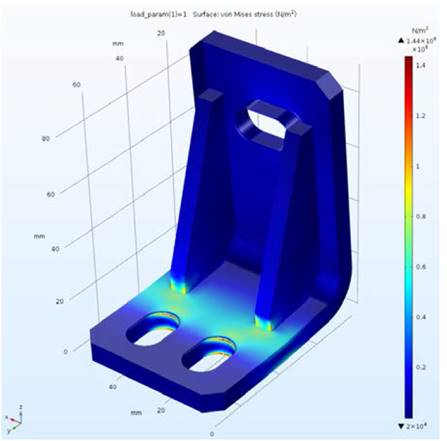
Finite element simulations were performed for each of the 36 experimental test of the Table 3. Fig. 6 shows the stress produced in a vibration cycle in one of the runs. It is clearly shown that the area close to the holes is more affected by the fatigue damage.
Source: The authors.
Figure 6 Two captures of a mechanical finite element results that it has been used to estimate the fus. It can be observed that high stress are in the bottom surface where the ribs are connected.
Having completed the finite element simulations, the S/N ratio and β values for each test run were obtained. Results are presented in Table 4.
Table 4 Results (fatigue use factor) for two levels of noise (materials) and three signal factors. If fatigue user factor (fus) is higher than 1 then the bracket will break at service
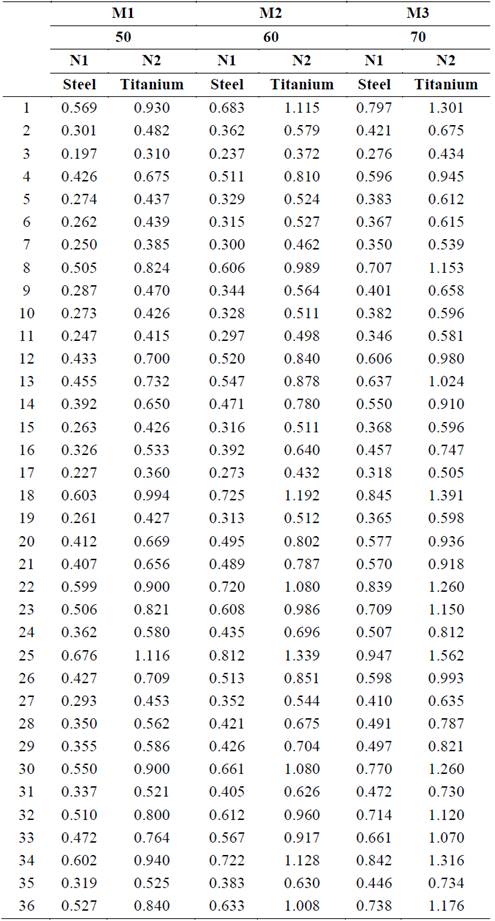
Source: The Authors
4.1. Predicting the optimal combination for controlling factors
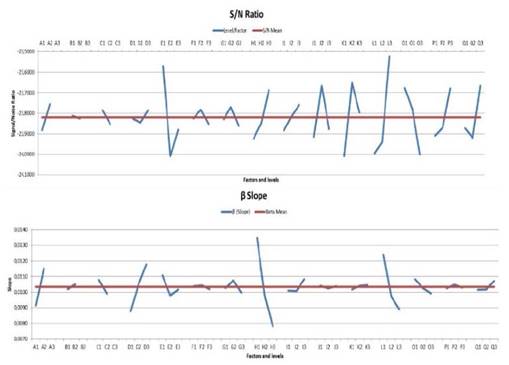
In the two-step optimization process the bracket geometry is firstly optimized identifying the controlling factors which influence the S/N ratio and the sensitivity in every level. This study is carried out starting from S/N ratio (η) and β response graphs presented in the Fig. 5. According to that, the value of controlling factor with higher value for S/N better, lower variation, and higher values for each factor level are chosen and added together.
The second step, which consists in the adjustment of the slope it is carried out after the optimal combination chosen in the first step.
Graphics enable to identify the best level of each control factor. Results clearly show that control factors such as E, H, I, K, L, O, P or Q have a significant influence in S/N ratio while factors such as A, D, H or L exerts a clear influence in the slope.
4.2. Prediction and verification
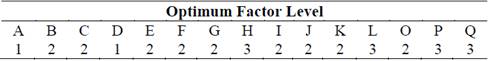
The optimum control factor combination will be established selecting the parameters with higher S/N ratio and lower β. In those cases in which a conflict between these two variables existed, the parameters which values are closer to the mean values have been selected. The optimum factor levels for the robust design are:
A1 because it has a little influence in S/N ratio and the value of β is lower.
B2 and C2 in the mean point because they have no influence.
D1 because it has not influence in S/N ratio and the value of β is lower.
E2 because it has a higher influence in S/N ratio, but it is not lineal. In this aspect it has been selected the mean value
F2 and G2 because as B and C has a less influence.
H3 has the higher S/N ratio with lower β.
I2 due to the weak effect in the S/N ratio and with I3 increases the slope.
J2 and K2 because they increase S/N ratio with a bad influence in the slope.
L3 is obviously that is better because have a higher S/N ratio and lower β slope.
O2 is a compromise solution in the mean value.
P3 has a good S/N ratio and a small influence in the slope.
Q3 because it improves S/N ratio with a little influence in slope.
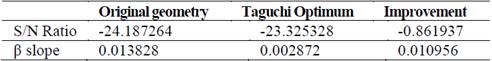
The comparisons of S/N ratio between original design and robust design, in accordance with Taguchi methods, are shown in Table 6. It can be seen that robust design slightly improves the S/N ratio and a significant effect in the slope that ensures a smaller influence on material resistance at vibration of the º.
Source: The authors.
Figure 7 The magnitudes of the average response of the control factors for the S/N ratio and for the slope β, respectively.
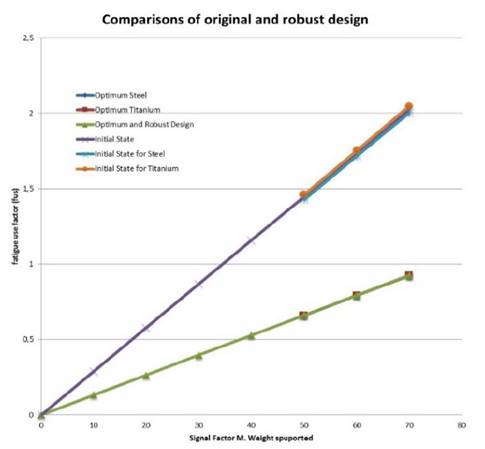
The results shown in Fig. 8 demonstrate that the Taguchi dynamic characteristic design process successfully improves the fatigue resistance of the bracket. The optimum geometry improves the life fatigue of the component and it is independent of the material used in the manufacturing process.
Source: The authors.
Figure 8 Visual comparisons between original fatigue and optimal design behavior.
The optimized bracket geometry obtained by this method is shown in Fig. 9 where It can be see that fus is less than one in al surface and that the Von-Misses stress in Fig. 10 is below of fatigue limit of this steel.

Source: The authors
Figure 9 Final results for M=70 kg. a) Steel bracket and b) Titanium bracket. It can be see that the fus is less than one in all surface.
Source: The authors
Figure 10 Final results for Von-Misses stress in steel bracket. It can be seen that maximum stresses (144 MPa) on the holes are
The optimized bracket geometry obtained by this method has been compared with the results of applying the Eurocode 3.
Table 6 Comparisons of the SN Ratio and beta between Original design and robust design.
Source: The Authors
From the industrial point of view, the calculation of the fatigue resistance of a right angle is not contemplated in the regulations in a specific way. Normally the rules of fatigue tests (EN 61373: "Railway applications, Rolling stock equipment, Shock and vibration tests"; SAE J 1455: "Environmental Practices for Electronic Equipment Design in Heavy-Duty Vehicle Applications"; MIL-STD 810F Method 514.5 "Random mechanical vibration", ...) require that the test be done on the entire structure to be validated and not on the components, because the resonance frequencies depend on the complete set. Eurocode 3 "Design of steel structures - Part 1 -9: Fatigue ", like the rest of Eurocodes, provides common rules of structural design for the design of complete structures and component products. In this sense the calculation of the fatigue, strength of a right angle, according to the Eurocode, should be made based on the detail of the stiffening ribs in table 8.5 of Eurocode 3: 1-9. In this table, a detail category of 80 MPa is specified.
Fatigue assessment should be undertaken using the tolerant method to compare it with the results of this paper. The effective stress range may be calculated by adding the tensile portion of the stress range and 60% of the magnitude of the compressive portion of the stress range, this is 230.4 MPa in this case. This value is below of fatigue limit of these materials.
5. Cost
In this paper all parameters used for applying Taguchi’s method are automatically changed in order to simulate final stress and therefore assess fatigue life.
Thus, fatigue assessment can be looped through all desired parameter combinations by setting their values in a database.
In this study 36 simulations have been produced for applying the Taguchi method.
The cost of the complete study is shown in the following Table 7.
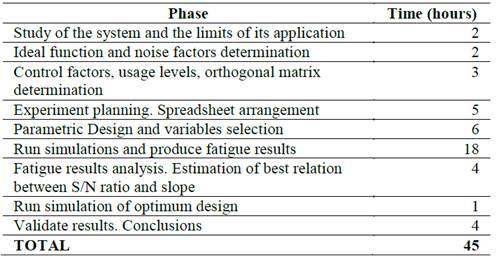
To obtain an optimum design using the Taguchi method it would be necessary to perform fatigue failure tests of all combinations which would lead to high cost in terms of time and money.
Thanks to the approach used in this study a few work hours can be used to achieve a better design by optimizing the final geometry of the component.
Therefore the number of specimens to be manufactured and tested can be greatly reduced by using the methodology described in this paper.
In addition, final design of the specimen would be more efficient which also impacts cost since it directly reduces the material required to produce the component.
6. Conclusion
This study allows combining Taguchi dynamic design method with FEM simulation in order to optimize geometrical design of a mechanical component under fatigue. The results indicate that the adopted methodology improves fatigue resistance and reduces the influence of the material used, enabling a cheaper construction, beside a short development time with no experimental testing, producing a significant cost reduction.
With the Taguchi method, the final optimal design depends mainly on the geometrical characteristics and it is possible to design straight angles tolerant to fatigue with a geometry that will behave optimally independently of the material chosen for its manufacture. This geometry is the one that best distributes the accumulated damage that will occur in the piece
A small number of experiments (36) provide the necessary data for an engineering optimization tool to improve the geometric design to optimally use the material. In this sense it is observed that the union of the stiffeners to the base of the right angle is an area of tension that must not be aligned with the area of fastening (holes) in order to avoid that the fatigue damage produced in these elements accumulates in the same region.
The present robust design has confirmed that good design components can improve its fatigue life in all types of applications independently of materials used to manufacturing

