


 English (pdf)
 Article in xml format
 Article references
 Send this article by e-mail
 Cited by SciELO
  Cited by Google
  Similars in
SciELO
Similars in
SciELO  Similars in Google
 Permalink
1. Introduction
Yield trends are insufficient for satisfying consumer demand and for duplicating crop pEroduction by 2050 [1], especially in a context where variability and climate change cause between 32 and 60 percent of yield variability [2,3]. Central American agriculture-dependent countries, the big island nations in the Caribbean, Venezuela, Colombia and Ecuador have a higher risk of climate change [4]. As such, major efforts have been made to obtain varieties that can grow in low fertility soils and are resistant to water stress, disease and increased temperatures, and to avoid improper agronomic management, which limits varietal potential and the possibility of competing on the international market [3,5]. It is highlighted that the Free Trade Agreement (FTA) between Colombia and the United States is gradually reducing rice import tariffs which will disappear altogether by 2030 [6].
The challenge of rice vis-à-vis the FTA in Latin America establishes: a) the protection of the current yield and increase the yield in the context of climate change; b) the reduction of the production costs and a difference made in terms of rice quality [5,7]; and c) the adoption of a production system with a low environmental footprint and increased water productivity [7,8]. Given that rice crops require the greatest water demand at global level, more crops must be produced per volume of water used. Irrigated rice receives between 34 and 43 percent of the total of irrigation water in the world [9]. Therefore, Latin America requires rice producers and researchers to apply agronomic management with an eco-efficient approach [10].
The Colombian rice sector is a heterogeneous one, in which modernized and efficient agribusinesses coexist with others which have a relative technological catch-up, and inefficient and unsustainable farming practices [5]. Both types of agribusiness feel the pressure on the water resources and the need to take advantage of the environmental offer (solar radiation, precipitations and water allocation by the irrigation district) [11]. As such, farmers have needed to make agricultural work more efficient to comply with sowing dates. Thus, farmers have been working faster in terms of plot design, soil preparation labors and sowing both during daylight and night-time. This has increased the deficiencies in seed distribution, unduly levelled areas and vulnerability to water stress. Nocturnal sowings without precision equipment leads to unsown areas, which are corrected days later through broadcast sowing. The lag in germination generates differences in physiological maturity, and the untimely harvests of the rice crop generate great money losses [12,13]. As many of the mechanized labors in Colombia are contracted to third parties, it is common to make operative decisions in field, which are difficult to detect by the professionals in big areas in order to apply a differentiated agronomic management. Site-specific agriculture helps to decrease the impact on grain production and quality [10].
The aforementioned highlights that being a rice farmer is a risky business in Colombia. As such, tools are necessary to help to close the yield gap and assure quality rice through timely decision-making. Effective agronomic management is crucial to closing the yield gap, as it allows some of the factors that may limit the expression of the varietal potential to be controlled [7].
Normalized Difference Vegetation Index (NDVI) is a reflectance indicator for different wavelengths of plant cover, soil, water and other materials. It is characterized by having a linear measurement scale, with a range of values between 0 and 1. The vegetation generates positive values and the soil or other objects (not vegetation), are recognized by values of less than 0.1 [14]. Healthy plant cover is characterized by the leaves absorbing most of the light in the red region (Wavelengths between 0.6 and 0.7 μm) and reflecting the near infrared (Wavelengths between 0.7 and 1.1 μm). This vegetation property allows an assessment of the condition of the rice. The NDVI is sensitive to the amount of humidity, biomass, chlorophyll concentration, leaf area index (LAI) [15], vegetation density, phenological stages, panicle stage [16], nitrogen in the plant [17], weed detection [18], etc. As such, the NDVI may have multiple applications in rice, which should be developed and validated locally to facilitate technological adoption and adjustment of the production processes. The adoption and transfer of technology is decisive in closing the yield gap in Latin and Central American countries [7,19].
This work was developed using the FEDEARROZ-2000 variety in Espinal, Tolima, Colombia, in a semi-commercial field, and with NDVI calculated from multispectral photographs taken from an Unmanned Aerial Vehicle (UAV). FEDEARROZ-2000 is farmers’ preferred variety due to its yield and resistance to the rice “hoja blanca” (white leaf) virus (RHB) and the mechanical damage caused by the “sogata” insect (Tagosodes orizicolus Muir). FEDEARROZ 2000 presents two quantitative trait loci: one located on chromosome 4 for resistance to RHB and the other located on chromosome 5 for resistance to mechanical damage produced by “sogata” [20]. Rice hoja blanca (RHB; white leaf) devastated rice crops in Cuba, Venezuela, Panama, Colombia, Brazil, Belize, Costa Rica, Dominican Republic, El Salvador, Ecuador, Guatemala, Guyana, Honduras, Mexico, Nicaragua, Peru, Puerto Rico, Surinam and the USA [21]. On the other hand, the photographs taken from the UAV allow a resolution of 5.5 cm per pixel and isolate the atmospheric noise that may be present in satellite images.
This work was aimed at assessing the potential of high resolution aerial images and the NDVI as an indicator to detect problems in the development and growth of rice in El Espinal, Tolima, Colombia
2. Methodology
Adopting cultural practices under pressure to comply with sowing dates, rice crops were established in the “La Granja” experimental plot in the Agricultural Center, National Apprenticeship Service (Servicio Nacional de Aprendizaje - SENA), at El Espinal, Tolima, Colombia. In recent years, the 4.9 ha plot of land has been managed through crop rotation alternating between rice and cotton or maize. The soils had a sandy loam texture in the upper and medium parts of the plot of land, and a loamy sand texture in its lower part. The organic matter contents are low across the plot of land. Fig. 1 shows a summary of the methodology used.
Soil preparation consisted in scything, plant waste management, two disc harrow passes, and a LandPlane pass, implemented in daytime. Contour levee and sowing were carried out with two highly experienced technicians for two consecutive nights. The technicians provide such services in Tolima. The rice was sown using a SEMEATO PD 17 sowing machine (17 lines x 17 cm) without fertilizer. Sowing density was 104.5 ± 3.3 kg of seed/ha. The tice cultivar FEDEARROZ-2000 was used and its seed germination test obtained 91 percent of germination. After the sowing, a strip of unsown soil and areas with germination problems were identified. The pre-germinated seed broadcast sowing was carried out 16 Days After Emergency (DAE) in areas which were not sown or where the seed did not emerge. As such, different rice development stages were expected in some areas.
Controls for broadleaf (Cucumis melo), Cyperaceas (Cyperus rotundus) and Echinochloa colona in post-early and applications focusing on post-late were undertaken. Fungicide was applied three times in the reproductive stage to control Pyricularia given that this variety has a higher susceptibility to disease in relative moisture greater than 80 percent [3]. The maximum moisture during crop development was 83 percent. Insecticide was not applied.
Considering the chemical analysis of the soil and the nutritional requirements of FEDEARROZ-2000 calculated with the SIFA Program (“Sistema de Fertilización Arrocera” in Spanish; [22]), it was determined to perform a fractioned fertilization with 160 kg/ha of N, 33 kg/ha P2O5 and 119 kg K2O. The application of the nitrogen fertilizer (NH4) to rice was carried out when the average readings in the field using the SPAD 502 chlorophyll meter were between 34 ± 1 SPAD. The field with the chlorophyll meter was monitored according to the guidelines established by Garcés and Castilla [23]. The third fertilization (41 DAE) application was carried out using the differentiation of floral primordium in several tillers analyzed in the field.
Rice was developed with intermittent irrigation in the dry season from May to October 2016, where the maximum solar radiation coincided with the rice’s reproductive and ripening stages, in which average solar radiation was 215.5 Cal/cm2/day. The applied depth of irrigation was 921 mm of water, and the precipitation contributed a depth of 350 mm of water. The first irrigation was carried out 12 DAE. The distribution of the monthly precipitation in the area occurs due to a bimodal regime, with abundant rainfall from March to May and from October to November, 2016. The temperature in which the crop was developed in the vegetative stage ranged between 21 and 36 °C, and in the reproductive phase between 20 and 38 °C. The sown variety, FEDEARROZ-2000, tolerates daytime temperatures of between 29 and 37 °C and does not tolerate nighttime temperatures outside a range of 21 to 25 °C [3]. In the panicle emergence in the reproductive stage (66 DAE - 78 DAE), limitations in water availability in the irrigation district channels were presented, which caused stress in rice. So a set of cultivation areas with water stress were presented.
The aerial photographs were taken during the Stage of Rice Panicle Development (SRPD; 58 DAE) and the Milky Stage (MS; 106 DAE) with a multispectral camera, and an UAV. The UAV was the PHANTOM FX-61, weighing 1.05 kg, measuring 1550 mm in width and 683 mm in length and made from EPO material (expanded polyolefin). The UAV has a KV900 brushless motor, helix, 2 servomotors (one for each aileron) and an Ardupilot Mega control system (APM 2.5). The MicaSense multispectral camera weighs 150 g. It has a resolution of 8 cm per pixel/band at 120 m high and allows to take the spectral bands in red, green, blue, “red edge” and near infrared. Image capture was carried out at 80 meters high.
The flights were carried out from 9:30 am to 12:00 pm, when the incident solar radiation is at its highest and wind speeds are at their lowest. For the flights, the following were identified: allowed heights, obstacles, winds, launching, and landing points. The height, speed, coordinates, and software for definition of the polygon of the study area were programmed. In the processing, the images were grouped with the “Pix4Dmapper pro Educational” and then, the NDVI was calculated according to Eq. 1.
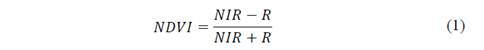
Where NIR is the datum in the near infrared and R is in the red area. The maps were represented using color scale, where the lowest NDVI were associated with black, gradually changing to gray and white, the latter with values closer to 1.
The NDVI changes with the physiological condition of the rice plant. Therefore, the temporal dynamics of the NDVI for FEDEARROZ-2000 were estimated from the temporal dynamics of the NDVI for the subspecies indica reported by Lin et al. [24]. NDVI temporal dynamics were calibrated with the NDVI for the SRPD and the MS associated with an area with good rice growth and development (Area 1). Furthermore, the in-field physiological stages detected were checked against the physiological stages forecast by NDVI temporal dynamics and the physiological stages reported by Degiovanni et al. [25].
Area 1 or the reference area presented the highest NDVI (greater than 0.8 in SRPD). The curve of NDVI temporal dynamics is a reference through which to interpret the NDVI as a function of rice stage.
Areas in the NDVI map of the SRPD with NDVI lesser than 0.8 were identified. Each area was approximately 26 m long and 7 m wide. The NDVI of each area was the weighted average of the NDVI, considering the area as the weight. The polygon with the NDVI values from the Pix4Dmapper pro Educational software were used for calculating the area and the respective weights. In the loamy sand soil, four areas with the lowest NDVI were chosen (Areas 2-5); and one in loamy sand soil (Area 6). Area 6 was in the lowest part of the plot of land with the thickest soil texture, where the effects of water stress should be higher.
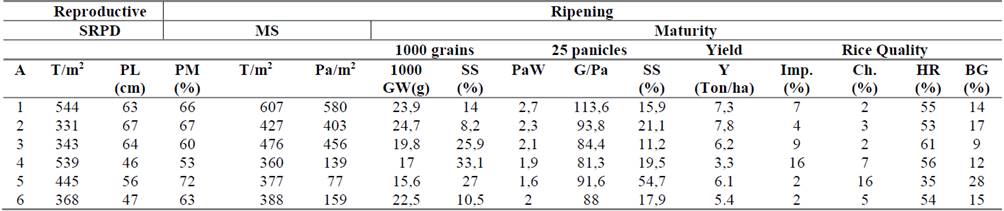
Field monitoring was carried out during the SRPD (64 DAE), the MS (101- 103 DAE), and grain and plant maturity (127-129 DAE). In the SRPD (64 DAE) and with three replications, the Plant Length (PL) and the number of Tillers per m2 (T/m2) were measured in a frame of 0.25 m2. During flowering and water stress of the crop, samplings of the areas were taken with a frame of 0.25 m2. Fresh Plant Weight (FPW), Dry Plant Weight (DPW), percentages of Dry Matter (% DM) and Plant Moisture (%PM; eq. 2) were determined in laboratory. The drying temperature was 60 °C. The T/m2 and the number of Panicles per m2 (#Pa/m2) were also determined.

During the maturity stage, 25 panicles were randomly collected within each plot. The number of filled spikelets by panicle, number of Grains per Panicle (#G/Pa), 1000 Grain Weight (1000 GW), percentage of Sterile Spikelet (% SS) and Panicle Weight (PaW) were characterized. In each plot and with two frames of 0.25 m2, the rice was harvested manually with 20.6% of average moisture, and the paddy yield (Y (Ton/ha)) was estimated. The procedures for measuring yield components were set according to the guidelines established by Dobermann and Fairhurst [26].
The NDVI was correlated with the yield components. Statistical analysis of the information collected in the software “Excel” was performed, using regression data analysis tool with 5% significance. The linear regression analysis using the "least squares" method was performed to fit a line through a set of observations. Regression statistics and variance analyses were interpreted using the Pearson Correlation Coefficient (R), Coefficient of Determination (R2) and the significance associated P-Value (P).
Two NDVI maps in Milky Stage (MS) from different harvests were compared to identify production environments (Fig. 2). The second NDVI map was constructed from the satellite image taken on December 16th 2013 in MS (108 DAE approximately; Fig. 2d). The polygons of NDVI map were reconstructed in AutoCAD (Fig. 2d).
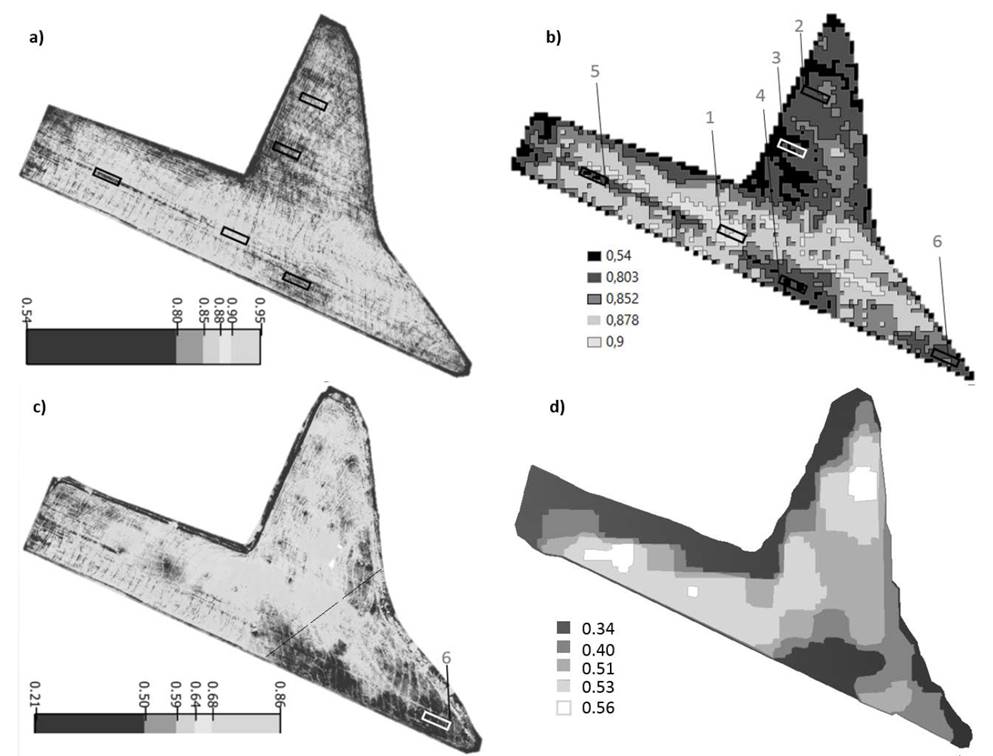
Source: a)-c) Barrero O. and the authors. d) Adapted from GEOAGRIS
Figure 2 Normalized difference vegetation index (NDVI) maps. a) Map in the Stage of Rice Panicle Development (SRPD). b) NDVI polygons map in the SRPD. c) Map in the Milky Stage (MS). d) Map elaborated from a satellite image taken in the MS.
3. Results and discussion
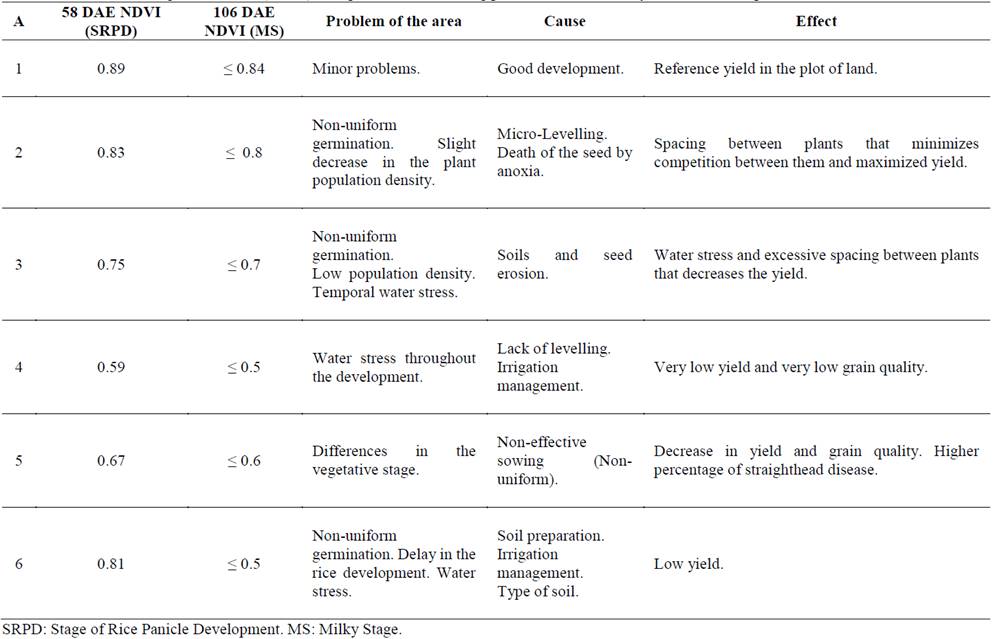
Fig. 2a-c shows the NDVI maps associated with the SRPD and the MS. The areas with agronomic management problems (Table 1) were associated with the NDVI in the SRPD lower than 0.8, the lowest yields and deficiencies in the grain quality (Table 2).
Table 1 Normalized difference vegetation index (NDVI) and qualitative monitoring parameters for the study areas of rice crop.
Source: The authors.
Areas 1, 2, 3, 4 and 5 were located in a sandy loam soil, while area 6 was located in a loamy sand soil (Fig. 2b).
Area 1 presented a good crop development, an acceptable plant height, the highest number of viable tillerings, the highest number of grains per panicle, and a good weight for the one thousand grains. This means that there was a good relationship between the gained biomass and the tillerings, from which the panicles were originated and consequently, the rice harvested. The NDVI was 0.89 and 0.84 in the SRPD and the MS, respectively (Table 1).
Fig. 3 presents the NDVI temporal dynamics for FEDEARROZ-2000. The period between 0 to 10 days corresponds from the germination until its seedling stage, where the NDVI is influenced mostly by soil and water.
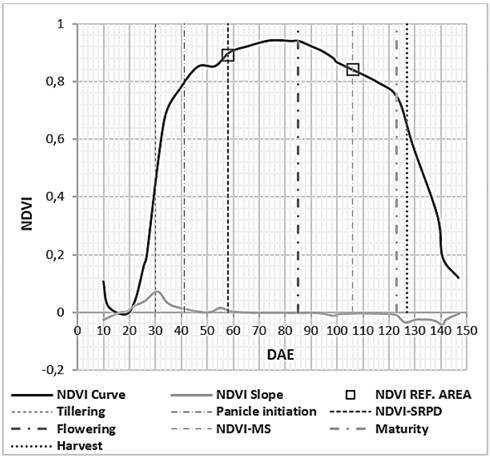
Source: The authors. Information reported by [24] was used.
Figure 3 Estimation of the temporal dynamics of normalized difference vegetation index for rice cv. FEDEARROZ-2000.
The DAE corresponding to maximum tillering (30 DAE), flowering (85 DAE) and rice maturity (123 DAE) were predicted by NDVI temporal dynamics (Fig. 3). The largest spike in the curve of the NDVI slope indicated the duration of tillering stage.
After the panicle initiation, the NDVI should be above 0.8 in a plant with a good development and above 0.85 between the panicle development and flowering. NDVI increase with rice growing and tillering. The second spike corresponded to panicle development [24]. The heading and flowering stage is characterized by the maximum NDVI, and at the maturity stage, NDVI decreased continuously (the change of the NDVI slope began at 123 DAE, Fig. 3).
Harvesting was carried out with 20.6% of grain moisture content in the reference area and 127 DAE. The grain moisture content indicates that the harvest was delayed. Hence, the intersection between NDVI temporal dynamics and line corresponding to DAE to harvest was coherent.
NDVI allowed to corroborate water stress and differences in the population density, i.e., abnormal spacing between plants despite a good biomass.
NDVI for the SRPD were lesser than 0.83 and 0.75 in areas 2 and 3, respectively. The population density in areas 2 and 3 decreased (Fig. 4a), as reflected in the T/m2 (Table 2). The reduction was of between 27 and 18% in the T/m2 in areas 2 and 3 compared with Area 1, whereas the plants were between 2 and 6% higher in areas 2 and 3. The emergence of the plants was inhibited by anoxia in Area 2 and, there was seed erosion by water flow and deficiencies in the leveling in Area 3.
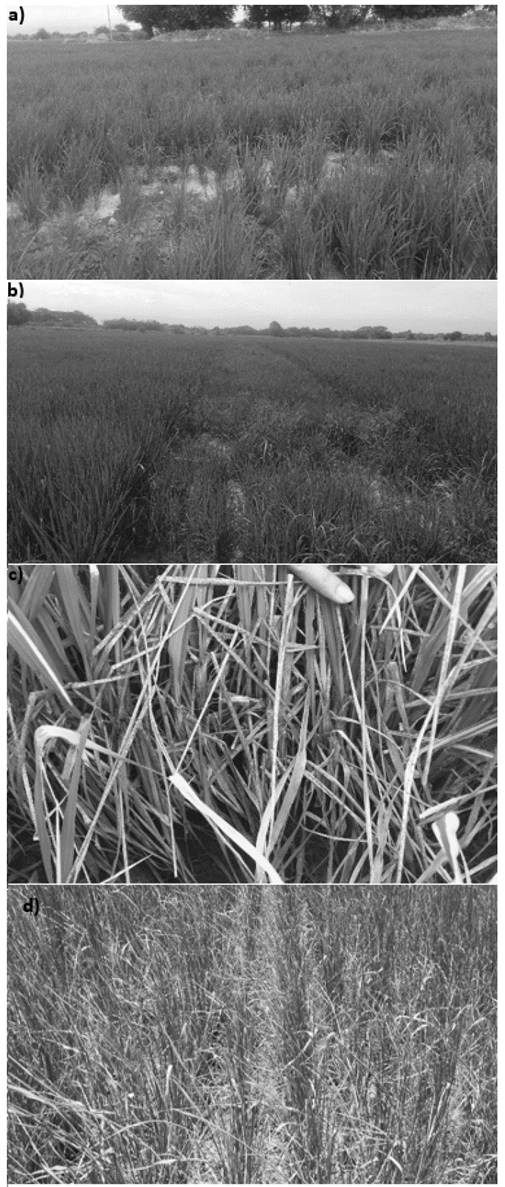
Source: The authors.
Figure 4 Monitoring in Field. Area 3 (a) and Area 5 (b) during the Stage of Rice Panicle Development (SRPD). Area 4 (c) and Area 6 (d) during the Milky Stage (MS).
In the NDVI map for the MS, areas 2 and 3 showed values below 0.84 and 0.7 respectively. According to the yield components (Table 2), Area 2 showed the highest yield and the highest 1000 grain weight, as competition between plants for nutrients, water and light was minimized.
Area 3 showed a large percentage of spikelet sterility (SS = 25.9%) probably caused by water stress. In Area 3, NDVI was associated with both water stress and population density.
Water stress also had a great impact in Area 4, which was reflected in the NDVI map of the SRPD with values below 0.59. Plant height was 27% less than the reference area (Table 2). In terms of rice field work, deficiencies were detected for the micro-leveler (Land plane). The lack of soil moisture affected weed and disease control, favoring a reduction in the tillers population due to senescence processes (competition among the tillers). The T/m2 decreased by 33% between the SRPD and the MS. Therefore, despite the good number of tillers, many of them were not effective. The delay in irrigation during the emergence of the panicle was clearly evidenced in the NDVI map corresponding to the MS (Fig. 2c), and in the necrotic plant tissue (Fig. 4c). Area 4 had the highest percentage of sterility in spikelet (SS = 33.0%), the lowest number of grains per panicle and lowest yield. The rice plant is very sensitive to drought from the panicle initiation stage until the spikelet, which may reduce the yield when increasing spikelet sterility [27].
Area 5 in the SRPD showed a NDVI of 0.67, 445 T/m2, and a plant height of 56 cm which, with respect to the reference area, corresponds on average to differences of 25, 82 and 84 percent, respectively.
The sowing machine did not pass over Area 5 and the pre-germinated broadcast seed was distributed. An NDVI lower than 0.8 reflect differences in the development of rice with respect to the rest of the crop (Fig. 4b). In this area the plants had not reached the maximum tillers elongation. In the second MS overflight, NDVI lower than those from the Area 1 were observed. Given that the whole plot of land was harvested on a same day, limitations in the grain quality and yield for this area were presented (Table 2). For the FEDEARROZ variety, head rice percentage for normal rice should be above 55%, and the percentage of broken grain should be between 8 and 20% (BG (%)) [12, 13]. The grain harvested in Area 5 was not within this range (HR = 35%; BG = 28%). When rice is harvested very early, chalkiness increases leading to a significant increase of broken grains in the milling process [12]. This causes economic loss for the farmer as their product is damaged in the mill, as white rice in these conditions is considered to be of poor quality and appearance.
Area 6 was located at the entrance and exit of the machinery, and is also the lowest part of the plot where water drains. This area showed NDVI below 0.81 in the SRPD and the MS, a very low number of productive tillerings, number of grains per panicle and the second lowest yield. Particularly, Area 6 had a thicker soil consistency (Loamy sand, Fig. 2c), which is why it was sensitive to the delay in the irrigation. The competition between close plants for water and nutrients decreased the amount of productive tillerings [28,29].
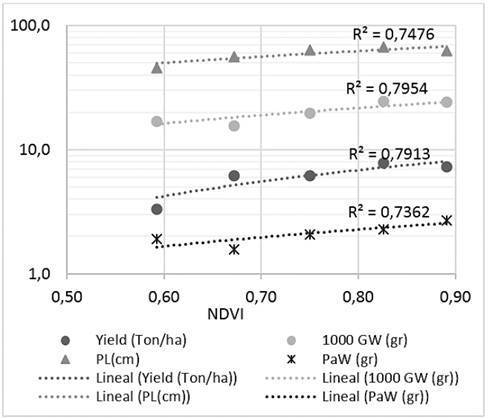
The NDVI in the SRPD for areas 1, 2, 3, 4 and 5, areas with the same type of soil, showed a high positive correlation with the T/m2 (R=0.869; p≤0.056), #Pa/m2 (R=0.895; p≤0.040), PaW (R=0.858; p≤0.063), 1000 grain weight (R=0.898; p≤0.039) and yield (R=0.898; p≤0.043). Given that the p value is less than 0.05 in the relationship between NDVI and #Pa/m2, 1000 grain weight and yield, the results are statistically significant. The results of the relationship between NDVI and PaW and T/m2 are marginally significant. This highlights the potential of the NDVI to estimate the rice yield. Fig. 5 and 6 showed the coefficient of determination, R2.
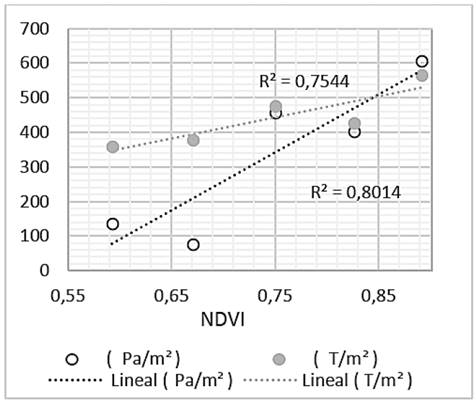
Source: The authors.
Figure 5 Normalized difference vegetation index (NDVI) during Stage of Rice Panicle Development (SRPD) vs #T/m2 and #Pa/m2 in the Milky Stage
Source: The authors.
Figure 6 Normalized difference vegetation index (NDVI) vs. Yield, Panicle Weight (PaW), 1000 Grain Weight and Length Plant (LP)
Fig. 2d shows the NDVI map constructed from the satellite image. The maximum, minimum and median NDVI, and its variance were 0.56, 0.34 and 0.51, 0.004, respectively. The NDVI values were within the range for identifying rice crops with satellite images (0.36≤NDVI≤0.71; [30]); although they were lower with respect to NDVI from UAV images. NDVI is sensitive to atmospheric noise (presence of clouds) and height between the multispectral camera and the crop. Furthermore, NDVI is affected by the seasons and date, as there are changes in the solar radiation intensity [18, 30]. Despite differences in magnitude between NDVI maps from different harvests (Fig. 2c-d), the lowest NDVI is common around areas 4 and 6, while Area 1 is associated with higher NDVI. Considering that areas 4 and 6 in the plot of land show a thicker soil, lower yield and lower NDVI, the presence of a low production environment has been identified. Area 1 has a sandy-loam soil, a higher yield and NDVI, thus this may be associated with a production environment with high potential.
The commercial harvest of the experimental lot was carried out in two zones. One of them included areas 4 and 6 (Dotted line, Fig. 2c; low production environment), which tend to lose price in the rice harvested due to impurities and quality. To make a difference in the quality of rice, the commercial harvest of Area 5 must be differentiated from Area 1, 2 and 3 with precision harvester. Thus, the NDVI helps to identify environments in rice [31] and harvest areas.
It is highlighted that the NDVI from satellite images possesses a resolution lower (5 to 25 cm/pixel) than the UAV images (5 cm/pixel), which is why satellite images have greater limitations to focus agronomic management problems.
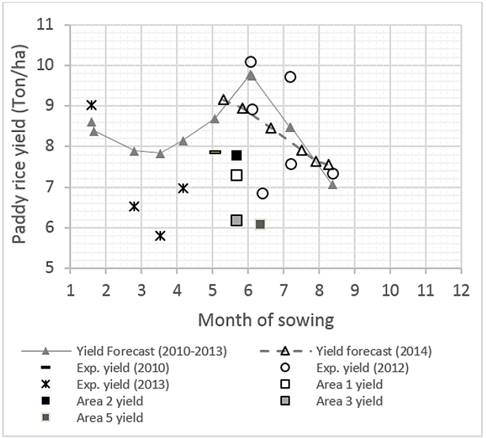
Areas 2, 3, 4, 5 and 6 showed deficiencies in leveling and sowing, which affected water distribution in the plot of land, and had consequences on crop development. In Area 2, moderate spacing between plants favored the development of strong plants which was reflected in the highest yield. The plants located in areas 3, 4 and 6 were developed with water stress during the whole cycle, limiting the yield potential. The yield from Area 5 showed how the delay in sowing affected yield by differences in rice development and changes in the environmental offer (Fig. 7). If farmers in El Espinal decide to sow after May, all cultivars would likely have lower yields ([32]; Fig. 7).
Source: The authors. Information reported by [32] was used.
Figure 7 Paddy rice yield (Ton/ha) of FEDEARROZ-2000 in Tolima.
After the initiation of the reproductive stages, the NDVI map is a tool with which to diagnose rice in large scales. Rice in these stages should have reached maximum tillering, making the NDVI reach a threshold and a minimum change with respect to time (Fig. 3). The above facilitate the standardization of the method and the interpretation of information. Moreover, the rice biomass minimizes the effect of water and soil in the NDVI map [33], which is why areas with a low NDVI can be associated with abnormal spacing between plants or with rice development problems.
The NDVI accompanied by field monitoring allows the detection of rice areas with the following: Deficiency of phosphorus (delays in growth) and nitrogen, differences in the physiological stages, water stress, plant diseases, insect infestation, problems of sowing date and optimal sowing density. Nitrogen in rice is significantly correlated with NDVI in panicle initiation [17]. An NDVI taken between the panicle development and heading may predict the rice yield [17] and production environments [30].
Once the problems have been identified using the NDVI map, corrective measures should be taken to obtain a good panicle size and a good number of grains during the reproductive stage. To decrease the impact on the production due to differences in the vegetative stage of the plants, a specific agronomic management by area can be carried out with fertilizers. In the healthy crop, there can be a late application of nitrogen in the flowering stage to delay the senescence of tillers and improve the grain filling. Of 68% of the carbohydrates stored until flowering stage, 26% are invested in grain filling [34]. Thus, the reserves in the flowering stage may increase the yields from 1 to 2 ton/ha [34]. Given the case, phosphorus can also be applied to the most delayed plants to advance flowering and maturing. Methods for delaying and advancing flowering are presented in Verma et al. [35].
NDVI is a conservative indicator of water stress [36]. It may help to assess the effectiveness of the intermittent irrigation, plan differentiated irrigations [37] and, in this sense, it contributes to water productivity. Between the flowering stage and the waxy stage, corrective measures should be taken to avoid water stress and protect the grains filling and their weight.
Harvesting immature rice with moistures greater than 28% should be avoided, as this causes an increase in harvest loss of up to 8%, and impurity content of up to 10% [12,13]. Therefore, the harvest areas can be defined with an NDVI map in Milky Stage (Fig. 2c) and the NDVI temporal dynamics, since they are indicators of the stage of the rice [37,38]. This can make a difference in rice quality.
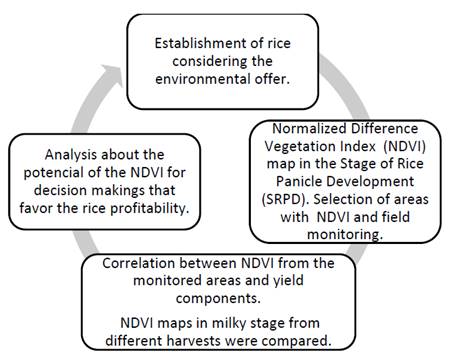
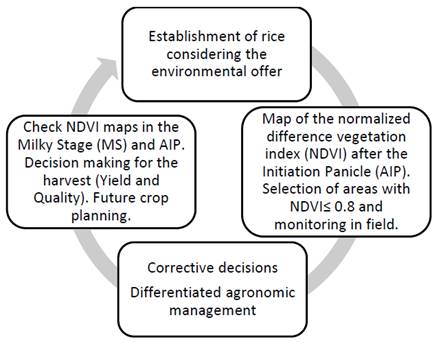
Fig. 8 shows the methodology proposed to introduce the NDVI as a tool for decision making in the productive sector.
Source: The authors.
Figure 8 Methodology proposed to introduce the NDVI as a tool for decision making (Based on the Deming Cycle)
According to Berrío et al. [39], the area of coverage by a UAV flight may be of around 9 km2 (900ha) (depending on the resolution). This is why the tool is useful for large-scale monitoring.
The NDVI map is a tool for decision making that contributes to the effectiveness in the agronomic management [37,38,40]. The effectiveness tries to find a balance between efficiency and efficacy to achieve the greatest profitability. An NDVI map helps to apply a differentiated agronomic management for results achievement (efficacy: good plant population/m2, good number of panicles/m2 and a good yield). Hence, NDVI maps can help to close the rice yield gap. Fig. 7 showed the yield gap for FEDEARROZ 2000 in Espinal, Tolima. The yield gap was the difference between experimental yield (□) and yield forecast (Δ) as reported by FEDEARROZ and CIAT [3] and Cock and Yoshida, [34].
The efficiency seeks to optimize the relationship between the resources used and the results obtained. Hence, the economic viability of NDVI maps should be supported with local economic research. The reduction of inputs, rice quality and yield increase must compensate the costs of NDVI maps.
The costs of an NDVI map in Colombia ranges between 8 and 20 dollars per hectare, and association among small-scale users is essential to reduce costs. Assuming the price of 290 US/T of paddy rice in Colombia (estimated from FEDEARROZ [41]), the investment in the NDVI map would be recovered with an increase in production of 0.07 t/ha (closing the rice yield gap; Fig. 7).
According to Preciado [13], a harvest moisture content of 18% generates losses of approximately 203 US/ha in Colombia; while with a harvest moisture content of 28% approximately 192 US/ha is lost. Hence, to schedule the harvest areas with NDVI maps helps to recover their costs.
Some multispectral cameras have begun to incorporate the high quality RGB image as a complement. This new tool of the camera will obtain the following in one single overflight with UAV: multispectral image and images to the Digital Surface Model (DSM) and the Digital Terrain Model (DTM). DSM represents the Earth's surface and includes all objects on it. DTM represents the bare ground surface without any objects [42]. The DTM information with elevation accuracies of up to 6 cm allows the design of draining, irrigation and rainwater harvesting. This would help return their costs too.
4. Conclusions
Areas with agronomic management problems were associated with an NDVI of lower than 0.8 in the stage of rice panicle development. NDVI allowed to focus areas with levelling problems, differences in the vegetative stage, water stress and abnormal spacing between plants. In addition, NDVI in the SRPD had a significant positive correlation with the 1000 grain weight, number of panicles per square meter, and the rice yield (0.86≤R≤ 0.90; P≤0.043).
The use of NDVI in the reproductive stages is an input with a great potential for the decision making to favor the grain production and quality. It can be used to make corrective agronomic management decisions or as a planning tool for future harvests (Estimating rice yield). The NDVI map in Milky Stage helped to identify production environments and to spatially and temporally plan the harvest.
The NDVI focuses on areas with limitations in the terms of rice development and growth, which is why the tool can be very useful for large-scale monitoring.
Adjusted the temporal dynamics of the NDVI for FEDEARROZ-2000, this work establishes bases to plan, monitor and control agronomic management problems with Unmanned Aerial Vehicle, multispectral camera and NDVI maps.

