


 Inglês (pdf)
 Artigo em XML
 Referências do artigo
 Enviar este artigo por email
 Citado por SciELO
  Citado por Google
  Similares em
SciELO
Similares em
SciELO  Similares em Google
 Permalink
1. Introduction
Considering the large number of batteries currently in existence and their potential exploitation for second activities that may make them have a greater presence in the energy sector [1], their chargers have become a device of great importance. On the other hand, electric vehicles are seen as an important alternative to face problems caused by pollution [2]; they also help alleviate the current oil crisis. However, such technology still poses some difficulties, especially in the energy storage system [3], this being the main reason why chargers are once again an essential part in the use of batteries.
Currently, a large number of chargers can be found in the market, but many of them do not include features of great importance for the consumer. Four of these characteristics can be efficiency, power factor (PF), total harmonic distortion (THD) of current, and implemented charging strategies. The first of such features requires a good use of energy drawn from the grid, something that has a strong impact on both the consumer and the environment. The second and third features are related to the first one, but in addition to this, they are required to meet the present need to improve the quality of energy taken from the grid as well as the electromagnetic compatibility [4]. This is because the quality of power supply emerges as an important factor in its distribution, since the performance of devices connected to the grid largely depends on this; as shown in [5], the increase of temperature in the low voltage cables, due to stationary disturbance, can reduce the lifetime and the isolation of conductor, an increases of nearly 5 ºC can reduce its lifetime in 50%. Moreover, the connection of different loads to the grid, such as electric vehicles in order to recharge their batteries, can cause voltage drops and injection of harmonic currents to the grid, if the control strategies are not adequate [6].
Considering that the current harmonics also depend on the magnitude of the grid voltage harmonics and its angles, and in most cases these relations are nonlinear [7], another drawbacks would be mentioned, such as problems related to synchronization, energy meter setbacks, malfunctioning of protection systems, interference with communication lines, and deterioration in the service life of a transformer [8].
This paper presents the design, simulation, and implementation of a battery charger with different capacities that also incorporates the four aforementioned features. Section 2 shows the design of a Buck and a Boost converter, whereas the third section presents the modelling of such converters using state variables. In section 4, a strategy control and its corresponding controllers are developed, taking into consideration the modelling produced in section 3. Section 5 shows the charger simulation with the aim of validating the power stage and controller design, which also includes a simple battery model. Finally, experiment results performed on the prototype, such as efficiency, load profile, PF, THD, and its comparison with standard IEC 61000-3-2 are shown.
2. DC-DC Converter design
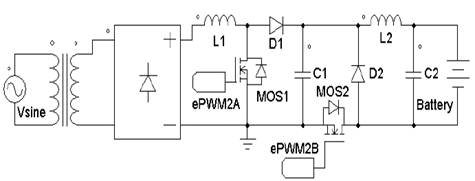
As mentioned above, such charger consists of a stage of galvanic isolation, a rectifier, a PFC (Power Factor Corrector), and a buck converter, as shown in Fig. 1. This section presents the design of the Buck-Boost PFC converter using the small ripple approximation, in which the value of every element is determined according to the operating characteristics given in each converter.
2.1. Boost converter
The topology chosen for the PFC is Boost-type as it has a coil in its input; this makes it much easier to control the line current. Once the operating values of the converter have been established, it is necessary to begin with the input voltage, which is calculated as the nominal peak value of grid 170 V, divided by the transformation ratio, being 6 in this particular case; this results in 28.33 V. The next parameter to define is the Boost output voltage which, according to previous studies of efficiency conducted, is set at 50 V so as to obtain a duty cycle close to 0.43 and operate at maximum efficiency. Considering this output voltage, equation (1) is applied to solve for the duty cycle value, which yields a result of D = 0.4848.

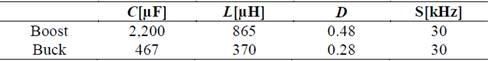
On the other hand, it is established that the device will handle a maximum power of about 150 W that, when conduction losses are ignored, represents a load resistance equal to 20.16 Ω, which in turn yields a load current equal to 5.29 A. Inductance value, as noted in Table 1, is determined by using equation (2) and establishing a ripple of 5 % for the output current of the PFC, along with the above parameters.

To find the output capacitance, a 5% ripple is set at the output voltage (ΔVo) and replaced in equation (3); its result is shown in Table 1.

2.2. Buck converter
With the aim of regulating the current or voltage delivered to the battery, and taking into consideration the operating charging strategy, a Buck-type converter is connected. For its design, the range of duty cycle in which it will operate using equation (4) is defined, starting with minimum and maximum voltage values given at the Boost converter output.

By performing a similar procedure of the Boost design, the Buck converter is designed. The inductance (L) and capacitance (C) values are found and set forth in Table 1, together with the element values found for the boost and parameters such as duty cycle (D) and switching frequency (fs).
3. Converter modelling
The AC modelling of the converters is performed in this section. In order to do this, the procedure described in [9] is carried out, in which voltages across the coils and capacitor currents are disturbed and linearized, ignoring second order terms.
3.1. Boost converter
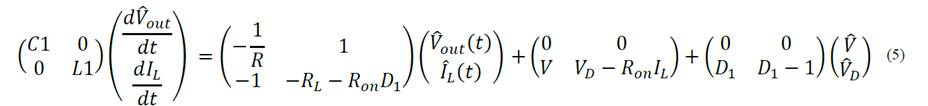
For this converter, the modelling was done taking into account coil losses ( RL ), switch losses (Ron,) and the diode forward voltage ( V 𝐷 ), obtaining equation (5). In this equation, 𝑉 𝑜𝑢𝑡 and 𝐼 𝐿 are the linear terms of C1 voltage and L1 current, respectively.
3.2. Buck converter
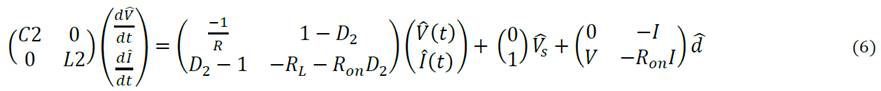
For this analysis, conduction loss in the coil L2 and in the switch, denoted as 𝑅 𝐿 and 𝑅 𝑜𝑛 , respectively, are also included. The result of such analysis is equation (6). In this equation, D is the stationary value of the duty cycle and 𝑑 is the duty cycle variation around the equilibrium point.
4. Control loop design
This section presents the corresponding block diagrams for each of the converters. Transfer functions of the specific blocks are obtained by means of the modelling performed in the previous section; in this way, the resultant controllers are therefore designed.
4.1. Boost circuit controller
In the design of the Boost circuit controller that serves as PFC, the block diagram in Fig. 2 is presented, showing the input current loop (internal), which is responsible for maintaining the sinusoidal input current in phase with the line voltage waveform.
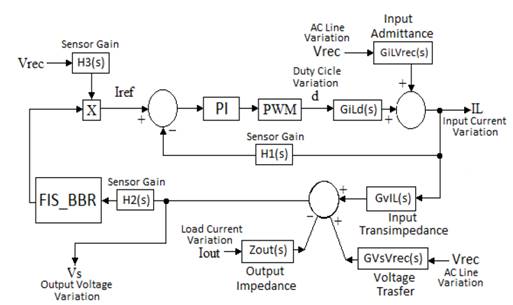
On the other hand, the voltage loop (external), which regulates voltage output of the PFC, is built under the control scheme of average current [10]. The two previous loops consist of GiLVrec, Gild, GvIL, and GVsVrec, which are the current transfer functions in the current depended voltage source, duty cycle dependent current source, output voltage-dependent current source, and output voltage-dependent line voltage source, respectively. H1, H2, and H3 are the transfer functions of the corresponding filters. The compensator of current loop is PI type, whereas a fuzzy controller based on Boolean relations (FIS BBR) [11] was implemented due to the complexity of the voltage loop and the temporal variations of some of its parameters.
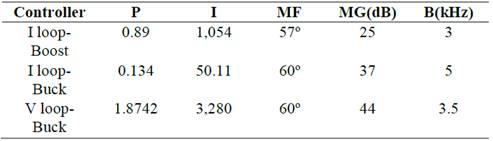
To facilitate the control task, the gains of direct path are intended to be significantly greater than the loop, so that disturbances can be ignored, as shown in Fig. 2. Bearing in mind the above, a frequency-based PI compensator is designed, whose necessary parameters for its implementation are described in Table 2.
The fuzzy voltage control loop takes that losses in the Boost can be ignored, making the PFC power input (P in ) and output equal, which allows it to solve for the constant of proportionality K between the voltage (V rms ) and line current, therefore obtaining equation (7), where Ss and Sr are the voltage and current sensors, respectively.

Taking into account the range of variation of P in (from 0 W to 180 W), an operating range of K between 0 and 0.58 is presented. On the other hand, equation (8), in which V C1 , K ADC , and K C represent the rated voltage on the capacitor, amplification of ADC (gain) and sensor gain, respectively, is obtained; this equation yields a result of 3,078.8 for the antecedent variable (V XD ).

Therefore, for the sake of simplicity, three membership functions for the antecedent variable as well as three virtual actuators are set; equation (9) is obtained as the output controller.

4.2. Buck circuit controller
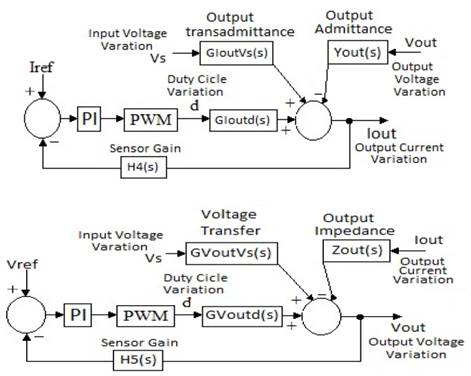
Since at this stage the charger will act as a source of current or voltage, depending on the charging strategy adopted, it is necessary to develop two control loops which can operate independently and regulate the output voltage and current of the charger. The block diagram in Fig. 3 (top) shows the Buck converter operating in the constant current mode, while Fig. 3 (bottom) presents the block diagram when operating in constant voltage mode. Once again, this seeks to ensure that the gains of direct path are large enough to ignore disturbances coming from external agents.
Finally, using the modelling performed in section 3, transfer functions for current and voltage of the Boost converter are obtained and shown in equations (10, 11).


The transfer current and voltage transfer functions of the Buck converter are shown in equations (12, 13).


Additionally, an analysis in frequency is conducted. The result is PI controllers, whose gains (P and I) for a discrete implementation are described in Table 2, which includes the corresponding bandwidths (B), phase margin (PM), and gain margin (GM).
5. Simulations
To check the task of converters and controllers design, this section presents the simulation of the charger. However, it is first of all necessary to choose a reliable detection method for the state of charge (SOC). To this end, models are based on neural networks [12,13], fuzzy logic [14], and Adaptive Unscented Kalman Filter and support vector machine [15].
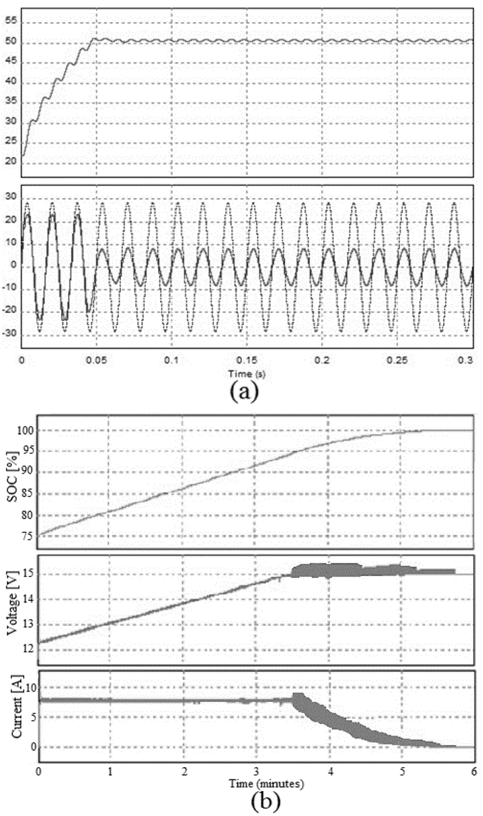
When analyzing these different methods, the one suggested in [16] is chosen because of simplicity and effectiveness. The upper part of Fig. 4(a) shows the PFC output, indicating a stable behavior close to the value at which it was designed (50 V). On the other hand, the lower part of Fig. 4(a) shows the line voltage (dashed line) and current (grid), in which the sinusoidal behavior as well as its input voltage phase can be seen, implying a THD equal to 4.3 % and a PF of 0.998.
Source: The authors
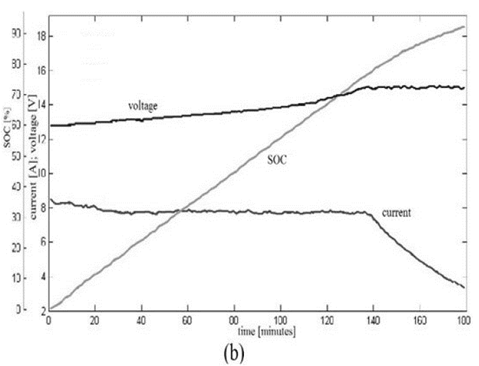
Figure 4 (a) PFC output voltage (top), voltage (dashed line), and current (continuous line) line (down); (b) SOC (top), battery voltage (middle), and battery current (down)
The operation of charger is now simulated, intended to recharge a battery of 12 V in the constant current-voltage mode. In order to do this, constant current is used until the battery reaches 15 V, time at which it is necessary to make the transition to constant voltage, ending the process completely until a state of charge (SOC) equal to 95 % is reached. Fig. 4(b) shows the result of this operation
6. Experiment results
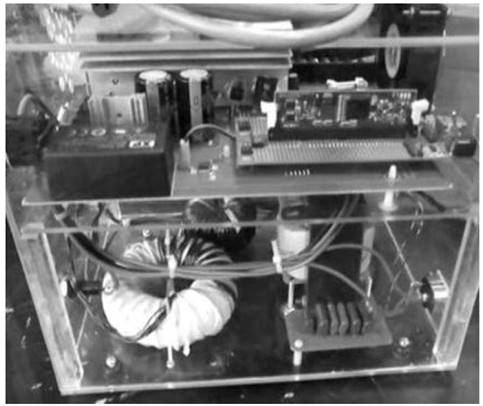
The prototype shown in Fig. 5 was obtained as a result of the proposed charger implementation, along with tests performed when recharging a battery of 12 V and 26 AH so as to obtain the SOC. Voltage and current in the ba ttery during the entire charging process are shown and presented in Fig. 6. In this latter figure, it is important to highlight the good behavior of these variables during the process and the smooth transition between the two operating modes.
To evaluate the THD and the PF, current waveforms and line voltage in Fig. 7 are firstly shown, which indicates a sinusoidal current behavior; it implies a low THD. However, it also demonstrates that it is approximately proportional to the phase voltage, which means a PF close to the unit.
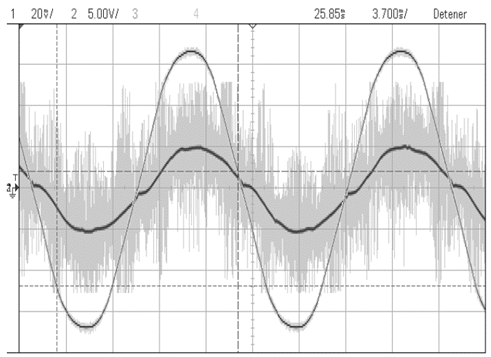
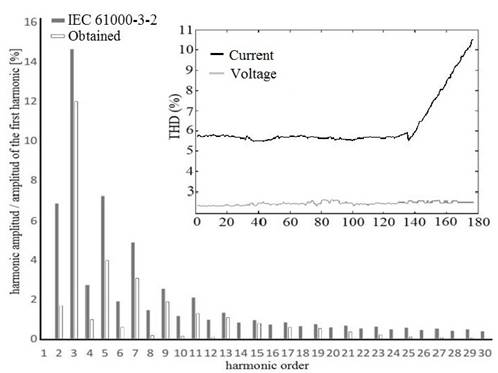
Fig. 8 compares the amplitude of each harmonic regarding standard IEC 61000-3-2 with the line current waveform of the charger. In addition, the measurement of THD of voltage and line current during the charging process is presented in zoom-in waveforms of the same figure, made with a properly calibrated 824 PQA. The figure highlights an average value of THD of 5.7% in current during the constant current mode, which increases to a maximum of 10.3% for the end of the process. However, it is worth noting that the grid voltage also presents an inherent THD of 2.3% on average, affecting the input current behavior. As discussed in the design, the PFC is synchronized with the grid; this is an advantage over other strategies, such as resonant and repetitive control that have been proposed in recent works and where their performance is affected by changes in grid frequency. Other works such as [17] proposes odd-harmonic high order repetitive control, which yields better results; its drawback, however, is that only removes the odd harmonic.
Source: The authors
Figure 8 Comparison between THD obtained (red) and the THD of IEC 61000-3-2 (blue) and a zoom of temporal behavior of current (blue) and voltage (red) line THD
In addition to the good quality of sinusoidal input current, this also presents a very small gap with respect to the line voltage, which implies a PF close to the unit as can be seen in Fig. 9 (top); it shows the cosine of the phase angle between line voltage and current as well as the PF of the charger, each reaching an average value for the constant current mode of 0.977 and 0.976, respectively. However, these values decrease to a minimum of 0.912 and 0.892 at the end of the charging process. Similarly, the low value of THD and the PF close to the unit make the losses in the various elements of the charger diminish, thereby contributing significantly to the efficiency of the device. According to Fig. 9(b), it reaches a maximum value of 91.1 % for the constant current mode until reaching a value of 60% at the end of the loading process. At this stage, the power consumption is 18 W, which can be compared to the inherent losses in the charger.
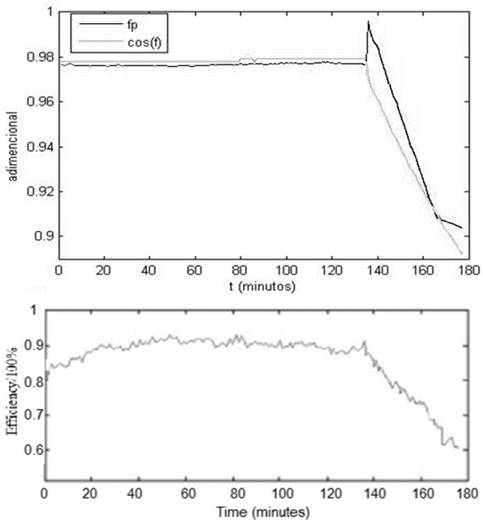
Source: The authors
Figure 9 (a). FP and cosine of the phase angle between current and voltage line; (b) charger’s efficiency during recharging process
As can be seen in many of the results presented above, the benefits of the charger decrease in the constant voltage mode since, at this stage, the power consumption considerably decreases, distancing the charger from the operating nominal conditions for which it was designed.
Conclusions
A battery charger with dual power converter topology was designed and implemented, capable of operating three separate loading strategies: constant voltage, constant current, and constant current-voltage. Unlike chargers currently found in the market, the developed prototype includes a power factor corrector which establishes a PF unit and a control strategy that allows it to generate a semi-sinusoidal input current and in turn makes it attain THD values in current close to 5.7 %, this in compliance with the standard IEC 61000-3-2. In addition to that, it also reduces losses in the device. Another important feature of the developed prototype is that it can be programmed for charging batteries for a wide range of capacities. Nevertheless, it is recommended that this should be between 10 AH and 80 AH, so that the THD and PF can be kept in satisfactory values.

