


 English (pdf)
 Article in xml format
 Article references
 Send this article by e-mail
 Cited by SciELO
  Cited by Google
  Similars in
SciELO
Similars in
SciELO  Similars in Google
 Permalink
1. Introduction
Hydraulic conductivity is one of the most important properties of soils [1]. Seepage through the soils may affect the stability of geotechnical structures such as pavement, tunnels, walls, slopes and excavations. For Nagaraj et al., Ozgurel & Vipulanandan and Mokwa & Trimble [2-4] the parameter which controls the permeability of soils is grain size while Lambe & Whitman [5] affirm that a soil’s hydraulic conductivity depends on connectivity of pores within the material, and Haigh et al. [6] have established that tortuosity, void ratios and relative density are the parameters which permit seepage through granular soils. Nevertheless, soil permeability also depends on several additional factors including temperature, atmospheric pressure and absorption [7].
Seepage in soils is established by Darcy’s Law according to which flow through a soil is laminar while flow velocity depends on the hydraulic gradient (i) [8]. The law is expressed by an equation for flow velocity that can be used to estimate the permeability coefficient (k) [9]. Flows only occur when an energy differential exists which is another way of saying when i exists. Hence, differences of energy or potential between two points must exist into the soil.
On the other hand, the soil is a non-homogenous, anisotropic and non-continuous material [10]. In nature, and at the majority of building sites, soil is layered. This means that soil properties may change from one stratum to another [1]. Because of processes of material formation and soil stratification, it is necessary to assess the hydraulic conductivity of each layer of soil in order to calculate the equivalent permeability coefficient (k’) which is a weighted average that takes the number of soil layers and their thicknesses into account. It can be used to monitor the hydraulic conductivity of a layered soil mass as well as flow direction within that mass [11].
Numerous methods have been developed to measure hydraulic conductivity of soils either in the field or through laboratory procedures [12,13]. In the field, permeability is evaluated by instrumentation of boreholes [12], but in the laboratory, the most popular procedure for evaluating hydraulic conductivity of granular soils is constant head testing which is described in ASTM standard D2434 [14]. The falling head test method is equally popular for fine-grained soils [13,15].
Various groups have developed new methods and insights in this area. Ghanizadeh et al. [16] estimated k in various types of fractured rocks in the field, using three different methods: i) profile probe, ii) pulse-decay, and iii) the crushed-rock permeability technique. They presented laboratory results for gas permeability measurements for the low matrix permeability Duvernay shale formation of Alberta, Canada. Estabragh et al. have done numerical simulations of seepage in porous media through which they obtained a numerical simulator that is useful for interpreting tests in which permeability changes affect flows within geomaterials [17]. Ai & Hu [18] have used the finite element method (FEM) to assess hydraulic conductivity in layered soils through which they established a method, based on the application of stiffness matrix in a multilayered soil model, to compute shear deformation and rotary inertia in soil-structure interaction problems. Others have made new developments in the laboratory. Goh et al. [19] modified a triaxial cell to estimate permeability in unsaturated soils, Anderson et al. [20] used a geotechnical centrifuge to estimate permeability in fine-grained soils, and Israr et al. [21] used a modified filtration apparatus to directly evaluated soil hydraulic conductivity under static and dynamic conditions. Meanwhile, Ilek & Kucza [22] have presented a novel apparatus for measuring infiltration properties of undisturbed soil samples.
This paper describes the construction, calibration and implementation of a novel physical model for measuring hydraulic conductivity in layered soils. It describes our experimental program which included the development of a method for assessing k and k’ in two different types of sandy soils, Guamo sand and Ottawa sand. These parameters were obtained from tests performed in perpendicular and parallel flow directions using our new physical model for permeability testing. Finally, Student’s t-test is used to compare experimental results and results obtained by using equations reported in the literature.
2. Experimental program
2.1. Materials
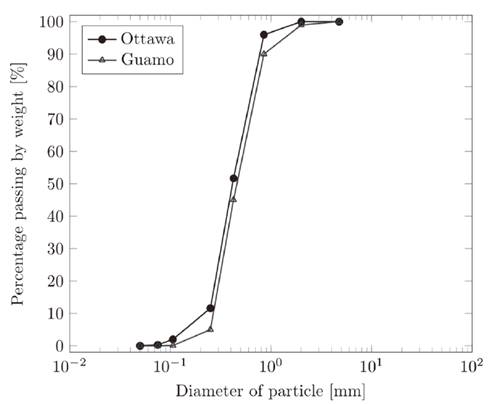
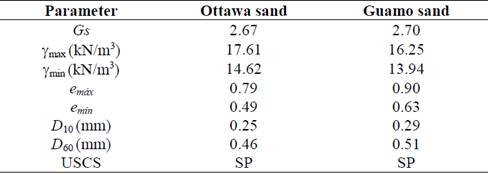
The study was carried out with Ottawa sand and Guamo sand which are both well-known materials in Colombia. Ottawa sand is obtained from Ottawa, Illinois in the United States and has uniform size distribution and is composed of quartz minerals [23]. Guamo sand comes from deposits from the Machín volcano and is acquired in the Luisa River in Tolima, Colombia [24]. Grain size grain distribution was obtained according to ASTM standard procedure D422 [25]. Fig. 1 shows the granulometric curves of both materials. Moreover, Table 1 presents the physical properties and classifications parameters of the sands.
2.2. Equipment
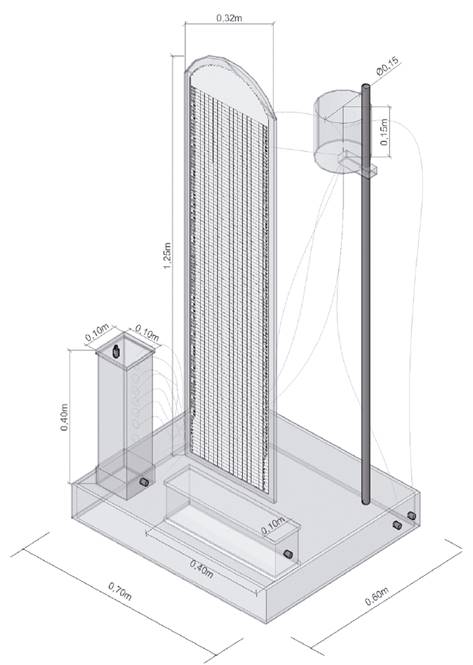
A constant head apparatus was designed and developed on the basis of the apparatus suggested in ASTM standard procedure D2434 [14]. This device is capable of measure hydraulic conductivity of soils for both perpendicular and parallel flow directions of granular soils. In addition, the apparatus was built with two square acrylic permeameters as described in Dulcey et al. [26].
The geometry of the elements was selected in accordance with the sample preparation method. The device’s tubes are 40 cm long, 10 cm high, and 10 cm wide. Each permeameter has seven piezometers with parallel configurations. For each permeameter, piezometer number 1 is connected to the porous stone, piezometers 2 to 4 are connected to the first soil layer and piezometers 5 to 7 are connected to the second soil layer. Fig. 2 presents a schematic view of the physical model.
2.3. Test procedure
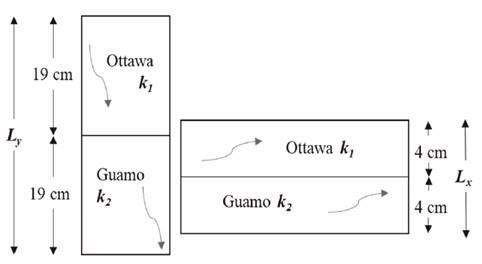
Several soil specimens using Ottawa and Guamo sands were prepared in order to test measurement of hydraulic conductivity by the physical new model. Ottawa and Guamo sands were compacted into two distinct layers with a relative density of 70% in accordance with the procedure proposed by Camacho-Tauta et al. [27]. Each layer had a thickness of 19 cm for perpendicular flows and a thickness of 4 cm for parallel flows.
In addition, k’ was simultaneously evaluated for perpendicular and parallel flow directions. Twenty different specimens, each composed of layers of the two, were compacted inside of each permeameter. The layers were prepared to reach a thickness of 19 cm for the perpendicular direction flow tests and 4 cm for the parallel direction flow test (Fig. 3). Similarly, conventional constant head tests were developed in the model to estimate k values for sandy soils.
3. Results and discussion
3.1. Hydraulic conductivity
Values of k were measured in the laboratory using the physical model, and computation was done according to the method described in ASTM D2434 [14]. Eq. (1) shows the calculation procedure.

where, k is the permeability coefficient (cm/s), Q is the flow rate (cm3/s), L is the infiltration length (cm), A is the cross-sectional area (cm2), t is the measurement time (s), and (h is the difference in head pressure (cm).
Values of k were also estimated through numerical models based on granulometric results and relative density parameters. Eq. (2) proposed by Hazen [28], and eq. (3) proposed by Chapuis [29] were used to compare the experimental results.


where, D 10 is the grain diameter (mm) of particles corresponding to 10% by weight (or mass) of particles passing through a certain sieve opening and e is the void ratio of the material. Table 2 presents the mean values of k obtained by means of tests performed with the apparatus for each sand independently plus the numerical correlations presented previously.
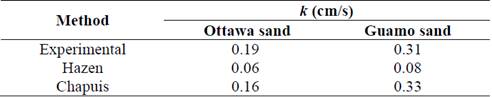
Results indicate that the k values obtained experimentally are within the range of soils classified as SP, according to authors including Bowles [11], Cedergren [12], Warrick [7] and Budhu [13]. However, the values obtained through Hazen’s method are notably different from our experimental results. This is due to the fact that eq. (2) only incorporates one parameter of soil, D 10. Conversely, the outcomes found with the method proposed by Chapuis were very close to our experimental results. This is accounted for by the fact that this method includes a parameter, relative density, which is related to the state of the soil and depends on the void ratio. Ren et al. [30] mention the relationship between hydraulic conductivity and briefly review void ratio in a way that validates the outcomes obtained from the equations proposed by Hazen and Chapuis.
3.2. Equivalent permeability coefficient
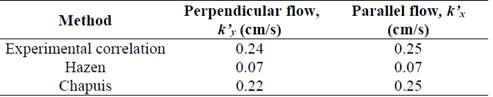
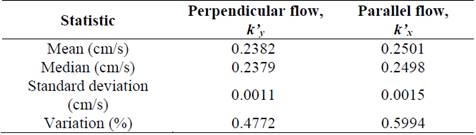
Twenty different two-layered samples of Ottawa sand in the upper layer and Guamo sand in the lower layer were compacted in each permeameter for a total of ten permeability tests. Equivalent values of k’ were measured in perpendicular and parallel flow directions simultaneously. Eq. (4) indicates the computation of the equivalent permeability coefficient in the perpendicular direction ( k’y ), while eq. (5) indicates the equivalent permeability coefficient in the parallel direction ( k’x ). These equations were obtained after taking energy losses of the soil mass in each layer into account [13]. Table 3 shows the mean results of all k’ experimental values and the results obtained from correlations.


Direct measurements were made by determining the differences in hydraulic potentials measured by the piezometers located in distinct layers in both permeameters. Fifty measurements were made in each permeameter. Findings show that the equivalent permeability coefficients differ according to flow direction. This is the result of the sample preparation process in which soil compaction produces a non-isotropic condition that induces modifications of hydraulic conductivity. According to Juárez Badillo & Rico Rodríguez [31], k’x is never equal to k’y in anisotropic soils because of natural processes of stratification plus compacting techniques in horizontal layers.
3.3. Statistical analysis
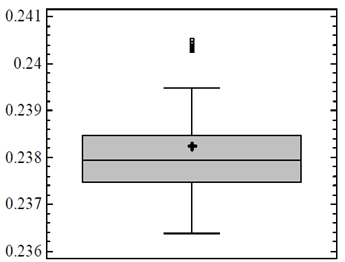
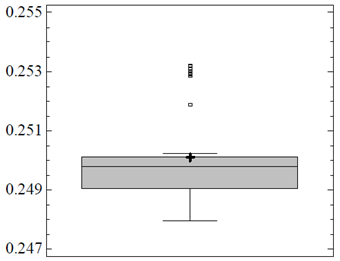
Nevertheless, the results of the twenty tests performed in the physical model presented no relevant variations, and the values of k’ were statistically stable. Computation of the mean and median, both measures of spread, show them to be equal indicating an insignificant amount of variation. Figs. 4-5 illustrates the box plots of the data sets. Table 4 presents the findings from our statistical analysis.
A comparison of the values obtained from Equations (4) and (5) with tests results shows that the relative errors between them are 0.73% for k’y and 0.05% for k’x , assuming that the values obtained from the equations are true.
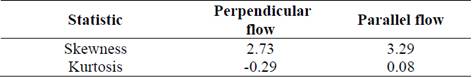
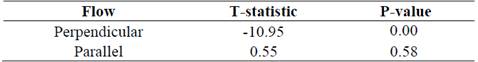
To verify the behavior of the results, a t-test using the null hypothesis in which the experimental coefficient mean values are equal to the mean obtained from eqs. (4)-(5) was performed. Table 5 shows the normality test statistics: skewness presented slightly high values, but kurtosis is acceptable as can be seen in Fig. 6-7.
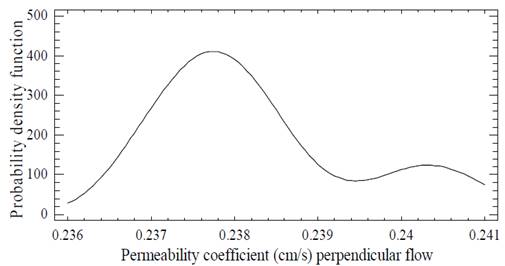
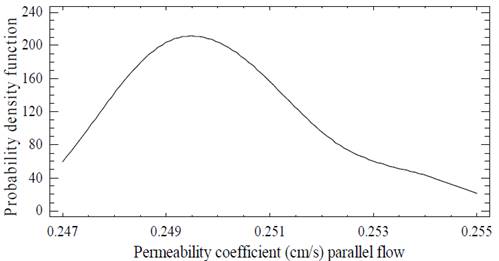
According to [32,33], the t-test is robust to non-normality when sample sizes have more than 30 observations. Due to the previous results and a sample size of 50, normality was assumed. With a 95% confidence level ((=0.05), the t-test could be used to show that experimental correlation results (Eq. 4-5) are close to the mean of the empirical data, particularly for the parallel flow (p-value = 0.58), as shown in Table 6. In the case of perpendicular flow, the null hypothesis is rejected because the empirical value (0.24) is not close to the experimental value of 0.2382 within the range evaluated. However, the relative error between these two values of 0.73% is negligible.
In the same sense, the 95% confidence intervals found for the mean are
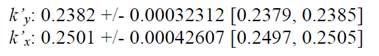
which indicates the accuracy of the experimental procedures.
Based on the results, it is possible to affirm that experimental and empirical values are close and that variation is small. Moreover, the outcomes of the physical model show that the differences between k’y and k’x remain constant throughout the experimental replicas. For all the above reasons, the physical model is capable of replicating seepage in layered granular soils.
4. Conclusions
This paper proposes an alternative physical model for evaluating the hydraulic conductivity of granular materials. This can be used to measure hydraulic conductivity directly and to establish the equivalent permeability coefficient in layered soils, and is therefore capable of replicating seepage as it occurs in the field. The technique has proven to be efficient and relatively easy to apply.
Importantly, this physical model is highly reliable for testing permeability since it generates statistically stable results as evidenced by equality between mean and median values. In addition, the variability of all permeability coefficients (k and k’) was less than 1%. In a physical context, such relative errors do not represent important changes for practical designs, even if the hypothesis of the equal means of the t-test was rejected.
The t-test is a powerful tool for comparing variation in experiments with sample sizes of less than 30 observations. Since this technique also allows evaluation of dispersion of data obtained from experimental procedures, it can contribute to the calibration and implementation of laboratory apparatuses.
Our results show that the equivalent permeability coefficient varies according to flow direction. Data presented higher values for perpendicular flows than for parallel flows due to the sample preparation method. The compaction process induces an anisotropic condition within the granular soil that is reflected in the void distribution, which in turn produces an increase of the flow velocity.
The comparison of numerical methods with experimental techniques demonstrated a clear relationship between experimental correlations (weighted average) and direct measurements. This establishes that the assessment performed with the physical model was adjusted to the postulate of eq. (4)-(5). Nevertheless, the numerical models in this study did present differences with respect to the direct measurements indicating that the parameters of each numerical model must be computed and adjusted according to the soil type.

