


 English (pdf)
 Article in xml format
 Article references
 Send this article by e-mail
 Cited by SciELO
  Cited by Google
  Similars in
SciELO
Similars in
SciELO  Similars in Google
 Permalink
1. Introduction
Conduction of electricity in metallic materials is achieved by means of the movement of a large number of electrons, which easily migrate from one side to another within the material. In ceramic materials, such ease of movement does not exist, as they lack free electrons [1]. However, a current can also be achieved through the displacement of charged carriers like positive ions, negative ions or both [1,2]. In liquid electrolytes both types of ions can move easily. In solid electrolytes, only one type can move while the other maintains the mechanical stability of the material [3,4]. Such materials have very good ionic conduction properties, as well as being safe to work with (low flammability), which is one of the reasons why they have been studied for several decades. Ceramic superionic conductors have been synthesized using well-known techniques such as solid-state reaction, controlled co-precipitation and the polymeric precursor method. A relatively new method of obtention, compared to those mentioned above, is the glass-ceramic technique. This process has several advantages over conventional methods, such as the possibility of maintaining greater control over the microstructure and obtaining materials with low porosity, among others [5]. For the reasons stated above, the main objective of this paper is to show that is possible to obtain lithium ionic conductors using the glass-ceramic method and that their electrical response makes them attractive for applications in secondary batteries.
1.1. Theoretical background
Glass-ceramics are crystalline materials obtained from the controlled crystallization of precursor glasses. The process regularly used to obtain these materials, from the obtention of the amorphous solid to the glass-ceramic, is shown in Fig. 1.
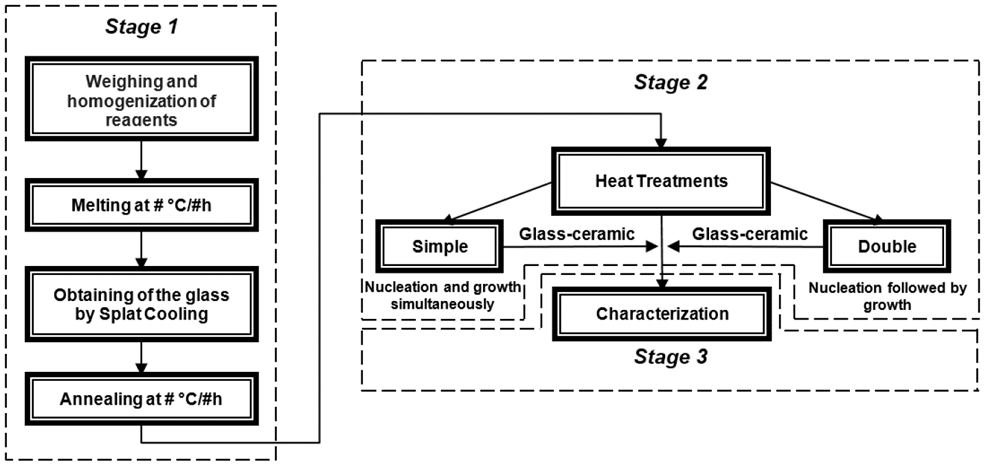
It is possible to observe three stages in Fig. 1. The first corresponds to the obtention of the precursor glass. After the reagents have been weighed and homogenized, they are brought to melting temperature (generally between 1200 °C and 1450 °C), depending on their composition. The mixture is kept at this temperature for about 30 minutes in order to guarantee the complete transformation from the solid phase into the liquid phase. Then the melt is cooled as fast as possible in between two metallic plates (a technique known as Splat Cooling), to avoid the organization of the atoms and, consequently, the crystallization of the material. Subsequently, an annealing heat treatment must be carried out at a heat close to the glass transition temperature ( Tg ), which allows for the release of residual stresses derived from the difference in cooling rates of the surface and the interior of the glass. This heat treatment makes it possible to handle the glass and cut it into small pieces (5 mm x 5 mm). The second stage shows glass-ceramic fabrication, where annealed glasses are subjected to heat treatments which can be single (nucleation and crystal growth occur at the same time) or double (nucleation is accomplished in the first heat treatment and crystal growth in a second one, at a higher temperature). Double heat treatment allows for a better microstructural control over the physical and chemical properties of the glass. Finally, the last stage shown in the flowchart consists of the different techniques used to characterize the glass-ceramics in order to study the microstructure-properties relationship.
The crystallization of glass occurs through a combination of the processes of nucleation and crystal growth. This process can be described by Equation 1, which represents the crystallized volumetric fraction, as follows:

Equation 1 is known as the JMAK equation, named for its developers, Johnson, Mehl, Avrami and Kolmogorov [7]. Where x is the fraction of glass transformed into crystals at a given temperature and time (t), n is Avrami’s coefficient that is associated with both the dimension of the crystal and the nucleation mechanism. Finally, K is a constant of reaction, which has an Arrhenius-type expression, whose activation energy corresponds to the crystallization process. It is worth noting that Avrami’s coefficient may vary between 1 and 4 depending on the crystallization mechanism and morphology of the crystals. A value of 3 may indicate volume crystallization, essential when microstructural control is required. As a consequence, for this last case, a double heat treatment could provide the best results for producing a determined microstructure. Further information can be found in Rodrigues’ paper [7].
The most suitable thermal treatment temperatures for obtaining the glass-ceramic material can be determined through DSC. By means of this technique, endothermic and exothermic peaks are obtained which give a generalized indication of the glass transition ( Tg ) and melting temperatures ( Tm ), and the crystallization temperature ( Tx ) respectively. For example, nucleation is carried out at temperatures below but near to Tg . By varying the time in which the heat treatment is applied, it is possible to control the number of nuclei formed. Crystal growth occurs near Tx , where the time it is heated for plays an important role for crystal size.
2. Materials and methods
2.1. Preparation of the precursor glass
Using a digital scale (Chyo JEX-200) the necessary quantities were weighed to obtain glass of molar composition 16.2Li2O·3.8Al2O3·42.5TiO2·37.5P2O5 or Li1.3Al0.3Ti1.7(PO4)3. High purity reagents, Li2CO3 (Synth-C1006.01.AE 99%), Al2O3 (Pc Alcoa A16 >99.5%), TiO2 (Aldrich-CAS 1317-80-2 >99.9%) and NH4H2PO4 (Aldrich-7722-76-1 >98%), were disaggregated in a mortar and then mixed. The mixture was placed into an alumina crucible and heated in a Bloomfield N.J., CM Inc furnace using different programs. The first ramp, at 10 °C/min, was at a temperature of 700 °C for 60 min to allow the decomposition of Li2CO3 and NH4H2PO4. The next ramp, heated at the same rate, was at 1400 °C for 30 min to allow the complete melting of the mixture. The molten liquid was rapidly cooled using the Splat Cooling method and immediately subjected to thermal annealing treatment at 550 °C (approximately 70 °C below Tg ) for 2 hours and, subsequently, cooled in the furnace at its normal cooling rate. To perform the corresponding analysis, 3 mm cubes were cut using a fine diamond saw. Both a solid and a powder sample were subjected to a DSC (DSC 404 NETZSCH) scan at a rate of 10 °C/min in order to determine firstly, the obtention of the amorphous material, secondly, to ascertain the characteristic temperatures of the glass and thirdly, to demonstrate crystallization, specifically the volumetric crystallization of the materials.
2.2. Preparation of the glass-ceramics
Two types of thermal treatments were used, one simple and one double, in order to determine their influence on the microstructure and, consequently, the electrical properties of the glass-ceramics. Simple treatments were performed above Tx , that is, at 700 °C, 800 °C, 900 °C and 1000 °C for 20 min. For double heat treatments a nucleation treatment was performed at 606 °C ( Tg - 10 °C) for 10 min, 30 min, 120 min and 480 min, followed by a treatment for crystal growth at 900 °C for 20 min. These treatments were carried out in tubular furnaces which were previously stabilized at the set temperatures. After this process, the samples were sanded (from sandpaper grit size 100 up to 1200) and then polished with cerium oxide to obtain smooth and level surfaces.
2.3. Characterization of the glass-ceramics
XRD was carried out in order to verify that the NASICON-type phase ( Na-SuperIonic CONductor ) of the lithium-based super-ionic glass-ceramics had been obtained. A Siemens diffractometer with CuKα radiation was used. The data was taken from samples in powder form in a glass sample holder at room temperature, with 2θ varying from 5 to 80°, using an angular step size of 0.02° and counting time of 1 s. Peaks were indexed using the software Search Match®. The microstructural characteristics, morphology and grain size were analyzed by SEM, using a Philips XL 30 Scanning Electron Microscope with a field emission gun (FEG - Field Emission Gun). For the SEM study, the fractured surface was coated with gold, using a sputtering technique. The DeHoff methodology was used to perform the calculations of average grain size [8]. The electrical response was studied using IS, using a Solartron 1260 Impedance/Gain Phase Analyzer in a frequency range from 10 Hz to 10 MHz, with a voltage of 1000 mV, from 18 °C (room temperature) up to 64 °C. The surfaces of these samples were also gold coated by sputtering so that they acted as contact electrodes. Results were analyzed by calculating the total impedance of the system. Five impedance spectra were taken for each sample at 10 °C intervals in the aforementioned temperature range. The total resistance was taken at Z’’ = 0 and the conductivity was calculated (σ=1/ρ), where ρ is the resistivity. Finally, the logarithm of the conductivity as a function of the inverse of the temperature was plotted, resulting in a straight line whose slope provides information about the activation energy for lithium ion conduction and, therefore, about the mechanisms of ionic conduction. It should be noted that the plotted data was multiplied by the geometrical parameter of the samples.
3. Results and discussion
3.1. Precursor glass
The prepared glass showed a strong tendency to crystallize, so it became necessary to pour smaller amounts of the molten liquid to improve heat dissipation and avoid crystallization. Curves obtained by calorimeter are shown in Fig. 2.
Source: The authors.
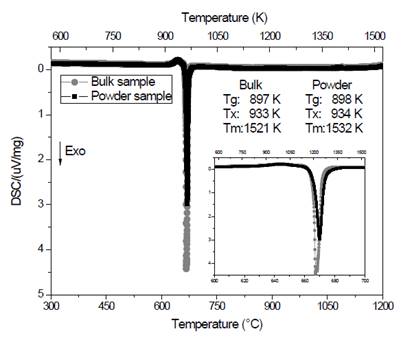
Figure 2 Curves obtained by DSC at 10 °C/min for vitreous samples, solid and powder, of composition Li1.3Al0.3Ti1.7(PO4)3.
Fig. 2 shows the obtained curve for the bulk sample (circles). It is possible to see a slight deviation of the baseline around 620 °C (897 K), attributed to the glass transition temperature, T g . An exothermic peak can be observed at about 660 °C (933 K) which corresponds to the crystallization temperature (T x ) of the material and, finally, close to 1250 °C (1521 K) an endothermic peak shows the beginning of the melting temperature (T m ). The curve of the powder material (squares), behaves quite similarly to that described above. The fact that these two curves are similar (see inset) is a clear indication that the crystallization of the material is taking place volumetrically [9,10]. If the crystallization was predominantly superficial, the crystallization peak of the powder sample (which has a greater surface area) would occur earlier than that shown by the bulk sample. This behavior has been observed in another system [11] and it may be explained by considering that during the milling process the powder surface is hydrated and this inhibits crystallization [11]. It should be noted that volumetric crystallization is important because it allows greater control of the microstructure through double heat treatments [12]. Other conclusions that can be established from the analysis of these curves are those related to thermal stability parameters [13]. It is evident that the difference between the crystallization temperature and the glass transition temperature is small (36 °C), which indicates a high tendency to crystallize [7,9,10]. This coincides with what was observed during the experimental stage, since the molten liquid tended to crystallize rapidly when it was poured. On the other hand, the reduced glass transition temperature (T gr ), which is the ratio between T g and T m , is an indication of volumetric nucleation, as long as it is less than or equal to 0.6 [9,14,15], in this case T gr = 0.589. This parameter is important to be able to have microstructural control.
3.2. Glass-ceramics obtained by simple heat treatment
The X-ray diffractograms of the samples obtained by simple heat treatment are shown in the Fig. 3.
Source: The authors.
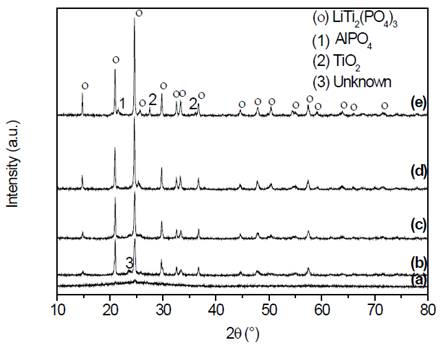
Figure 3 X-ray diffractograms of samples of composition Li1.3Al0.3Ti1.7(PO4)3, (a) precursor glass, and glass-ceramics obtained by simple heat treatment at (b) 700 °C, (c) 800 °C, (d) 900 °C and (e) 1000 °C, for 20 min.
In Fig. 3 (a) the diffraction pattern of the bulk sample, obtained after the annealing process, can be observed. It is a pattern that does not have any diffraction peak and presents a deviation in the baseline between 20°≤2θ≤30° which is known as an amorphous halo, which is distinctive to glass [16]. This coincides with the DSC results that showed satisfactory obtention of the precursor glass. Fig. 3 (b) shows a diffraction pattern, whose principal and most intense peaks correspond to the highly conductive phase with NASICON-type structure -LiTi2P3O12 (JCPDS 35-754) [17-21], in which aluminum is in solid solution in the unit cell, however, a trace of an unidentified phase is also observed, which was also reported by Fu [19,22]. Figs. 3 (c) and (d) also show the presence of the NASICON phase, with an increase in the intensity of the peaks, in addition, in Fig. 3 (c) it is still possible to see traces of the unidentified phase that disappear in Fig. 3 (d). Finally, Fig. 3 (e) shows, besides the NASICON phase, spurious phases such as TiO2 and AlPO4, as well as a more intense peak corresponding to the phase of interest. Taking into account that both the conditions of the equipment and sample conditions were maintained throughout, it is reasonable to conclude that the higher the heat treatment temperature, the more intense the peaks of the main phase are and the narrower the width of the peaks at half height (quantitative data provided by the analysis software Origin®, not shown in this paper). It suggests a better crystallinity (major structural order) of the unit cells and therefore of the glass-ceramics. Other authors have also reported impurities as those found in this study [23,24]. These spurious phases are dielectric and may block the movement of the charge carriers, although they could also provide low energy paths for charge transport [24]. Subsequent to the X-ray diffraction analysis, the samples were visualized by scanning electron microscopy, the micrographs are presented in Fig. 4.

Source: The authors.
Figure 4 Micrographs obtained by SEM of the fractured surface of glass-ceramics of composition Li1.3Al0.3Ti1.7(PO4)3 treated at (a) 700 °C, (b) 800 °C, (c) 900 °C y (d) 1000 °C, for 20 min.
Although it was mentioned before that the glass-ceramic method allows the obtention of non-porous materials, in the micrograph shown in Fig. 4 (a) pores are visible in the microstructure, possibly due to differences in density between the vitreous matrix and crystals. In Figs. 4 (b) and (c) microstructures consisting of fine and uniform grains are observed and no porosity is evident. Finally, in Fig. 4 (d) grain growth is observed as the temperature is raised. It can be understood from a thermodynamic perspective, since at high temperatures diffusive processes accelerate. The characteristics observed in the micrographs are consistent with the X-ray results, showing that when heat treatment temperature is increased, a more ordered and homogeneous microstructure is observed, which is directly tied to both the increase in the intensity of the peaks and their decrease in width at half height. It is worth mentioning that microstructural aspects such as grain size, porosity, morphology and grain boundaries, among other aspects, directly influence the properties of materials [25], in this case the electrical properties. The average grain size, measured as suggested by DeHoff [8], ranges between 100 nm and 400 nm when the heat treatment temperature is increased from 700 °C to 1000 °C.
Electrical characterization by impedance spectroscopy allowed the drafting of Arrhenius plots, taking the total electrical resistance of each sample. The behavior of conductivity as a function of inverse of temperature is shown in Fig. 5.
Source: The authors.
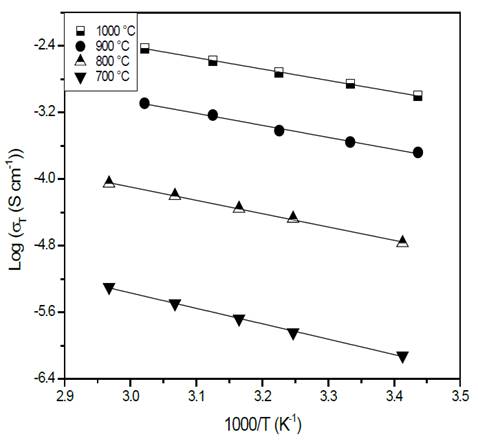
Figure 5 Characteristic Arrhenius plots of glass-ceramics of composition Li1.3Al0.3Ti1.7(PO4)3 obtained by simple heat treatment.
Fig. 5 shows a plot of the logarithm of the conductivity as a function of the inverse of temperature. In the temperature range used for measuring (18 °C - 64 °C), it is possible to see that the slope of the straight lines does not change, which suggests that the conduction mechanism is the same [26]. It is also evident that the greater the heat treatment temperature, the greater the conductivity at a given temperature, which means that the thermal treatment influences the glass-ceramics’ conductivity positively [22,27]. This observation is in agreement with the XRD results, indicating that a sample’s crystallinity (structural order) is favored by a high heat treatment temperature which improves its electrical properties. In fact, the increase in crystallinity can be understood as an alignment of the conduction channels through the highly conductive structure [22,27]. The electrical properties of the glass-ceramics are summarized in Table 1.
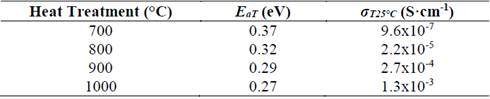
Table 1 Electrical properties of glass-ceramics of composition Li1.3Al0.3Ti1.7(PO4)3 obtained by simple heat treatment, where E aT is the total activation energy and σ T25°C is the total conductivity at room temperature.
Source: The authors.
A decrease in activation energy while the temperature of the thermal heat treatment increased is evidenced in Table 1. This statement can also be explained by the idea of higher-order structure. Sample heat treated at 700 °C presents a very low conductivity (10-7 S/cm), even when at this temperature the NASICON-type structure has already been formed, see Fig. 3 (b). This fact could be closely related to the porosity seen in the sample, see Fig. 4 (a), therefore it can be concluded that porosity has a direct and negative effect on electrical conductivity [28,29]. The sample with the highest electrical conductivity (10-3 S/cm) was treated at 1000 °C for 20 min, this behavior is attributed to microstructure’s homogeneity, better crystallinity and lower porosity when compared with the other samples with naked eye.
3.3. Glass-ceramics obtained by double heat treatment
These glass-ceramics were obtained by performing a nucleation heat treatment at 606 °C (T g - 10 °C) for 10 min, 30 min, 120 min and 480 min, followed by a heat treatment for crystal growth at 900 °C for 20 min.
Samples obtained by double heat treatments were also characterized by x-ray diffraction. The results are shown in Fig. 6.
Source: The authors.
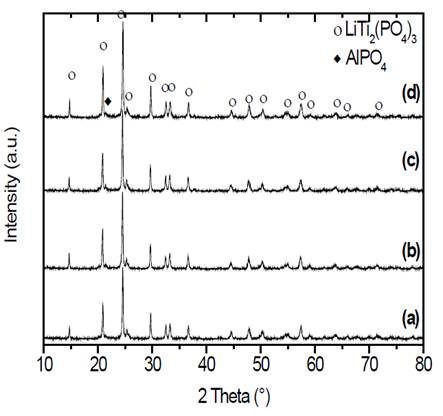
Figure 6 X-ray diffraction patterns of samples of composition Li1.3Al0.3Ti1.7(PO4)3 obtained by double heat treatment. Nucleation at 606 °C (T g - 10 °C) during (a) 10, (b) 30, (c) 120 and (d) 480 min, with subsequent thermal treatment for crystal growth at 900 °C for 20 min.
X-ray diffraction patterns presented in Fig. 6 show, in all cases, peaks corresponding to the highly conductive phase that has a NASICON-type structure. It is important to add that in all glass-ceramics, small impurities of the compound AlPO4 can be found [30,31]. If we compare the diffraction patterns of the double heat-treated samples with the patterns obtained at the same temperature using the simple heat treatment in Fig. 3 (d), it can be seen that in both cases well defined diffraction peaks are obtained.
After determining the different phases present in these double heat-treated glass-ceramics, their fractured surfaces were analyzed using scanning electron microscopy. Images can be seen in Fig. 7.
Source: The authors.
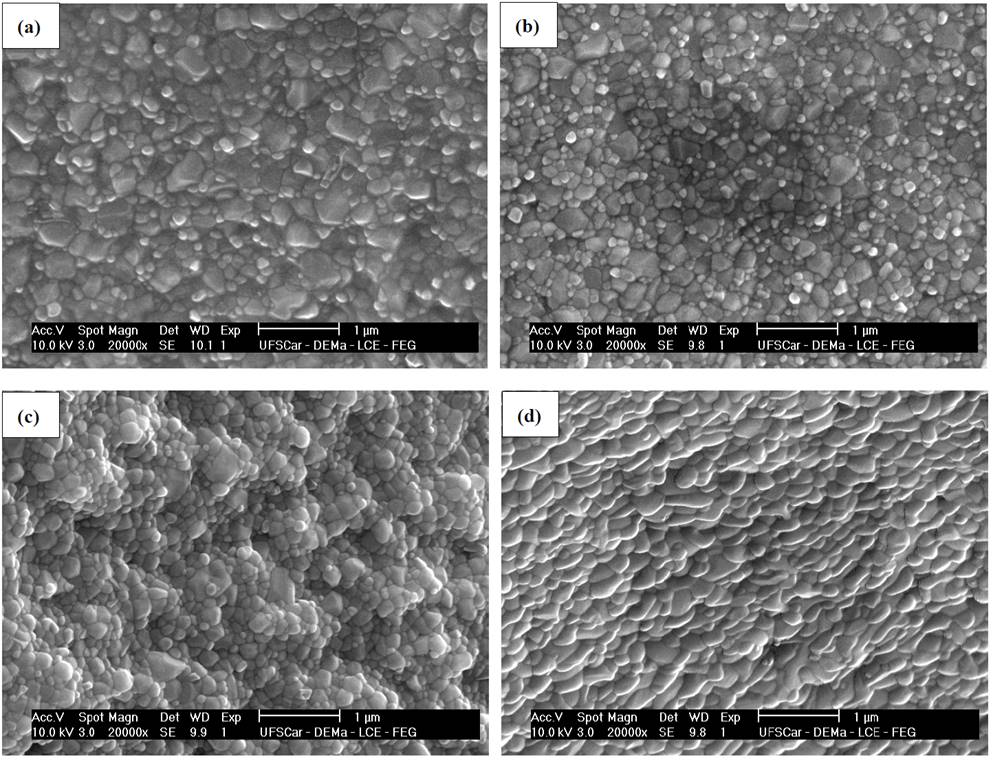
Figure 7 Micrographs obtained by SEM of the fractured surface of glass-ceramics of composition Li1.3Al0.3Ti1.7(PO4)3 treated at 606 °C (Tg - 10 °C) during (a) 10, (b) 30, (c) 120 and (d) 480 min, followed by crystal growth heat treatment at 900 °C for 20 min.
Fig. 7 presents the microstructure of the glass-ceramics obtained by double heat treatment. The examination of the micrographs allows to see that the morphology is, in general, composed of spherical grains. There is no evidence of porosity and the average grain size, measured using the procedure proposed by DeHoff [8], increases from 100 nm to 180 nm, when nucleation time decreases from 480 min to 10 min respectively. This behavior is expected if it is taken into account that the higher the nucleation time (for example 480 min) the higher the number of formed nuclei and, therefore, the less space they have to grow, resulting in a microstructure composed of small grains (for example 100 nm).
As a summary of the effects on the microstructure, in Fig. 8 (a) and (b) is possible to see the variation of grain size as a function of the simple and double heat treatments more clearly.
Source: The authors.
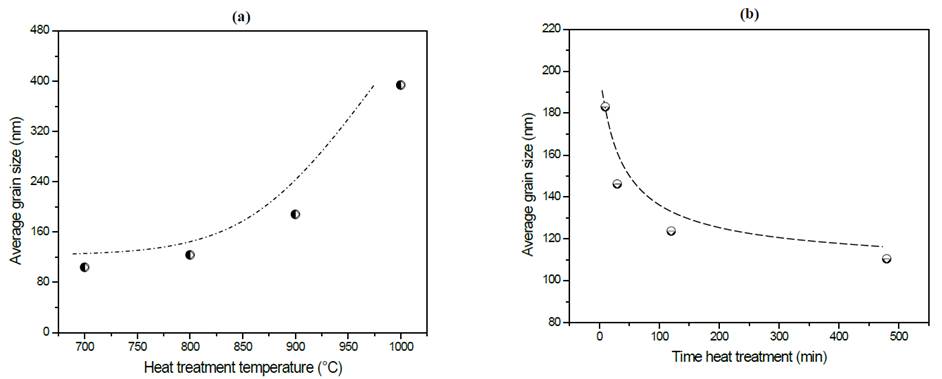
Figure 8 Variation of average grain size of glass-ceramics of composition Li1.3Al0.3Ti1.7(PO4)3 as a function of thermal heat treatment (a) simple and (b) double. Dotted lines do not correspond to a curve-fitting of the data but it serves as a visual guide for readers to follow.
By comparing Figs. 8 (a) and (b), it is possible to observe that a wider range of grain sizes (80 nm - 400 nm) were obtained using the simple heat treatment than the double heat treatment (110 nm - 190 nm), with increased grain size strongly linked to heat treatment temperature, see Fig. 8 (a). This behavior can be explained from a thermodynamic perspective because at higher temperatures, diffusional processes become more effective and, consequently, crystal growth takes place more rapidly. This fact is more evident in the samples exposed to the simple heat treatment in which athermic nuclei grew while the liquid cooled [10,15]. In Fig. 8 (b) there is a clear trend that can be observed showing that grain size decreases as nucleation time increases.
Finally, glass-ceramics were analyzed using impedance spectroscopy method. Arrhenius-type plots are shown in Fig. 9.
Source: The authors.
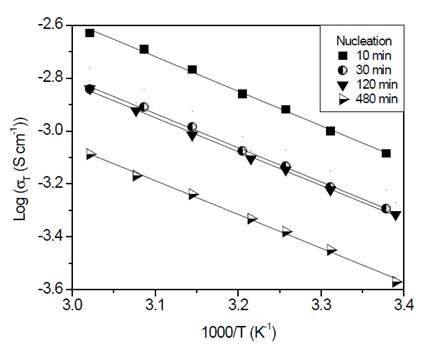
Figure 9 Arrhenius plots corresponding to glass-ceramics of composition Li1.3Al0.3Ti1.7(PO4)3 obtained by double heat treatment. Nucleation at 606 °C (T g - 10 °C) during 10, 30, 120 and 480 min, followed by crystal growth heat treatment at 900 °C for 20 min.
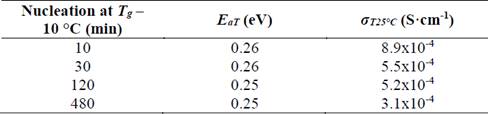
As shown in Fig. 9, the behavior corresponds to an Arrhenius type whose slope does not change in the measured range. As mentioned before, when analyzing glass-ceramics obtained through simple heat treatment, it is apparent that the conduction mechanisms do not change in the studied range [26]. In Table 2, it is shown that activation energy values and total conductivity at room temperature for these glass-ceramics are resumed.
Table 2 Electrical properties of glass-ceramics of composition Li1.3Al0.3Ti1.7(PO4)3 obtained by double heat treatment, where E aT is the total activation energy and σ T25°C is the total conductivity at room temperature.
Source: The authors.
It is noticeable in Table 2 that activation energy is essentially constant, while electrical conductivity shows a tendency to decrease while increasing nucleation time. As already mentioned, the higher the nucleation time the higher the number of formed nuclei, subsequently, these nuclei will have less space to grow, which leads to a small grain microstructure. In fact, Fig. 8 (b) shows that grain size decreases from 190 nm down to 110 nm as the nucleation time increases, thus, it results in a greater number of grain boundaries (disordered region) that negatively affect the total conductivity of the glass-ceramics. However, if these samples are compared with the sample obtained at 900 °C by simple heat treatment, is clear that the latter presents a higher activation energy and lower conductivity, which suggests that the double heat treatment favors the electrical properties somehow. One way of understanding this is to think of the grains in tighter contact, which favors the conductivity of the material, as suggested by Fu [32].
4. Conclusions
The glass-ceramic method proved to be a useful and versatile alternative for obtaining lithium ion conductors. The composition of the glass-ceramic used revealed a strong tendency to crystallize, which was proved by means of thermal stability parameters, since the difference between the crystallization temperature and the glass transition temperature was small (36 °C). However, it was possible to obtain glass-ceramics using two types of heat treatment, one simple and one double, which had an influence on the microstructure of the glass-ceramics, as well as on their electrical response. The calculation of the reduced glass transition temperature (T gr ) showed that the glass tended to crystallize volumetrically, a fact that allowed for a better control of the microstructure of the samples obtained using the double heat treatment. The highest value of conductivity was obtained for the glass-ceramics treated at 1000 °C/20 min, of the order of 10-3 S·cm-1, while the lowest value was of the order of 10-7 S·cm-1, for the glass-ceramic obtained at 700 °C/20 min. Taking into account the previous values of conductivity and that in both cases the NASICON-type structure was obtained (evidenced by XRD), it was concluded that the microstructure of glass-ceramics plays a very important role in its electrical properties. In fact, high values of conductivity were related to non-porous and highly homogeneous microstructures, while low values of conductivity are related to porosity (see Fig. 4 (a)) and poorly aligned microstructures. In the case of glass-ceramics obtained by double heat treatment it was observed that where there was a longer nucleation time, there was also a smaller grain size and in turn lower electrical conductivity. This behavior can be understood as follows: smaller grain size implies greater number of grain boundaries (regions of microstructural disorder), which negatively affect the conductivity of the samples.

