


 English (pdf)
 Article in xml format
 Article references
 Send this article by e-mail
 Cited by SciELO
  Cited by Google
  Similars in
SciELO
Similars in
SciELO  Similars in Google
 Permalink
1. Introduction
Root-type piles were created in the 1950's when Fernando Lizzi, an Italian engineer, developed an innovative process to manufacture grouted piles named root piles (Pile Radice). Because of their differentiated execution process, this type of piles has advantages over other existing excavation processes, depending on the local conditions and on the peculiarities of the soil where the piles are to be executed.
Several authors have reported improved performance of deep foundations via tip grouting in comparison to conventional means of perforation installed in similar conditions [1-4].
Laboratory tests have shown that the stress vs. strain behavior of sands is highly nonlinear, even at stresses well below the maximum strength of sand. On the other hand, at the start of loadings, rigidity is characterized by the shear modulus of 'little strain' ( G 0 ), characterizing an apparent linear behavior. [5].
According to [6,7], the pre-rupture behavior of sand can be represented by a hyperbolic model, with prevalence of nonlinear behavior and the following parameters: strain modulus (𝐸) and shear modulus (𝐺).
Outside the region with elastic behavior, as shear stress builds up to rupture, rigidity is a function of the level of shear stress. Therefore, it cannot be characterized by one single value of modulus of elastic shear, although in many cases a reasonable stress modulus can be obtained by selecting a value of appropriate secant shear modulus [5].
This way, the predictive methods used in this article are based on the hyperbolic stress / strain ratio of [8].
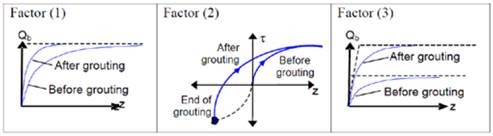
According to [9], due to the executive process of the root pile, the effects that grouting produces on the soil, around and under the drilled bore are still under research; however, three factors are considered to control the soil - foundation interaction, as follows:
Compression of the soil beneath the pile;
Redistribution of residual stresses along the shaft due to the ascending mobilization during grouting; and
Increase in the area of the tip of the stack due to formation of the grout bulb. These effects are summarized in Fig. 1.
Based on the complexity of the model to predict settlements in deep foundations, as well as the effects of the executive process of root-type piles, this work has been developed to assess two nonlinear methods to predict the load vs. displacement curve of a 23-m long, 0.31-m diameter root pile, compression loaded and instrumented in depth with strain gages.
2. Prediction of Settlement
It is common practice to use a wide range of methods to predict the behavior of the admissible pile settlement, since sometimes no experimental results of load tests are available to make this critical task easier. Therefore, two methods of prediction are described, which take into account the effect of nonlinearity of the stress vs. strain behavior of foundation elements of piles.
2.1. Verbrugge’s method (1986)
The Verbrugge’s Method shows that the load vs. settlement behavior of a pile foundation depends primarily on the load transfer mechanism at the contact between the soil and the pile shaft and also on the propagation of these loads to the soil surrounding the pile. It is necessary to estimate the rupture load in order to apply this method. To do so, [10] suggests using the method of [11].
As set by [12,13], the ratio between stress and settlement at a spot of the pile can be successfully obtained by means of Equation (1).

Where:
w0 = settlement at the spot;
E0 = soil strain modulus beneath the spot in consideration;
(= axis coefficient (circular pile = 1, and square pile = 1.12);
R is spot coefficient (round pile = 0.32, and pile with broad base = 0.25);
σ0 = stress in the soil / pile interface.
[10] proposes Equation (2) to calculate the strain modulus of the soil from the values of the cone test (CPT).

The shear stress, (i, is calculated via Equation (3). In this equation, the values found must respect the criterion set in Equation (4), as proposed by [10].


Where:
τi - Mobilization of the soil - axis friction;
Ei - Strain modulus of the soil around element i;
D - Pile diameter;
w(i=1) - Vertical displacement to the lowest face of element i;
B - Axis coefficient obtained by [14].
In order to estimate 𝑓 𝑠𝑖 , the proposal of [11] is used per Equation (5).

Where:
αf - Philipponnat factor, which depends on the type of pile;
qci - Value of qc for layer i;
αs - Depends on the type of soil;
2.2. t-z Curve
This method models soil resistance through surface friction using a nonlinear spring (t-z of the spring), and the pile tip resistance using a nonlinear spring (Qb-z of the spring) as shown in Fig. 2. The appropriate load transfer curves (t-z and Qb-z curves) are critical in this method to get appropriate estimates of settlements and load transfer to individual axially loaded piles.
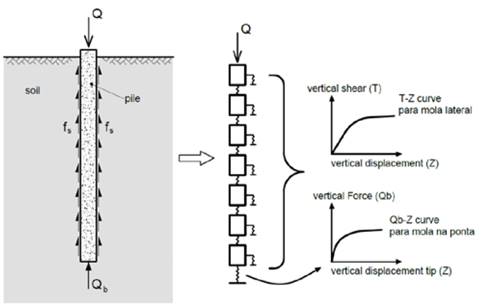
Such load transfer curves can be obtained either empirically or theoretically by using initial shear rigidity (resistance) of low effort of the soil around the pile. [15].
According to [15], the asymptotic values required to determine the load transfer curves can be calculated via CPT tests using the LCPC method. The proposed methodology includes soil nonlinearity using a modified hyperbolic model of the type proposed by [5]. The model adopted for analysis is similar to the one proposed by [16] (Fig. 3).
According to [15], using this hyperbolic model is required to be incorporated to the quick reduction of the secant shear modulus, when very low values of effort of 𝐺 0 of measurements of seismic CPT are used as initial reference. The predictions of pile settlements employing this method are then compared to the results of the load test. Still according to the authors, the prediction of pile settlement using the proposed theoretical approach and the data from the seismic CPT are in conformance with the static load tests.
The authors make two considerations to calculate settlement: the first one is an approach to soils of elastic-linear behavior; the second one considers soil nonlinearity, which is closer to the actual behavior.
Case 1: Load transfer curves for elastic-linear behavior soils.
The load transfer curve for the pile tip can be approximated using Boussinesq's solution, Equation (6), for a rigid base which is supported in an elastic medium [18]:

Where:
Qbase = load applied to the pile tip;
G = Soil shear strength modulus;
r0 = pile radius;
ν = Poisson's ratio of the soil.
The pile shaft settlement, Z, as originally proposed by [16], is obtained by supposing an elastic linear soil with no radial variation of G, as per Equation (7).

Where:
rm = radial distance in which the shearing in the soil around the pile shaft becomes insignificant;
τ0 = initial shear stress of the soil. [16] propose to estimate r m using Equation (8).

Where:
r = factor of homogeneity of the soil shear stress;
lp = pile embedding depth;
ν = Poisson's ratio of the soil.
Case 2: Load transfer curves for soils with nonlinear behavior.
According to the authors, it is of great importance to get parameters to be used in the formulations correctly. The initial shear modulus ( 𝐺 0 ) can be obtained in situ by means of Equation (9).

Where:
ρ = specific soil mass;
Vs= speed of the shear wave obtained from seismic refraction tests.
It must be pointed out that the values of the modulus of neighboring piles will be affected by the process of installation of a pile, and such effects are hard to be quantified. However, they are considered less important than the nonlinear ones and generally smaller when compared to the uncertainties involved in the estimation of soil properties [18,19].
Soil nonlinearity is an important factor to be analyzed to correctly predict the behavior of the load transfer curve.
The hyperbolic models of stress vs. strain shear are used to suitably represent the nonlinear behavior of soils [8, 20, 21], according to Equation (10).

Where:
γ = strain by the shearing agent;
G0 = tangent initial shear modulus;
τult = ultimate shear stress, i.e., the stress in which strains tends to infinite.
[22] report the ratio between the asymptotic value of 𝜏 𝑢𝑙𝑡 and the maximum shear stress, 𝜏 𝑚a𝑥 , as per Equation (11).
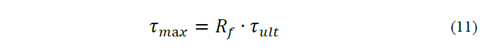
Where:
Rf = rupture ratio (≤1).
By replacing Equation 11 in 10, we get Equation (12) for secant shear modulus:

Same as the procedure in case 1, Equation (13) can be used to calculate the settlement of the pile axis.
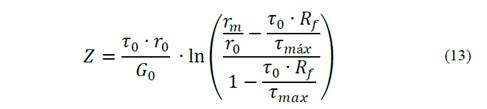
The initial rigidity ( 𝐺 0 ) of Equation (13) comes from the elastic linear behavior of the t-z curve when 𝑅 𝑓 =0, resulting in Equation (14).

Where:
f and g = empirical parameters (f=0.98 and g=0.3).
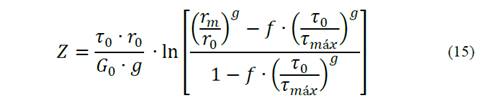
The methodology proposed by [15] to assess the supporting capacity is based on an approach of load transfer that models the quick nonlinear degradation of soil rigidity in small strains using a modified hyperbolic model such as the one proposed by [5], resulting in Equation (15).
First of all, the value of 𝐾 0 must be calculated from Equation (16) for the behavior of the base.

When the rigidity coefficient of the spring (representing the soil) is degraded at the pile tip, it can be corrected by Equation (17) as reported by [23].

After getting the parameters and variables, the following step is the calculation of the settlement of the pile tip as expressed in Equation (18).

The key contribution of this method is that it improves the perception of soil nonlinearity when the initial shear modulus with very low strength is used as the initial reference. Another advantage of this method is the use of the CPT data, which is a common test in geotechnics, and this expands the applicability of this method.
3. Material and methods
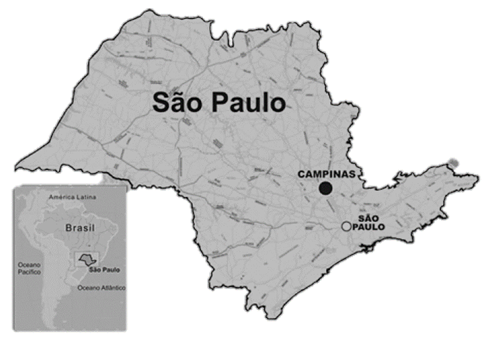
The research was developed at the Experimental Field of Mechanics of Soils and Foundations of the State University of Campinas (Unicamp), located at Zeferino Vaz University City in Barão Geraldo district, Northwest region of Campinas, as shown in Fig. 4.
The profile of the Experimental Field is composed of diabase soil with a 6.5-m thick surface layer consisting of highly porous silty-sandy clay (colluvial) followed by a layer of clayey-sandy silt (diabase residue) down to 20m. The water level is found only at 17-m depth depending on the season of the year.
Several field tests have already been conducted at the site, such as: Standard Penetration Test SPT and SPT-T, CPT, Crosshole, DMT, PMT, refraction seismic, vertical electrical probing and laboratory tests.
The first layer is composed by mature soil (lateritic and collapsible), which has undergone intense weathering and lixiviation processes. These processes caused an increase in porosity due to fines being carried to the deeper horizon, thus providing the emergence of a soil with void indexes of approximately 1.8. This layer has values of indexes of resistance to penetration 𝑁 𝑆𝑃𝑇 ≤5. The second layer is composed of recent residual soil that preserves characteristics from its origin rock, with values of indexes of void equal to 1.5. Some of the characteristics of resistance obtained for this layer are 𝑁 𝑆𝑃𝑇 ≤35.
The values for lateral friction ( 𝑓 𝑠 ) and tip resistance ( 𝑞 𝑐 ) collected in the Cone Penetration Test (CPT) are shown in the graph of Fig. 5. The massif was prospected down to the depth of 27 m.
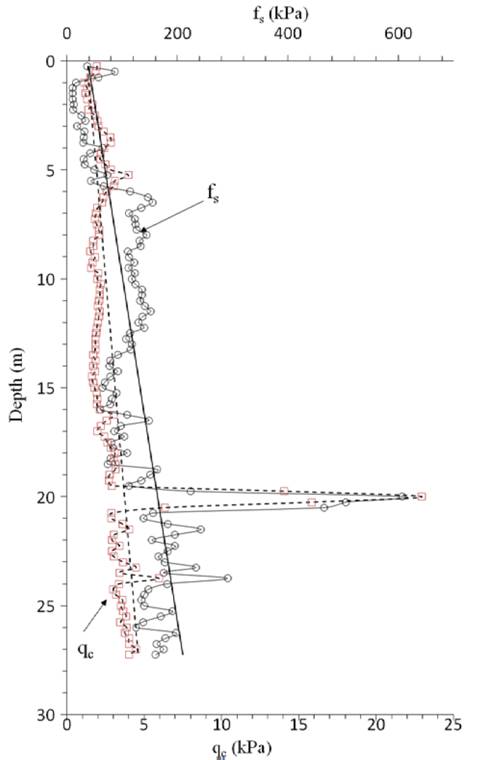
In means terms of lateral friction ( 𝑓 𝑠 ) and tip resistance ( 𝑞 𝑐 ), Equation (19) and Equation (20), respectively, were obtained. The values obtained with these equations are expressed in kPa.


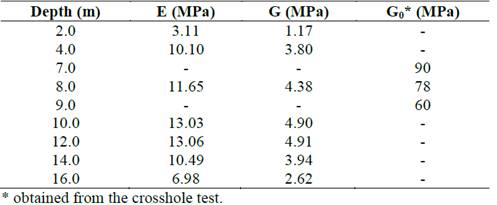
The values of the moduli of strain (E), shear (G) and initial shear ( G 0 ) were obtained from former studies conducted by [25], as shown in Table 1.
The pile tested was of the root type with a 0.31-cm diameter and 23 meters long. It was instrumented along the shaft so as to obtain the load transfer curve between soil layers.
The load test was taken to the limit of the reaction system (2000 kN). The load increments and respective vertical displacements produced the load vs. displacement curve for the tested pile, as shown in Fig. 6.
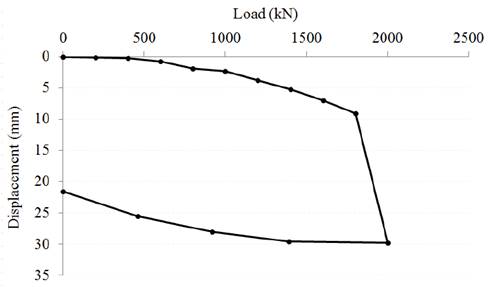
The maximum displacement observed was 30 mm for the maximum test load of 2,000 kN. It must be pointed out that this is not the rupture load, since no geotechnical or structural rupture of the foundation element was observed. When the method of [26] modified by [27] is applied, the pile rupture load is approximately 2,010 kN, whereas the rigidity method proposed by [28,29] provides a load of 2,140 kN. Based on the results obtained with the methodologies, the conclusion is that the load test was taken to displacements that characterize values close to the geotechnical rupture load of the pile.
The stress vs. strain behavior for the respective instrumentation levels was obtained from the instrumentation readings, as shown in Fig. 7.
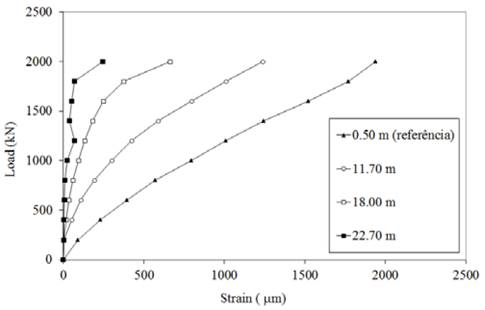
An analysis of the instrumentation data of the reference section produced a pile strain modulus of 33.4 GPa, which showed that the instrumentation behaved appropriately, i.e., the strains were coherent with the depth of the installation.
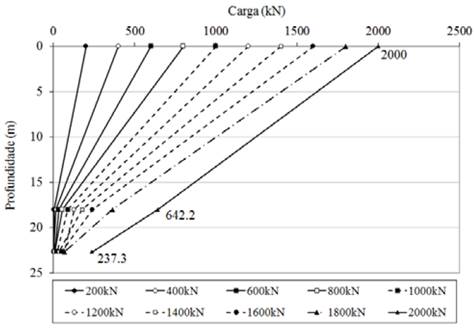
The data obtained from the instrumentation produced the load transfer curves in depth (Fig. 8). In the figure, the values of the portion relating to tip resistance are 237 kN (11.9%) and 19 kN (1.9%) for the maximum load (Qmax), and work load (Qtrab), respectively. The observation is that the tip portion, under the action of the maximum load, is 12.4 larger in comparison to the tip mobilization upon action of the work load, whereas the work load is half the maximum load.
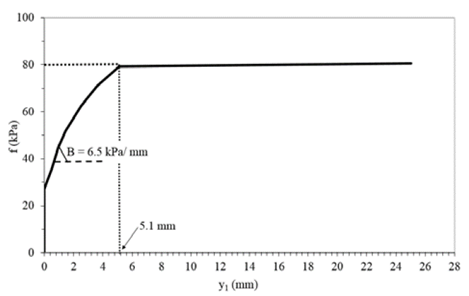
As to the First Law of Cambefort, as shown in Fig. 9, the saturation of lateral friction was found to be 80 kPa. The shaft had a displacement in the order of 5.1 mm (y1), which means 1.6 % of the pile diameter, to show that small displacements were required for full mobilization of friction. The Cambefort Parameter (B) referring to the inclination of the straight line of the model was approximately 6.5 kPa/mm, which produced the rigidity of the pile (Kr= 109 kN/mm) and relative rigidity between the pile - soil (friction) of the order of 0.13 (k). It must be noted that, as this is the first load, there is no residual load Ph=0 and (=1
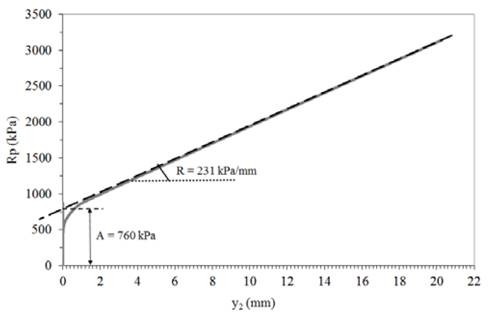
An analysis of Fig. 10 referring to the pile tip reaction showed that there is a linear increase in reaction as the tests advances. The analysis also showed that parameter A is approximately 760 kPa; the pile tip rigidity is 231 kPa/mm. This indicates a rigid elastoplastic behavior for the soil of the pile tip, which means that the tip reacts significantly with small displacements [30].
Particularly by means of application of Cambefort's Laws and the shape of the load transfer, the lateral friction was completely saturated along the pile length. Part of the tip resistance is mobilized as a function of the load increments.
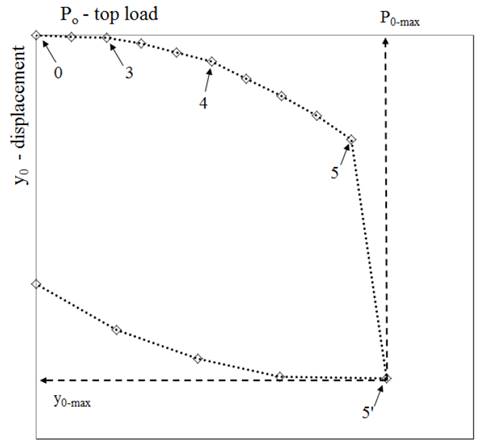
Based on Cambefort's analyses and on the parameters obtained, it was possible to analyze the load vs. displacement curve of the load test, as shown in Fig. 11.
Based on an analysis of the graph in Fig. 11 obtained by means of the load test, the noticeable points of the load vs. settlement curve can be observed. Sections 0 and 3 represent the pseudoelastic interval; 3 and 4 (progressive mobilization of lateral friction of the top to the tip); 4 and 5 (development of the tip reaction) and points 5 and 5’ (associated to maximum load). These points are not necessarily the rupture load.
4. Prediction of Load vs. Settlement
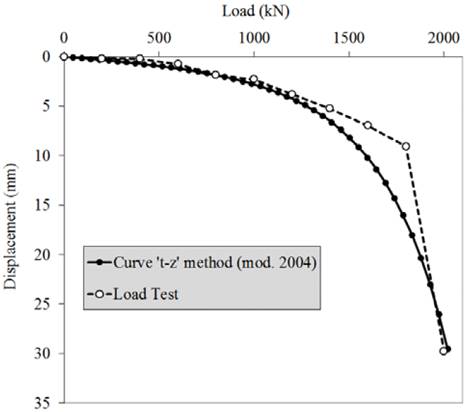
The methods that were analyzed, [10,15], provided good approximation between the prediction and the experimental result, as shown in Figs. 12 and 13.
Source: The authors.
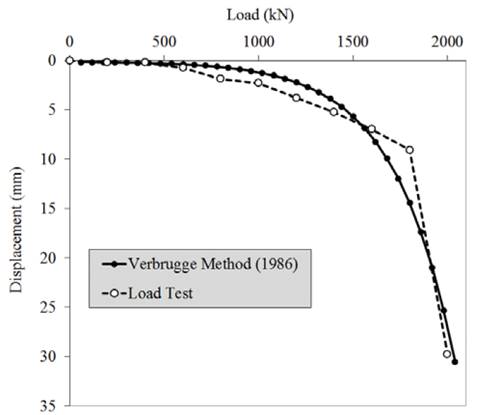
An assessment in terms of displacement of work load concluded that the work load is equal to 50% of the maximum test load. In this sense, the values of settlement obtained are shown in Table 2, which evaluates the assertiveness of each method as to the values of the load test.
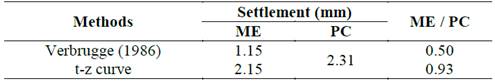
The t-z curve method was the one that was closest to the settlement value obtained in the load test for the work load, with 93% accuracy percentage. On the other hand, the performance of the Verbrugge method scored 50% accuracy in this same comparison, as shown in Table 2.
The curves obtained by the methods agree appropriately to the curve obtained with the load test, particularly in the initial elastic section of the curve in which the t-z curve method agrees better with the actual curve (Fig. 12).
The method proposed by Verbrugge demonstrates the complexity of predicting the load vs. settlement behavior in a simplified way with the equations applied; however it proved to be appropriate to predict settlement. The key mechanism taken into consideration involved the basic concept of load dissipation via lateral resistance provided to the foundation element by the surrounding soil.
In the section with elastoplastic behavior where the soil enters a yield condition, the methods tend to follow the same behavior, but the load test curve is more 'rigid', i.e., the loss of pile/soil contact resistance takes place abruptly.
5. Conclusions
The considerations adopted by these methods deal with the nonlinearity of the soil stress vs. strain behavior, particularly as to use of the initial shear modulus of the soil ( G 0 ) and its respective degradation when loads are applied. Such inference becomes more evident when checking the results found through methods that use this key parameter of the soil.
It is known that two of the key parameters that govern the nonlinear behavior of the soil-pile element are: strain modulus and shear modulus of the soil. However, publications on settlement of separate piles that use the t-z curve method modified by [16] lead to the conclusion that the shear modulus for small strains or the initial shear modulus ( G 0 ) represent a critical soil parameter to be used in the formulations that are developed. This modulus provides quick reduction when the first efforts produced by the initial load take place, coherently together with quick reduction of soil resistance.
The methods proposed by [16,11] include making complex calculations since the process is iterative and includes 'n' repetitions. Therefore, it is critical to develop a plan of the methods, in this case, with the use of the Visual Basic software program in interface with MS Excel.
The adequacy of the methods to predict the load vs. displacement curve is required to calibrate the variable coefficients that each method uses, and to adjust them to the conditions of the local subsoil. On the other hand, the greater the number of comparative tests of these methods with results of actual load tests, the better their performance to predict settlement.
The methods of the t-z curve [16,11] did not take slenderness (L / D) into consideration, nor the type of pile or the executive process employed. On the other hand, these methods were influenced by the initial shear modulus ( 𝐺 0 ) and also by the strain modulus (E), which can be estimated via in situ tests.
For a better understanding and checking of the efficacy of the prediction obtained by the methods of the t-z curve [10,15], it is recommended to carry out a greater number of analyses of actual and predicted results for several types of piles manufactured by different executive processes.

