


 Inglês (pdf)
 Artigo em XML
 Referências do artigo
 Enviar este artigo por email
 Citado por SciELO
  Citado por Google
  Similares em
SciELO
Similares em
SciELO  Similares em Google
 Permalink
1. Introduction
During electrical generation expansion planning process, economic benefits, size and operative performance of different generation alternatives are evaluated by using technical and financial metrics. The well-known Levelized Cost of Electricity (LCOE) is a common financial indicator of different generation projects. According to different authors [1-4], the LCOE is the electricity price, in constant currency, at which energy output must be sold over the generation project life cycle for covering investment and O&M expenses, and return of capital to investors.
Although LCOE of different projects can be used to offer indicative signals for generation expansion planning [5], it has also been exposed that LCOE is not useful for comparing financial performance between intermittent and dispatchable generation technologies [6]. Also, according to [5], LCOE does not capture effects of power system dynamics. In order to overcome potential drawbacks of LCOE, the Energy Information Administration [7] has proposed to use the Levelized Avoided Cost of Electricity (LACE) under the context of the US electricity market. The LACE allows to effectively asses the technical-economic performance of a new generation project. Computing LACE requires the concept of Avoided Cost (AC), which represents potential cost savings in a power system once a new generation project is considered in the power system operations. The levelized term indicates an average cost per MWh of generation. This advantages work presents a novel methodology for computing LACE including operational features of a power system. We evaluate the economic benefit (or even disadvantage) of integrating a particular generation project into the power system by considering its technical operational characteristics and its impact on the economic dispatch. Thus, LACE can be used as a complementary indicator that provides decision makers with realistic and representative signals about generation expansion decisions.
The first contribution of this work is the proposed approach based on combining the DDR method supported by an operational tool like the SCOPF in order to effectively capture benefits (and/or disadvantages) of new generation projects. Not only does this tool evaluate an optimal power flow under normal conditions, but also N-1 post-contingency states are exhaustively considered. If the new project is a non-dispatchable technology (e.g. solar and wind), typical power output profiles are considered for computing LACE. The second contribution is the consideration of different generation scenarios within the power system for computing LACE of the new project. This approach allows to approximately capture the average value of a specific generation project over a set of generation as opposed to LCOE models that only employ a base case generation scenario of the project.
2. Literature review
LACE is conceptually a complementary indicator to LCOE that effectively asses the technical-economic performance of a generation project [7]. It is based on the concept of AC, which has been a public policy tool within energy efficiency context in the US, and it was stated under the Public Utilities Regulatory Policies Act (PURPA) in 1978 [8]. At the international level, several energy-related institutions [7,9-12], have estimated AC as alternative indicators that provide appropriate signals for investors and planners. Besides, references [8,13] argue that AC is based on marginal cost of the power system, and its calculation can provide useful cost saving indicators to investors.
Estimating the AC of a generation project is important for identifying the most promising generation choice [14,15]. Several long-term approaches have been proposed to estimate AC [8,14,15]. One of these approaches is the so-called Differential Revenue Requirement (DRR), which, according to [14], is the most comprehensive. In order to determine the economic and technical effect on the system of a new generation project, the DRR method can be employed. It compares the operational cost of a power system with and without the new generation project.
3. Proposed LACE methodology
Our LACE approach of a specific generation project is based on finding measures that capture the potential impacts, either advantages or disadvantages that the project can offer to the power system. Authors strongly believe these impacts have to be obtained by looking at the potential power system operation under different conditions. The goal of our approach is, therefore, to identify whether the project construction can replace other generation resources due to economic or technical reasons. A new generation project can improve either system security under N-1 contingencies, provide firm energy, offer support during peak demand periods, or replace a more expensive generation. Thus, our LACE indicator not only assesses the economic performance of the project, but also captures operational characteristics of the same.
4. Power system methodology assessment
The power system assessment is performed employing a Preventive DC SCOPF. The SCOPF is an economic dispatch, which ensures a secure power system operation under N-1 transmission contingencies. The interested reader may consult references [16-18] for additional details. Additionally, author propose the use of generation scenarios to provide a more effective LACE that takes into account the performance of the project under different system operating points.
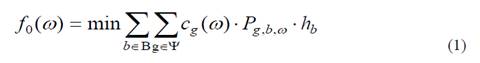
In this setup, the SCOPF model returns the estimated annual operational cost f 0 (ω) of the system under generation scenario ω, which is the optimal objective of the following mixed-integer linear optimization problem:
subject to:
Where:
 : is the set of the power system buses.
 : is the set of existing generators connected at bus i.
 : is the set of generators.
 : is the set of transmission lines.
 is the set of post-contingency states.
 : is the set of demand blocks. A load duration curve that represents annual demand by a sequence of load blocks is employed. A demand level (peak, medium, minimum) and its corresponding number of hours in a year define each demand block b.
 : is the number of hours per year in which demand block b occurs.
 : is the operation cost of each generator in generation scenario ω.
 : base power (100 MVA).
 : is the power generation dispatched by generator g during demand block b when generation scenario ω is simulated.
 : is the power flow through transmission line l during demand block b under contingency state k. k = 0 denotes the pre-contingency or normal condition state.
 : is the transmission line set that ends at bus i.
 : is the transmission line set that starts at bus i.
 : is the power demand at bus i in block b.
 : is the voltage angle at bus i in block b under post-contingency state k.
 : is the electrical impedance of the transmission line l.
 : is the transmission line status parameter; it is 0 if transmission line l is outaged under contingency k, or 1 otherwise.
 : represents the maximum power flow on transmission line l.
 : is a long-term overload factor that is usually defined in the range [1, 1.3] [19].
 : is a binary decision variable; it is 1 if generator g is online, or 0 otherwise.
 : represents the power availability factor of each generator g. A
g,b
(ω) =1 for dispatchable generators, and A
g,b
(ω) < 1 for both intermittent and hydro generators only during dry seasons.
: represents the power availability factor of each generator g. A
g,b
(ω) =1 for dispatchable generators, and A
g,b
(ω) < 1 for both intermittent and hydro generators only during dry seasons.
 max and
  min: are the maximum and minimum operating power limits of each generator, respectively.
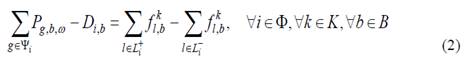
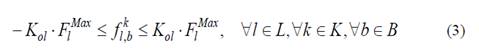
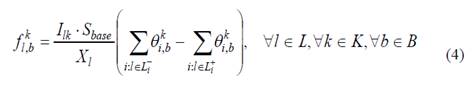
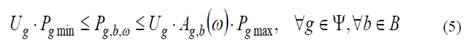
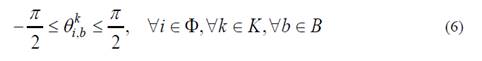
Constraint eq. (1) describes the operational cost of the power system. Constraint eq. (2) represents the power balance constraint under normal and post-contingency operating conditions. Constraint eq. (3) limits power flow on each line under normal and post-contingency operating conditions. Constraint eq. (4) displays the definition of active power flow in terms of voltage angle difference. Constraint eq. (5) shows power output limits of generation. And constraint eq. (6) represents voltage angle limits under normal and post-contingency operating conditions.
5. LACE formulations
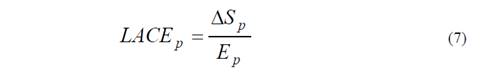
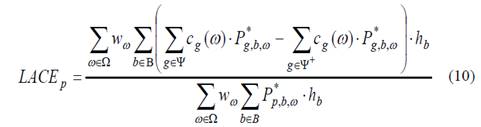
LACE of a new generation project p, namely LACE p , is defined as the annual cost change (ΔS p ) caused by the project per unit of energy (E p ) it can produce during the year. Thus, LACE can be computed as:
If ΔS p > 0, then it can said that project p replaces expensive generation. If ΔS p = 0, it can said that the project does not offer any economic or operational advantage. ΔS p is computed as the average cost change caused by project p with respect to the set of generation scenarios Ω. That is,

Where w
ω
is the weight associated to generation scenario ω. Besides,  represents the resulting operating cost of the system when the generation set considers the new project p, i.e., when set Ψ is changed to
  . In this work, annual energy produced by each new generation project p is averaged over the generation scenarios, according to the work of [20], as eq. (9) shows:
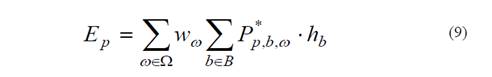
Where 𝑃 𝑝,𝑏,𝜔 ∗ represents the optimal power dispatched by generation project p in demand block b under generation scenario ω. Finally, LACE can be computed as:
6. Net Benefit formulations
Another useful indicator for evaluating generation projects is the Net Benefit (NB). The NB of a project can be calculated by subtraction of investment, operating and administrative costs from the cost savings estimated by avoided costs [13]. According to [7],  of project
  can be computed as:
When LACE p > LCOE p , the project is attractive for the planer or investor since its levelized cost savings can cover the levelized cost. Otherwise, the project does not offer attractive features and might not be considered as a real expansion option. In general, the higher NB p the better.
7. Numerical results
Our goal is to illustrate LACE and NB of diverse generation projects located in Colombia, which are listed in Table 1. Generation technologies like wind, solar photovoltaic, thermal solar, biomass, hydro, coal, gas, and geothermal of different size were considered. Table 1 presents the variable operational cost c p of each new generation project p as well as the connection bus. This data were obtained from [21].
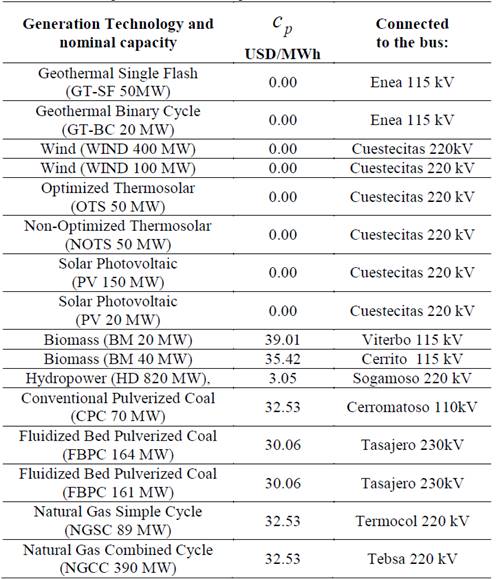
The Colombian network employed consists of 1,487 transmission lines and power transformers, 1018 buses, with a total system demand of 9,500 MW, approximately. Currently, hydro-generation represents 69.9 % of the installed capacity and thermal generation about 29.7 % [22].
Given the high dependence on hydro power, Colombian power system performance is extremely sensitive to weather fluctuations. Geographic location makes of Colombia a tropical country with only two weather seasons: rainy and dry [20]. These conditions allow us to construct two extreme scenarios that capture hydro generation variability. Our generation scenario set is Ω={𝐻,𝑇}, where H represents a heavy “hydro” power production scenario (typical during rainy seasons) and T stands for a heavy “thermal” power production scenario (typical during dry seasons).
Three load blocks were used to model hourly demand variation. These blocks represent peak, medium and minimum demand. According to [23], in Colombia each block is allocated with 2,190 hours/year in peak demand, which occurs during the evening (18:00 h to 0:00 h), 4,745 hours/year in medium demand, which occurs during the daytime (5:00 h to 18:00 h), and 1,825 hours/year in minimum demand (0:00 h to 5:00 h). In order to consider hourly production variability of wind and solar resources, the availability factor A g,b (ω) was adjusted accordingly to limit power production in the SCOPF model. The availability A g,b (ω) used for photovoltaic projects under scenario T during peak, medium and minimum demand was 0, 0.8, and 0 respectively; whereas in scenario H, these factors were 0, 0.1 and 0. In the case of wind projects, availability factors were 0.35, 0.45 and 0.2 for each demand block as previously defined for both scenarios. The optimization model presented in section 4 was implemented in GAMS [24].
From Figure 1 some key elements can be highlighted: 1) coal and biomass-based power technologies display a remarkable LACE component during peak hours and under scenario T compared to renewable projects. Coal and biomass projects displace the most expensive generation in the north and southwest regions of the country. Moreover, some of coal-based technologies such as Fluidized Bed Pulverized Coal (FBPC) and Conventional Pulverized Coal (CPC) have a considerable LACE during medium demand blocks under scenario T. 2) Photovoltaic, thermal solar, wind and geothermal projects have a significant LACE under T scenario and medium demand block (when wind availability is high). The displacement of fossil fuel-based expensive generation during dry season is the reason of these results. On the contrary, LACE caused by these projects is low under the H scenario given the lower displacement of low-cost hydro generation.
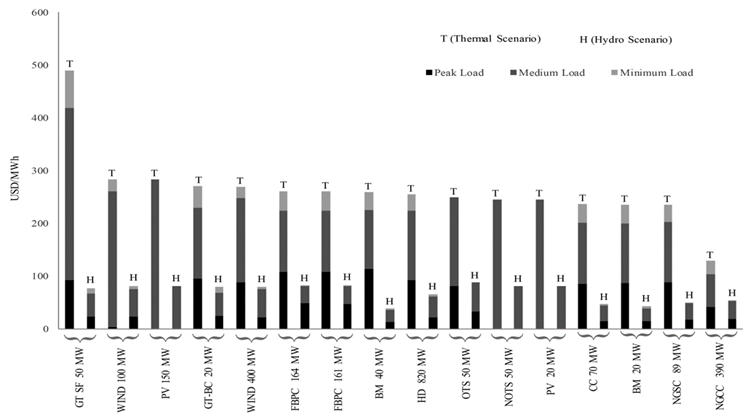
Figure 2 shows results of LACE, LCOE, and NB. LACE is averaged over scenarios H and T. LCOE data were taken from [4]. The adopted approach is inspired in the work of [1], which facilitates the incorporation of current policy aspects (taxes, incentives). From Figure 2, it can be seen that the geothermal project GT-SF 50 MW reflects the maximum NB given its high LACE. The high availability factor of this resource, its independence from weather conditions to produce energy, and its null production cost are key factors that justify these results. This is finally reflected in significant cost savings. A similar result is observed in the US according to NB analysis performed in reference [7]. Intermittent generation like wind, photovoltaic, and thermal solar have a positive value of NB due to great economic competitiveness under scenario T. The project labeled as NGCC 390 MW has a negative NB since its LACE is not as high as its LCOE. This project does not cause any savings under scenario H during minimum load periods.
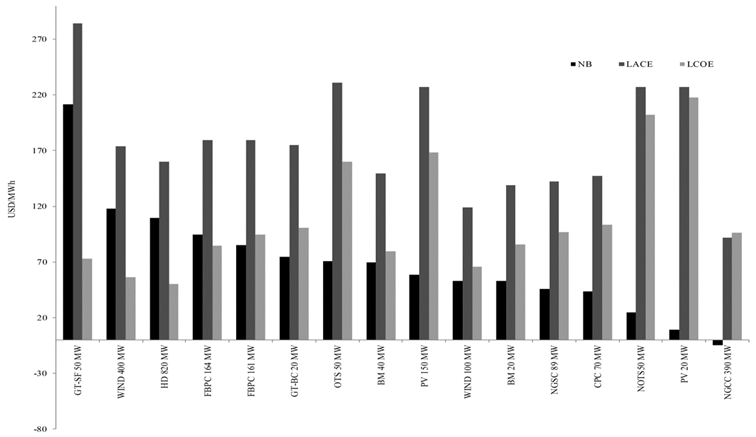
The SCOPF model is useful to detect transmission congestion and security issues due to the occurrence of a specific contingency. In these cases, a specific project, properly located (and not necessarily economic), can improve these security and/or congestion issues. This benefit is ultimately reflected in high LACE. On the contrary, potential operational impact of generation projects on uncongested networks is null. For instance, the installation of the geothermal project GT-SF 50 MW reduced the congestion level on near three-winding transformers under scenario T and peak demand block when the outage of other power transformers was analyzed. The economical and operational advantages of this technology is what makes it valuable.
8. Conclusions
This work proposed a novel methodology for computing LACE considering operational aspects. LACE is a useful index to estimate the unit cost savings produced by new generation project. Our LACE approach also captures important operational aspects, needed to be considered for making investment decisions, such as system security under N-1 contingencies or generation support during peak demand periods. By using the SCOPF as an evaluation tool, the proposed LACE model identifies differences between the power output profiles of both intermittent and dispatchable generation. The proposed LACE model also allows capturing energy resources geographical dependence as well as electrical network topology. Additionally, the consideration of different generation scenarios provides better LACE results, since different operating points are captured. Through NB, it was also possible to identify those candidate projects that effectively balance savings and cost. This formulation can provide decision and policy makers with additional tools to better design expansion plans and policies. According to our results, most of all the renewable generation projects display high values of LACE and NB, especially geothermal technology (GT-SF 50MW).

