


 Inglês (pdf)
 Artigo em XML
 Referências do artigo
 Enviar este artigo por email
 Citado por SciELO
  Citado por Google
  Similares em
SciELO
Similares em
SciELO  Similares em Google
 Permalink
1. Introduction
The site characterization must be performed to define the geotechnical profile, which includes layers identification, thickness and type of soil, water level position and mechanical and hydraulic parameters of each layer. For this purpose, both in situ and laboratory tests can be used. However, although the laboratory tests permit test conditions controlling, as well as accomplishing a series of simulations, in situ tests have been increasingly employed for being simple, operator-independent, rapid and covering a larger volume of soil.
Tropical soils are mostly formed by geological and pedological processes typical of tropical wet regions [1]. It is mainly composed of two horizons. The top horizon, which has suffered intensive pedogenetic evolution is so-called lateritic soils. This horizon overlays a deep layer of residual soil with relict structures from parent rock, which is called as saprolites. The lateritic soil has evolved from residual soils as well as colluvium soils. Tropical soils present a bonding structure, which generates a cohesive-frictional nature, anisotropy due to relic structure, genesis, destructuration under shear conditions and low influence of stress history [2]. Therefore, it is becoming increasingly important to understand the soil behavior of the tropical soils, since they cannot be properly assessed by means of models and correlations developed by the Classical Soil Mechanics.
This paper aims to present and discuss extensive site characterization campaigns carried out by in situ tests performed at one relatively well-studied unsaturated tropical soil profile at Unesp research site, in the State of São Paulo, Brazil. CPT, SDMT and seismic test data were interpreted and compared to available reference soil parameters determined based on laboratory and others in situ tests. In addition, Go/qc, Go/N60, Go/ED and Go/MDMT were discussed to identify microstructure in the studied site profile.
2. Geology and site conditions
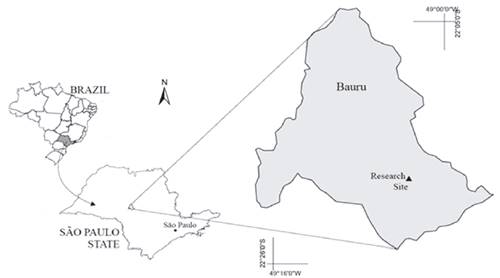
Geotechnical site characterization campaigns were carried out at the Unesp research site - Bauru Campus, in northwest of São Paulo state, Brazil (Fig. 1). This site has been extensively studied via laboratory and in situ tests.
Sandstone rocks from Bauru Group (Upper Cretaceous), which recovers the volcanic rocks from Serra Geral Formation, geologically characterize the soil profile. These rocks emerge in the direction of the Tiete River. Sedimentary rocks from Marilia Formation are predominant at this region, which are experiencing weathering processes over tropical conditions. According to [3], these soils exhibit characteristics from the parent rocks such as sequence of layering and modifications on these geological materials by pedogenetic and morphogenetic processes (softening caused by water migration by the fracture zones and recovering by colluvial soils in several phases). These profiles are generally unsaturated porous sandy soils with a high-saturated permeability and low degrees of saturation (below 30%). An important geotechnical problem in this area is the soil collapsibility caused by wetting.
The study site is characterized by an upper lateritic soil layer (colluvium) about 13.0 m thick followed by a saprolitic soil (residual soil) which reach depths up to 30 m. The groundwater is not found up to 30 m depth. The MCT Classification System (Mini, Compacted, Tropical) proposed by [4] for tropical soils was used to define and classify the soils with regards to their lateritic behavior.
3. In situ tests
3.1. SPT and SPT-T
SPT is still the most current in test for geotechnical site characterization. The test is simple and provides a disturbed soil sample while the penetration resistance (N-value) is measured. Geotechnical design parameters can be estimated from the N-value; however, it has been found to be very dependent on the test equipment and procedure [5-7]. Furthermore, N-values are usually recorded every 1.0 to 1.5 m and that is relatively discontinuous when compared to other tests, such as CPT and DMT.
[8] suggested supplementing the conventional SPT with measurement of the torque required to turn the split spoon after driving. This is called the standard penetration test with torque measurement (SPT-T). According to [8], the torque (T) provides a ‘static’ component for a ‘dynamic’ test.
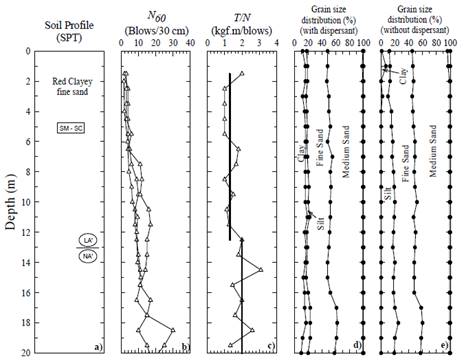
Three SPT tests were carried out in the site. Fig. 2a shows a soil profile consisting of a red, clayey fine sand. Average N-values increase almost linearly with depth, up to 13 m depth (Fig. 2b). One SPT test complemented by torque measurement was carried out at the site and Fig. 2c shows the T/N ratio profile. There are two different trends for the T/N ratio with average values of 1.3 for the top 12.5 m depth and 2.0 bellow this depth (Fig. 2c). The interpretation of MCT classification test data separated lateritic (LA’) from non-lateritic (NA’) soil behavior almost at the same depth (13 m).
Grain size distribution for the soil samples retrieved every meter from one of the SPT tests were determined using dispersant (Fig. 2d) and with no dispersant (Fig. 2e). Oxides and hydroxides of iron and aluminium, which are typical on tropical soil profiles, naturally aggregate clay and silt particles and explains the observed differences.
3.2. CPTu
CPTu is another in test for geotechnical site characterization where cone resistance ( qc ), sleeve friction ( fs ) and pore pressure (u) are measured during the probe penetration at a constant rate of 20 mm per second. The piezocone probe has a 60-degree apex angle and a diameter of 35.7 mm (10 cm² cross-sectional area). The partially saturated nature of tropical soils does not allow pore pressure measurements, so it cannot be used to help the identification of the drainage conditions during cone penetration. [9] suggested a framework for interpretation of cone penetration tests in tropical soils, which depends largely on semi-empirical approaches using other in situ or laboratory test results.
CPTu does not provide soil samples. For this reason, soil type is identified by using classification charts (SBT charts) that relate corrected cone resistance ( qt ) and friction ratio ( Rf ) as discussed by [10]. Four CPTu were carried out in the site in March, 2016. Fig. 3 shows the CPTu data and their interpretation. Water table was not found up to 20 m depth. Due to the unsaturated condition of the studied site, pore pressure was note measured and cone resistance ( qc ) was assumed to be equal to corrected cone resistance ( qt ).
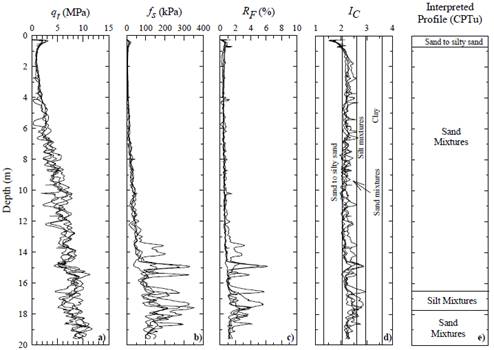
The corrected cone resistance ( qt ) and the sleeve friction ( fs ) increase almost linearly with depth up to 13 m leading to a friction ratio ( Rf ) between 0.5 and 1.0 % (Fig. 3). The Ic index profile, calculated as defined by the Unified Approach [11], is also shown in Fig. 3 and it was used to interpret the soil profile. The CPTu interpreted profile indicated that a sand to silty sand occurs from 0 to1.0 m depth, sand mixtures from 1.0 to 16.5 m depth, silt mixtures from 16.5 to 17.8 m depth and sand mixtures from 17.8 to 19.6 m depth.
Robertson [12] updated the CPT-based SBT classification chart [11] based on the work of Idriss and Boulanger [13]. This modified classification system is based on the soil behavior characteristics, which consider either dilative or contractive behavior at large strains and soils that are predominately more sand-like (susceptible to cyclic liquefaction) or more clay-like (not susceptible to cyclic liquefaction). Moreover, this classification system captures soils in transition from more sand-like to more clay-like.
Fig. 4 shows that the use of Robertson’s chart [12] in the interpretation of the CPTus identified sand-like soils up to 16.5 m depth (Fig. 4a). The soil was classified as transitional between 16.5 to 17.8 m depth, and as a sand-like soil below 17.8 m depth (Fig. 4b). It is also interesting to note that at 13 m depth, where there is a boundary between lateritic (LA’) and non-lateritic (NA’) soil behavior, the CPT response was also different: up to 13 m depth the soil contracts at large strains and below 13 m depth the soil dilates at large strains. It was also observed that soil from the top layer (up to 1.0 m depth) is classified as sand-like soil with dilative behavior at large strains.
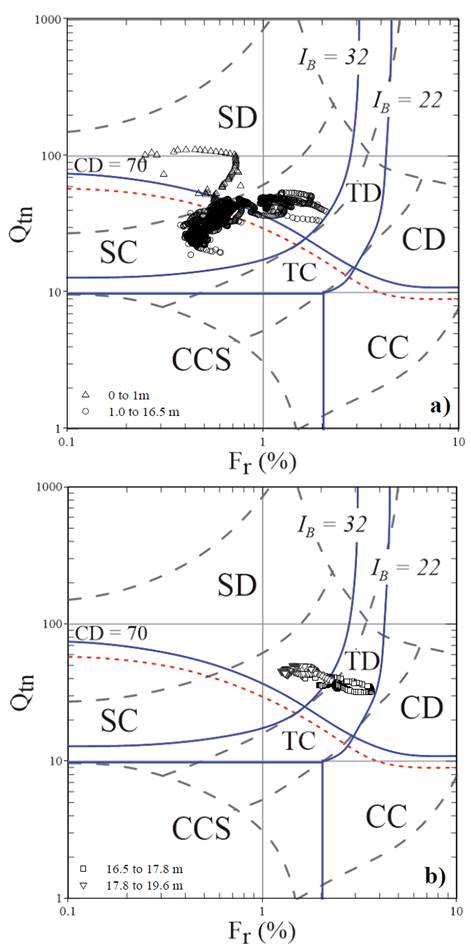
Source: modified from [13].
Figure 4 CPT data from the studied site in the normalized CPT soil behavior chart.
Besides stratigraphic logging, the CPTu data are used to estimate geotechnical parameters based on classical empirical correlations [14,15]. Empirical correlations to estimate soil unit weight (γ), friction angle (ϕ’), constrained modulus (M) and maximum shear modulus ( Go ) were used to compare calculated and measured parameters. The reference Go was determined in situ via one cross-hole [16], one seismic cone [3] and one downhole test [17]. Moreover, the reference of soil unit weight (γ) and friction angle (ϕ’) was determined based on direct shear tests carried out on undisturbed samples [18].
Fig. 5 shows the comparison between measured and estimated parameters in terms of average values for all CPTs. Fig. 5a shows that estimative of soil unit weight (γ) using the
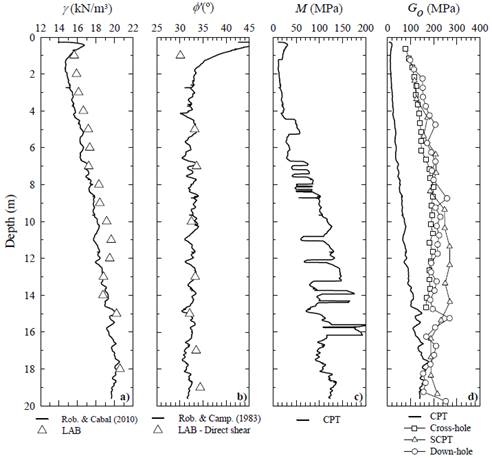
Equation 1, presented by [19], is lower than then those determined by undisturbed soil samples up to 13 m depth and they are in a reasonable agreement bellow this depth.

Fig. 5b presents the comparison between predicted friction angle by Robertson and Campanella [14]’s equation (equation 2) and reference (laboratory data) values.

The reference friction angles were determined by direct shear tests under consolidated drained condition (CD) on undisturbed soil samples at its natural water content. The estimated CPTu friction angle values are in good agreement with those obtained from shear tests. In this case, average estimated ϕ’ angle was equal to 32.5º and the average measured ϕ’ angle of about 33º. However, the estimated ϕ’ values are much higher than the reference ones for the 1 m topsoil. This difference is caused by the influence of soil suction, which provides mainly an increase on the intercept of cohesion. The estimated ϕ’ values incorporate the component of cohesion as a friction angle, since it assumes the soil behave like sands.
The constrained modulus (M) is a key engineering parameter in evaluating the settlements behavior of foundations. Constrained modulus can be obtained by oedometer test in laboratory and in situ tests. Fig. 5c shows the M-values against depth obtained from equation 3 presented below.

Robertson [11] suggested the following simplified correlation:
when Ic > 2.2 use

and, when Ic > 2.2 use

Unfortunately, there are no oedometer test data for this site to be used as reference values.
Maximum shear modulus ( Go ) is a fundamental parameter for predicting the dynamic response of soil and can be determined from elastic theory for equation 6:

where ρ is mass density of the soil (kg/m³) and Vs is shear wave velocity (m/s).
Fig. 5d presents the Go profile obtained from cross-hole, seismic cone and downhole test and the estimated profile from average CPTu data Go was estimated from equation 7 developments for uncemented Holocene to Pleistocene age soils [11]:

Go measured values are much higher than estimated one for this site. It can be associated to the weakly cemented structure of these soils (microstructure), which increases the low strain shear modulus while the penetration of the cone breaks down all cementation [12, 20, 21, 22].
The observed differences between estimated and measured parameters in tropical soils can be attributed the unusual behavior (e.g. a cohesive-frictional nature, anisotropy due to relic structure, destructuration under shear conditions and low influence of stress history). As a result, although CPTu is an excellent tool for soil profiling, it cannot serve as an exclusive site investigation tool for tropical soils, since genetic characteristics affect soil behavior and soil sampling and extra tests are required.
3.3. DMT and SDMT
The DMT was developed by [23] and consists of a blade of 14 mm thick, 95 mm wide and 220 mm length. The SDMT incorporates the traditional "mechanical" Flat Dilatometer with a seismic module placed above the DMT blade. The SDMT module is a probe outfitted with two receivers, spaced 0.5 m, for measuring the shear wave velocity (Vs), which allows obtaining the maximum shear modulus ( Go ) based on Elastic theory [24]. One flat dilatometer (DMT) and three seismic dilatometer (SDMT) tests were carried out in the site in Abril, 2016. Fig. 6 shows the DMT and the SDMT data for the studied site. [23] proposed a series of correlations based on Italian soils for estimating soil parameters (i.e., unit weight - γ, at-rest earth pressure - K o, overconsolidation ratio - OCR, friction angle - ϕ, undrained shear strength - cu and constrained modulus - M).
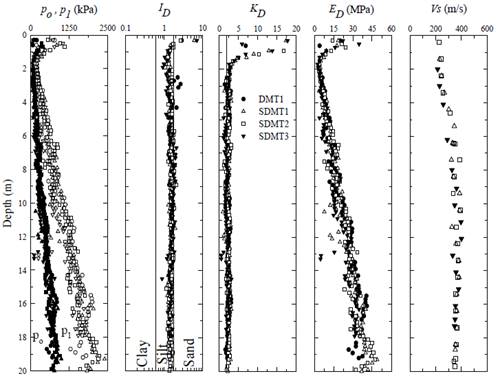
The material index ID= (p1 - p0)/(p0 - u0) was calculated from DMT and SDMT data to identify soil type. The pressures p0 and p1 are recorded when the center of the membrane is displaced 0.05 mm and 1.1 mm respectively, and uo is the hydrostatic pore pressure.
The material index ID (Fig. 6b) indicates that a sand silty occurs in the studied site. This classification can also be observed in the Marchetti and Crapps [25] chart, which can be used for estimating soil type as well as unit weight (Fig. 7). However, the real texture of this soil is a clayey fine sand, as can be seen in the Fig. 2a (SPT samples). [26] affirms that material index ( ID ) should not be used to classify the soil as it is done by grain size analysis, but as an index which reflects mechanical behavior (a kind of "rigidity index"). For example, if a clay for some reasons behaves "more rigidly" than most clays, such clay will be probably interpreted by ID as silt.
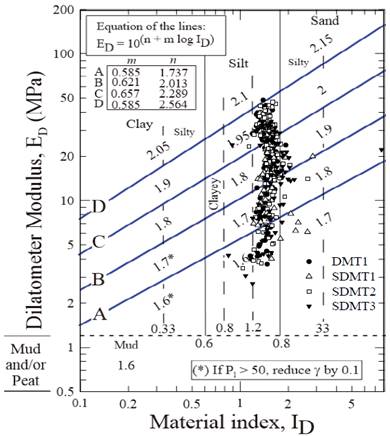
Figure 7 DMT and SDMT data for the studied site in the chart for estimating soil type and unit weight.
Interpretation of soil properties and parameters obtained from the average DMT and SDMT data are presented in the Fig. 8. Unit weight estimated based on the ID vs ED chart [25] is in good agreement with those obtained from undisturbed samples (Fig. 8a).
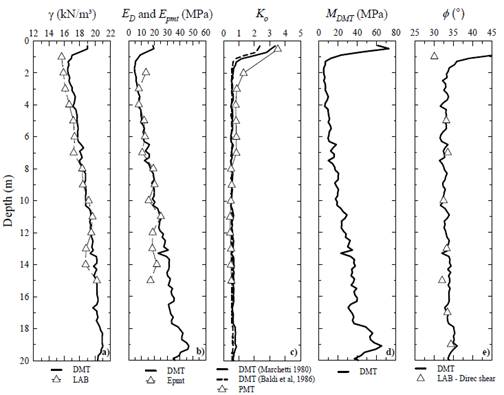
The dilatometer modulus ( ED ) is obtained from p0 and p1 with the Elastic Theory. Fig. 8b shows the ED profile, which demonstrates the linear increase with depth. These data were compared with Epmt determined from Menard Pressuremeter. Epmt and ED (DMT and SDMT) are very close in agreement up to about 11 m depth. Epmt was one third lower than ED after that depth. This behavior can be explained by soil disturbance, as discussed by [27]. According to [28], dilatometer modulus represents a measure of the elastic-plastic response of sands, since it is defined through the slope of the DMT expansion curve.
The DMT data can also be used to estimate the coefficient of at-rest earth pressure ( Ko ). The original correlation suggested by [23] was elaborated for clayey soils. [29] suggested a Ko chart for sands. This chart estimates Ko for a given value of corrected cone resistance ( qt ) and KD . [30] updated it converting into the following equation for sandy soils:
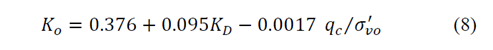
Fig. 8c presents Ko values estimated based on SDMT and DMT data using [23] and [30] correlations, as well as Ko interpreted based on PMT data. Ko from PMT is equal to 3.5 at 0.5 m depth and 1.3 at 1.5 m depth. It assumes a constant value almost equal to 0.8 up to about 8 m depth and 0.5 below this depth. The Ko values estimated from [30] correlation is equal to 2.2 at 0.5 m depth, 0.5 between 1 and 12 m depth and 0.6 below 12 m depth. Ko values predicted by [23] is 3.0 at 0.5 m depth, 0.5 between 1 and 13 m depth and 0.7 below 13 m. DMT Ko values calculated using [30] and [23] correlations better matches with PMT Ko values between 8 to 15 m depth.
Predicting settlements of foundations is the main DMT application. Constrained modulus (M) is derived from the original correlation proposed by [23]. Fig. 8d shows the constrained modulus obtained via SDMT and DMT data. The MDMT increases almost linearly with depth. The average MDMT is equal to 10 MPa up 7 m depth, 23.5 MPa between 7 to 14 m depth and 41 MPa below 14 m depth. Unfortunately, there are no oedometer tests in this site to be used as reference values.
The strength parameters are amongst the most important information in geotechnical design. Fig. 8e presents friction angle estimated thorough Equation 9 suggested by [31] and the values determined in laboratory by direct shear tests (CD type).

The average estimated ϕ’ angle was equivalent to the average measured ϕ’ one of about 33º. For the 1 m topsoil, the estimated ϕ’ angle based on DMT test data was little higher than determined by the direct shear tests. [32] monitored the water content and estimated the soil suction indirectly by the retention curve with depth and observed significant changing on both along the year up to about 4 m depth. This unsaturated soil has a cohesive-friction behavior and the estimative of the shear strength based on DMT data represents it just in terms of the friction angle. It could justify the higher DMT ϕ’ angle for the top 1 m depth.
3.4. Seismic tests
Shear wave velocity (Vs) is an important mechanical parameter for geotechnical projects. Most seismic tests induce low shear strains and Vs can be used to compute initial shear modulus at very small strains, corresponding to a nondestructive testing (γs < 10−6 %). The small-strain shear modulus or the maximum shear modulus ( Go ) is mainly a stiffness parameter to predict the response of machine foundations, dynamic response of soil, earthquake and shallow and deep foundation design [33,34].
One cross-hole [16], two down-holes [17], one seismic cone [3] and one seismic SPT [35] tests previously carried out in the site were reinterpreted. The seismic SPT consists in the up-hole seismic technique carried out together with SPT [33,35]. The shear wave velocity (Vs) and maximum shear modulus ( Go ) profiles, when the latter was calculated from total mass density determined using undisturbed soil samples collected in a sample pit excavated in the site, are illustrated in Fig. 9. The differences observed in both Vs and Go profiles can be associated to different degree of weathering [36] as well as soil anisotropy [37]. [38] discussed variability for this site based on several CPT data and conclude that it could be affected by soil suction in the upper part of the soil profile.
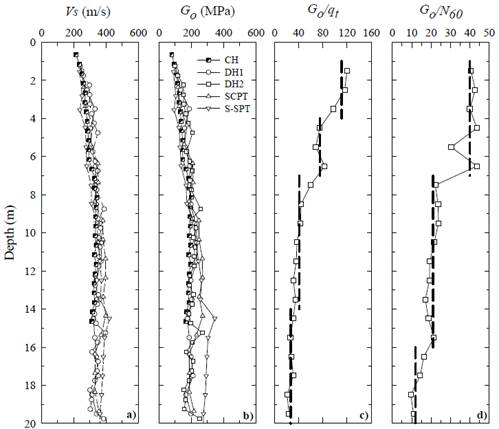
Fig. 9c and Fig. 9d present Go/qt and Go/N60 ratios from average values of Go, qt and N60 . Fig. 9c shows that the average Go/qt ratio tends to decrease with depth, with an average value equal to 111 between 1 and 4 m depth, 75 between 4 to 7 m depth, 41 between 7 to 14 m depth and 27 below 14 m depth. This behavior can also be observed in Fig. 9d, when the average Go/N60 ratio was equal to 40 between 1 and 7 m depth, 21 between 7 to 16 m depth and 12 below 16 m depth.
These data indicate that Go/qt and Go/N60 ratios are higher in the lateritic soil layer and tend to decrease as residual soil is less developed as presented by [38-40].
Tropical soils are typically unsaturated, so the pore pressure (u) are inconsistent and cannot be used as an extra information for soil classification. The ratio between maximum shear modulus ( Go ) and cone resistance ( qt ) is characteristic for clays and sands, as well as for a wide range of well-behaved soils [10]. [41,42,12] suggest the seismic cone (SCPT) as a useful tool to assess unusual geomaterials such as unsaturated soils, tailings, coarse-grained cemented aged materials. The ratio between the elastic stiffness ( Go ) and ultimate strength ( qt ) can be expected to increase with cementation and age, since these factors have higher influence Go than on qt [42].
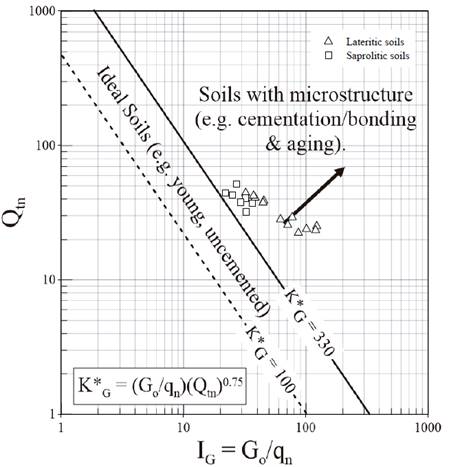
[12], based on [43], proposed a chart and boundaries to evaluate the possible effects of microstructure (e.g. cementation, bonding and ageing) for a given profile. The author proposed the use of a modified normalized small strain rigidity index ( K*G ), the small strain rigidity index ( IG ) and normalized cone resistance with a variable stress exponent ( Qtn ). The IG is defined as:

Qtn is defined as:

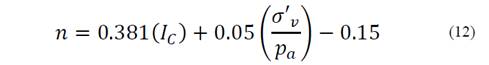
where pa is the atmospheric pressure, σ’v is the vertical effective stress, σv is the vertical stress and n is a stress exponent that varies with soil behavior type index ( IC ), and n is calculated by:
The K*G is defined as:

[12] also demonstrated that soils with K*G < 330 are likely young and uncemented and where main models and empirical correlations for CPT can be applied. Moreover, soils with K*G higher than 330 tend to have significant microstructure, where main models and empirical correlations for CPT can be less reliable and local adjust may be needed.
Fig. 10 presents IG vs Qtn chart and the data for the studied site. It indicates that the bonded structure of tropical sandy soils always produced K*G values higher than 330. Moreover, it is also interesting to note in this Fig. that the lateritic soils have a higher Go/qn ratio than the saprolitic ones. Therefore, the models and empirical correlations for CPT data should be carefully used and local adjusts are necessary.
[44] also proposed interpretation charts for detecting the presence of cemented structures on soils based on DMT and SDMT data. The author carried out DMT and seismic tests in a calibration experiment inside an artificially cemented block samples prepared in a large chamber (CemSoil box). Fig. 11a and Fig. 11b show the Go/ED vs ID and Go / MDMT vs KD chart, respectively, and the three lines and one equation define the limits for the DMT sedimentary international database and upper bounds for cemented soil (CemSoil data).
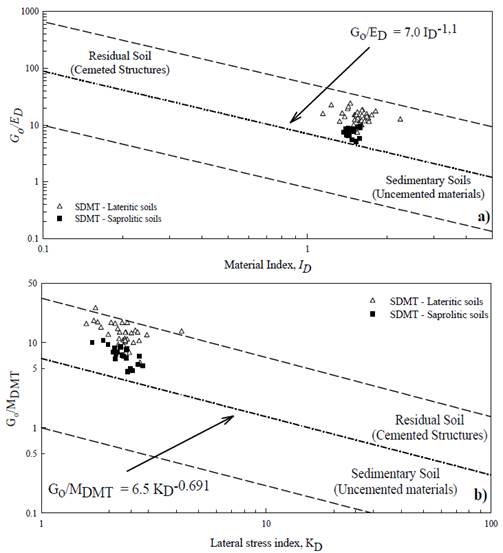
SDMT data plotted in Go/ED vs ID and Go/MDMT vs KD charts are above the line which separates the DMT sedimentary international database and in the range proposed for residual soils. It indicates that the bonded structure of the studied tropical sandy soil produces Go/ED and Go/MDMT that are systematically higher than those observed in sedimentary soils. The differences on Go/ED and Go/MDMT for lateritic and saprolitic soils are also observed, similarly to what was as shown by [18,39] on Go/qc ratio from SCPT and by [40] and the based on based on Go/N60 ratio from S-SPT. These ratios can be used to assess unusual soil behavior and they also indicated that the lateritic soils have higher ratios than the saprolitic ones.
4. Conclusions
This paper aims to present and discuss site investigation campaigns carried out via SPT, CPT, SDMT and seismic tests at a tropical soil profile. The main conclusions are:
The soil profile was classified as red clayey fine sand by SPT samples. Both Ic index and ID parameter were not appropriate to identify soil texture since mixtures of sand and clay were identified as silty sand to sandy silt. The soil description in terms of grain size distribution should be confirmed with soil samples for tropical soil.
The estimated total unit weight based on CPT and SDMT worked well for the study site. The estimated CPT and DMT friction angle also worked well for the soil below 1 m. The unsaturated condition, as well as the cohesive-friction behavior could justify higher CPT and DMT ϕ’ angle for the top 1 m depth.
Go was estimated for the study site assuming that the soil is uncemented quartz sand using current correlations. This approach underestimated Go especially up to 13 m depth in the soil with lateritic behavior (LA’). It can be associated to the weakly cemented structure of these soils, which increases the low strain shear modulus.
DMT Modulus ( ED ) was equivalent to PMT modulus ( Epmt ) up to about 11 m depth and Epmt was almost one third lower than ED after that depth. The lateritic soil layer ends close to this depth (between 12 to 13 m depth), based on MCT Classification System.
Ko predicted from DMT using Marchetti (1980) and Baldi et al. (1986) correlation basically matched PMT Ko values below to 8 m depth.
Robertson [13] proposed a chart to identify the existence of microstructure in soils. Average Go , Qtn and qn data were plotted in this chart. The tropical soil study has significant microstructure (e.g. K*G > 330). As a result, the proposed SBTn charts and most empirical correlations should be carefully applied, and site or geologic specific modifications are required.

