


 Inglês (pdf)
 Artigo em XML
 Referências do artigo
 Enviar este artigo por email
 Citado por SciELO
  Citado por Google
  Similares em
SciELO
Similares em
SciELO  Similares em Google
 Permalink
1. Introduction
Only 2,5% of the water available on the planet is fresh water, and only 0,006% (2120 km3) is contained in rivers [1]. Factors such as the global population of 7400 million people and economic growth (the world's Gross Domestic Product (GDP) doubled over the last 30 years) [2], have increased the pressure on water resources mainly fresh water. For example, human and industrial consumption are supplied mainly by fresh water in 80% and 87%, respectively [3]. It has been determined that to meet production needs and population requirements, the demand for water by the industrial sector must increase to 1170 km3 by 2025, which will lead to a strict dependence on the status and the quality of the resource.
This demand of water by the industrial sector depends on the size of the company, as does the efficiency of its water management [4,5]. Small and medium-sized enterprises (SMEs) are particularly important because they account for 90% of companies worldwide [6] and contribute 50% of GDP and 60% of global employment [7]. In terms of environmental performance, SMEs have certain common characteristics, such as high levels of non-compliance with environmental regulations that can impact the environment [8]. Statistical data on environmental impacts in SMEs are scarce in many countries. Among the few available data, SMEs in Europe account for 50% of the total industrial environmental impact, and in Asia it reaches 70% [5,9].
All agroindustry processes require water for operations, especially the food sector. According to reports from the European Commission, this sector contributes 23% of the global consumption of water resources and generates between 43% and 54% of organic pollutants in water in both developed and developing countries, the latter having primary economies, meaning those based on agriculture [10].
The meat subsector is an important group within the food sector. It demands a significant volume of water; the consumption of meat and dairy alone represent 29% of the human water footprint [12]. By 2014, world meat production was estimated at 311.6 million tons, with poultry at 35%, beef 22%, pork 37%, sheep 4% and others 2% [13]. The poultry subsector, thanks to certain competitive advantages, stands out against the other meat products due to the low area intensity, the reduced rearing and processing times and the low price of the final product versus the others [14]. Worldwide, the main producers of broiler chicken are the United States, China, Brazil and the European Union. In Latin America, the countries that represent 77% of production as of 2013 are Brazil (5608 million chickens), Mexico (1472 million), Argentina (810 million) and Colombia (631 million) [15].
In Colombia, the poultry subsector accounts for 11% of agricultural GDP and 28% of livestock GDP, which also includes other meats such as cattle and pork and products such as milk and eggs. Poultry production has a production value of $14,8 billion (USD $4934 million) [16] and generates approximately 400000 jobs. Some 60% of this activity is located in the departments of Cundinamarca, Santander and Valle. Per capita consumption of poultry at the national level reached 30 kg, requiring 97 million broilers, measured in the capacity of the broiler, equivalent to a production of 1,42 million tons of chicken meat by 2015 [17]. Current water indicators for productive activities in Colombia, such as the water footprint, have been quantified [18]. In terms of demand for surface water or blue water footprint (BWF) at the national level, the Ministry of Environment (ME) estimated 26 m3·year-1 per animal for broiler chicken processing, 4,6x10⁶ m3.year-1 for poultry slaughtering activities and 1,7x10⁶ m3.year-1 for the processing and preservation of meat and meat products [18,19].
According to the Ministry of Information Technologies and Communications, in Colombia there are 306 Poultry Processing Plants, but by 2017 47% were reported closed [20], evidencing strong needs and shortcomings in their processes. Therefore, the present study sought to identify the critical points that generate a high water consumption, and then developed a sensitivity analysis to establish an evaluation of the management, in order to make the right decisions in relation to their management of water, and finally, and thus proposing improvement strategies that contribute to reducing and mitigating the pressure on the water resource caused by Poultry Processing Plants.
2. Materials and methods
2.1. Characterization of the chicken processing plant
The Plant under study was located in the rural area of Valle del Cauca, at an altitude of 1200 m, and temperatures between 25°C in the shade, with a water supply of rivers, streams and creeks. Its economic objective was the slaughter and commercialization of chicken in carcasses without viscera, legs, head or neck. The work week was Monday to Saturday from 5:30 a.m. to 15:30 p.m. It had 69 employees distributed among plant and administrative personnel, with breaks of one hour for breakfast and lunch.
The form of operation was by batches, between 3 and 6. For each truck with chickens that arrived at the plant, there was a sacrifice batch. These were manually unloaded and were heavy. Those that died during the journey were placed in sacks as a confiscation. The chickens were then lifted, stunned, slaughtered, scalded, plucked, skinned, eviscerated, washed, then cooled or hydrated and then packaged, stored and/or dispatched. The length of time from lifting to packing is 76,5 minutes. Before each break and batches, the workers quickly rinsed their work areas. At the end of the day, a general cleaning was carried out at the plant.
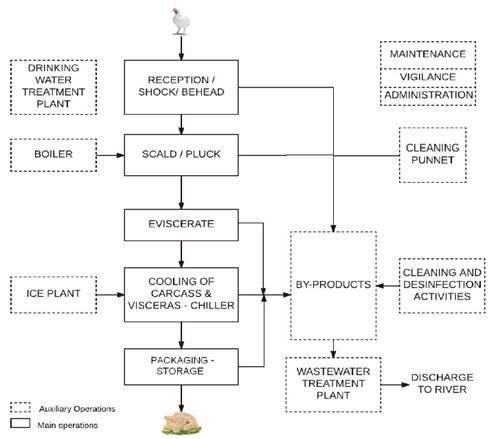
The auxiliary operations with water demand included administrative activities, water purification (DWTP), washing baskets, ice generation, general cleaning and disinfection, activities in the by-product area, activities in the wastewater treatment plant (WWTP) and the bathroom service. The latter has eight toilets with a tank capacity of 6 liters and for handwashing two metal structures each with four wrenches under pressure. There is also a boiler for the generation of steam, which consumes 1m3.day-1 of water. Fig. 1 shows the general outline of the plant.
The by-product area received, by pipes and channels, waste from each of the areas, such as feathers, cuticle, viscera, guts and undigested food. In this area, solid waste was collected manually in sacks (feathers, cuticle and feed) and in buckets (viscera). Blood was stored in jars. These waste products were withdrawn daily and purchased by an outside company. Regarding wastewater was sent to the WWTP, with a treatment system consisting of a grease trap, oxidation trench, secondary settler and gravel-sand filters.
At the end of the shift, general disinfection of equipment, walls and floors was carried out in each area. Typically, it started at 17:00 pm with an average duration of 7 hours, being carried out by three operators to clean the eight areas. Depending on the area, the cleaning lasted 20-120 minutes. It started with a manual rinse, using buckets and hoses without valves to turn them off. Although washing equipment (pressure hydro-washer of handgun) was available, it was damaged. Then, the areas were scrubbed, and the final rinse removed detergent. At the end a spray disinfectant is applied.
To establish the typical operation at the plant, 114 days of operation were studied, from February to August 2016. With this information the operation was evaluated from Monday to Saturday, using the box diagram.
2.2. Water consumption estimation
Visits were made to a poultry processing plant to understand the processes performed there. Each area of the enterprise was inspected with regard to water use on equipment and activities performed by the operators, including the state of the infrastructure. The daily logs of the process and the technical feature of the teams were also evaluated. Primary and secondary information from the literature review was compiled and then contrasted with our collected data. All points of access to water in the plant were identified and inventoried by area, identifying the points where the water was used and where it was poured, as well as a photographic survey of the leaks. In addition, we identified which units were directly required for the process and which were only auxiliary operations. For water supply, the company had two supplies, the main one came from a surface water source that worked on gravity and provided 95% of the water which supplied average flow of 4 L.s-1 and the another came from the local public aqueduct destined for the generation of ice. This requires to be driven by pumping. Due to the lack of water flow meters in the plant, it was necessary to carry out a water balance. With the volumetric method, the flow rates of the productive areas were calculated. For this, chronometers and buckets (12L) were used, and for each measurement 3 replicates were made. Finally, an material flow analysis was performed using the trial version of the software e!Sankey 4 calc, 4.4.07513 for 14 days of august of 2017.
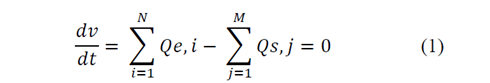
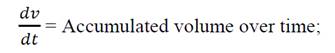
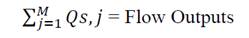
The water balance equation was:
Accumulation = Inputs - Outputs + Production - Consumption
With: Accumulation, Production and Consumption = 0,
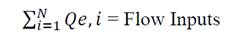
we had eq. (1):
Then,
2.3. Sensitivity analysis
A sensitivity analysis of the water consumption in the productive process was carried out. Thus, the information was grouped with respect to the number of batches processed, the number of chickens processed, the average time of a batch and the duration of slaughter. The operating range was established with the maximum and minimum value found in the records. The minimum found was 50 minutes, so an increase of 15 in 15 minutes was established until 140 minutes. These were analyzed by varying the time of the batch between 50 and 140 minutes. The unit used to compare the performance efficiency was liters consumed per chicken.
3. Results and discussion
3.1. Characterization of the productive process
With the recognition of each area and the variation in the number of chickens slaughtered from one batch to another and from one day to another, it was necessary to analyze the behavior and dispersion with respect to the number of slaughtered batches and then, to establish the typical operation at the plant.
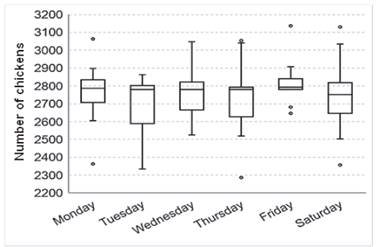
Fig. 2 shows the number of chickens slaughtered for each batch. For all period evaluated the median was around to 2780 chickens. In terms of interquartile range this oscillates between 2600 and 2860 chickens, such difference was due to the capacity of the truck and / or production on the farm. The size of the boxes shows a very similar dispersion from one day to another, being minimal in the case of Friday, showing homogeneous batch, perhaps by factors such as the allocation of the same farm. The minimum and maximum atypical values found for the number of slaughtered chickens per batch were 2290 and 3140 respectively, thus indicating the flexibility of operation that the plant has by batch. Such variations are caused by the number of chickens caged according to the sex and weight of the animal sent in each batch.
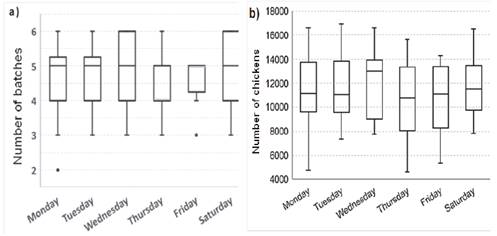
The Fig. 3(a) shows numbers of batches per day. The median was 5 batches by day, except on Thursday. Wednesday and Saturday had the greatest dispersion with an interquartile range between 4 and 6 batches. This is reflected in the processing capacity of a day of sacrifice, Fig. 3(b), where the median of Wednesday was the highest with 13000 chickens to coincide with the highest number of batches processed. For the other days, the median was reiterative, close to 11200 chickens, with a homogeneous distribution and an interquartile range between 8000 and 14000 chickens, as well extreme values between 4200 and 17000 chickens were observed.
Source: The authors
Figure 3 Slaughter capacity average per day. (a) Number of batches per day; (b) Processing capacity: total slaughtered chickens per day
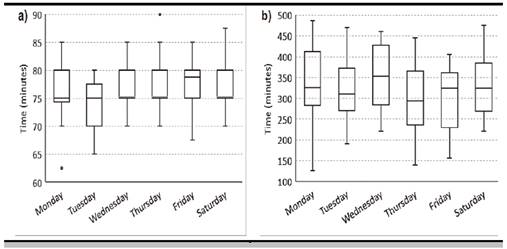
In addition, to quantify the water consumption by the areas it was necessary to describe the operating times. This measurement considered (a) the time to hoist a batch for slaughter and (b) the total duration per day. It should be noted that few studies describe the operating times. The Fig. 4 (a), shows a low dispersion of data for the different days, being between 75 and 80 minutes, except Tuesday with 70 minutes coinciding with a smaller number of chickens to be sacrificed. Atypical values were reported between 63 and 90 minutes. In terms of the total day of operation, Fig 4 (b) shows an average of 320 minutes with a discrepancy of Wednesday that reaches 353 minutes, because it coincides with the day of greatest production. On Thursday a time of only 293 minutes was registered, with 4 process batches in the day. The extreme values were between 123 and 485 minutes. It should be highlighted that these were net values of the hoisting time of the chickens, and do not include recess and other stops of operation.
Source: The authors
Figure 4 Duration of the slaughter process of chickens, average per day. a) Total operating time and duration of each batch; b) Total batches time and total duration per process day.
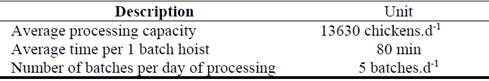
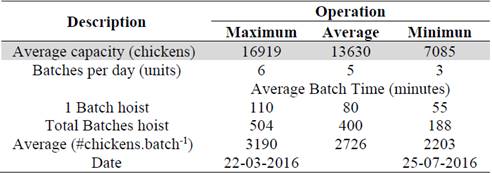
The above is important to mention because the operating time is linked to the amount of water consumed and it will vary according to the number and type of equipment, as well as the way of operation. Such disinformation can lead to underestimation of total water demands. As a result of the characterization, a 5 batches operation was established for the Plant. Of the 114 days, 47% were performed under this condition. Therefore, the average operation of the plant was established with the values shown in Table 1.
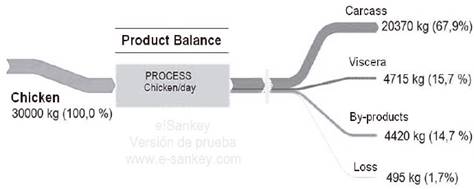
Based on average operation conditions, the mass balance indicated that the chicken carcass product amounted to 67,9% of the total, edible viscera 15,7% and by-products and losses the remaining 16,4% (Fig. 5). The percentages found correspond to the reported for a chicken carcass weight between 67% and 75% [29] and a by-product weight of 20% [27].
3.2. Estimation of consumption
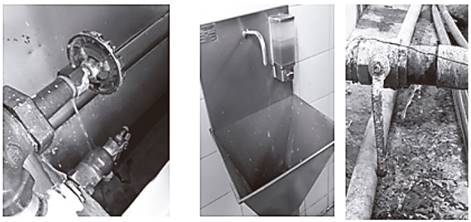
The main water uses in the plant were: the production process, cleaning of equipment, use of bathrooms and general cleaning. Throughout the plant, 58 water supply points were inspected, also the presence and absence of leaks in them. In the toilet service was not recorded leakage. Of the eleven water leaks found, they were located in the joints of the equipment, in the faucets or in the water main pipes (see Fig. 6), wasting 3621 liters of water per day. One of the causes was the type of valve used, as a direct seal caused a pressure blow on the joints, causing misalignments and leaks. On the other hand, leaks are a contributing factor in the generation of wastewater, which can sometimes affect the removal efficiency of treatment systems, having very dilute loads.
To estimate water consumption, it was necessary to establish the management of the demand and the frequency of consumption of the equipment, operation activities and routine cleaning as well as the instruments used for its execution (faucets, hoses, buckets, etc.). Fig. 7 shows the areas and required volume of 206,2 m3 of water to slaughter 13630 chickens in one day of processing. The net consumption of the process was 140,0 m3 (68%) excluding auxiliary operations, ice demand and cleaning at the plant. The distribution of water demand that each area generates is shown in Fig. 8. Evisceration, plucking and scalding accounted for 62% of the total water consumption that the plant used. This coincides with the 68% reported in the literature [22].
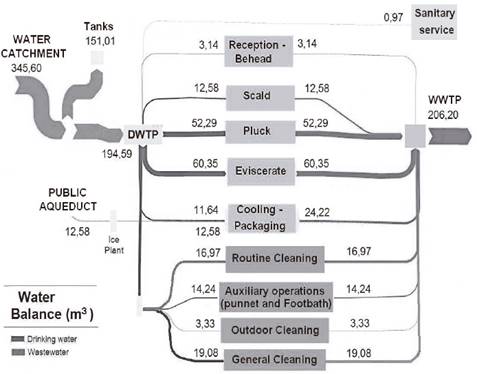
Figure 7 Water balance for a day of process using the e! Sankey software. Note: DWTP: Drinking water Treatment Plant; WWTP: Wastewater Treatment Plant.
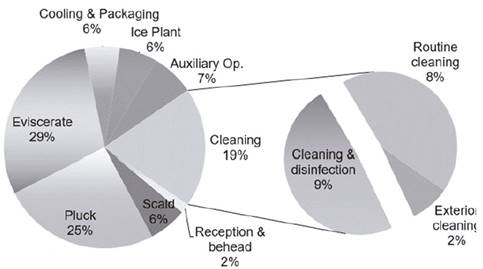
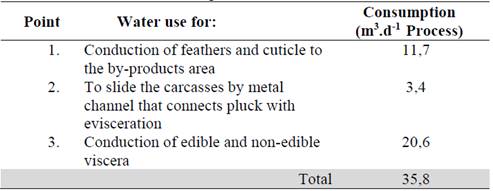
Plucking and evisceration were the activities with the highest demand, at 103,8 m3. It should be mentioned that 35,8m3 was for the use of water as a means of transport. The activities are described in Table 2. Point 1 used a hose with a constant flow of water to transmit the waste to the by-product zone. At point 2, a raised metal channel received the chicken and slid it with water towards the evisceration area. Point 3 carried the viscera, discharging water through the ducts. As for the cooling area it represented 11,7% including ice. The literature reports values between 14% and 16,7% [22,26]. Routine cleaning activities in each area depend on the number of breaks and how long each batch of chickens is processed. This represented 8,2% of total consumption, with 16,9 m3. The area with the highest water consumption was the reception where the chickens arrived, where constant cleaning of the truck, cages and place of unloading was required. For [22,26] this was reported in 15%.
Cleaning and disinfection at the end of the shift had a consumption of 39,4 m3. The volume depended on how the operator performed the cleaning, the instruments used and the time required to do it. The use of hoses without faucets to shut them off caused a waste, which doubled the consumption when compared to the use of pressure-washing equipment.
The cleaning activity accounted for 19% of the total consumption quantified, but when compared with the main operations only, it reached 25%. According to the companies evaluated by [21], cleaning ranged between 10% and 22% of the total consumption. Values of 9% were reported by [22] for industrial cleaning, and including the washing activity of the baskets and cages, it reached 18%. It should be mentioned that for the present study, washing baskets and washing cages were considered ancillary activities because each task had its own personnel, day and area. In the literature only one study was found that quantified the water consumption for a poultry processing plant. It did not specify the operating conditions, but it presented consolidated values for the companies in terms of water consumption per month, as well as the number of birds slaughtered for each studied plant [21]. Another study evaluated water minimization, reporting values only in percentages [22]. Other it reported data in terms of water effluent in m3·ton-1 but without information on chicken weight and slaughtering capacity [23]. These reports thus presented water consumption in different ways, which makes it difficult to make an adequate comparison between companies, together with the lack of relevant information.
Table 3 shows the consolidation of available studies with information in terms of slaughtering capacity, water consumption and volume of effluent generated. It should be noted that when the study did not indicate the days per month, 26 days of operation were assumed. In addition, we considered the minimum number of chickens that a plant of similar size would sacrifice in an hour. Based on this, the minimum operating hours of the plant were estimated.
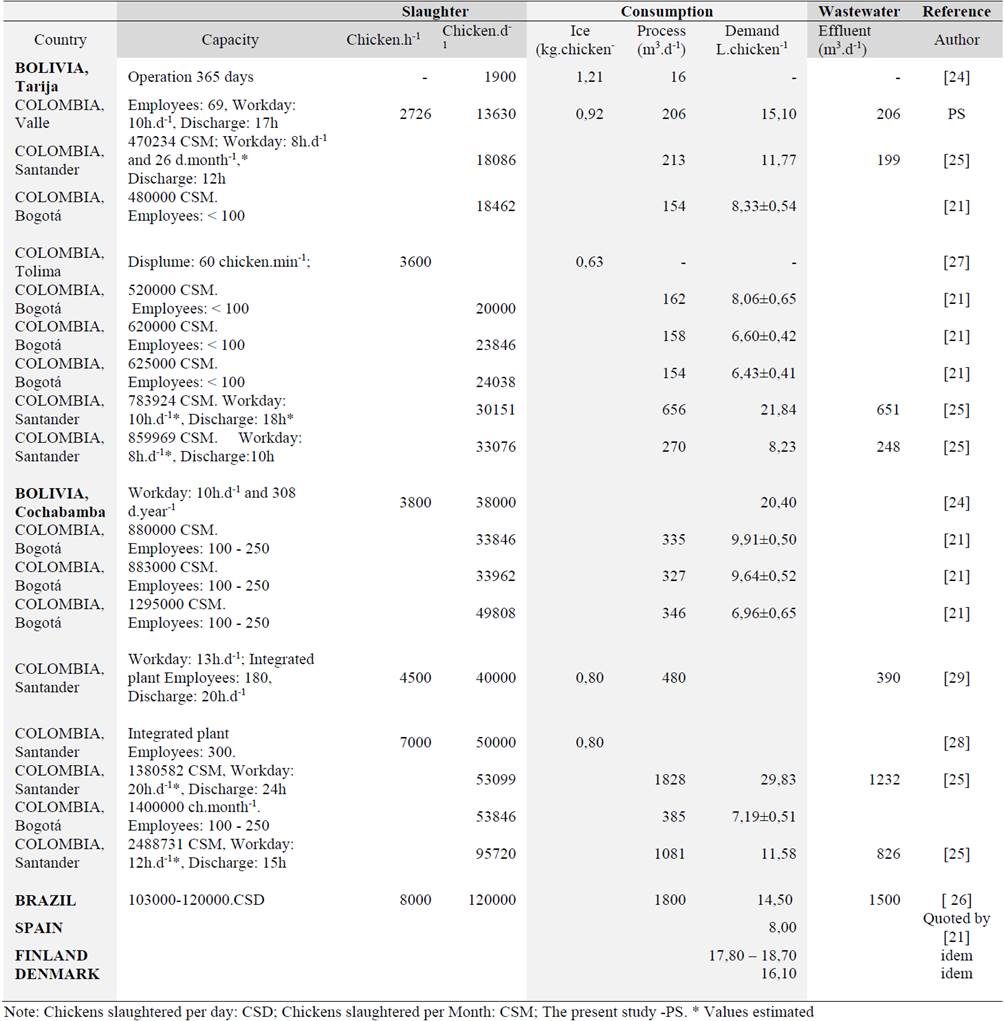
For the 17 processing plants referenced for Colombia, it was estimated that, there would be a total of 186 million chickens slaughtered per year, requiring 2,09x10⁶m3 of water. If it is compared with the value reported by the Ministry ME, there is an underestimated value of only 4,6 x10⁶m3 for all Poultry Processing Plants. Thus, it is critical to study how water management is being carried out in this sector because it may be underestimated. However, the range found to sacrifice a single chicken was between 6,4 to 29,8L/chicken, indicating how there are companies that can consume up to five times more water per processed chicken than others. According to Environmental Technology Best Practice Programme-ETBPP for chicken slaughter activity having 8,0 L.chicken-1, is a recommended value of operation and this evidenced inefficient water management, generating pressure on the water resource. Due to the different ways in which each plant can operate, it is important that studies report the quantified values and the areas included and not included as precisely and specifically as possible, to enable correct comparisons. What promotes working on how water management is carried out in these production processes.
3.3. Sensitivity analysis of the production process
In order to analyze the liters consumed per chickens and to evaluate trends and behaviors of the water consumption in a day of operation, values such as the number of chickens processed, the number of batches and their duration were analyzed. In Table 4, the actual plant performance values and their maximum, average and minimum processing capacities are presented. These values established the operating range of the plant, between 50 and 140 minutes per hoist one batch.
A sensitivity analysis for 110 minutes was presented as an example, indicating the fixed values. For this case, the 20-minute delay in the process, from hoisting to packing, resulted in an increase of 38,5 m3, equivalent to 3L more for each processed chicken. Table 5 consolidates the results obtained. For this analysis the activities of the process were grouped (main and auxiliary operations), as well as cleaning (general, routine and outdoor).
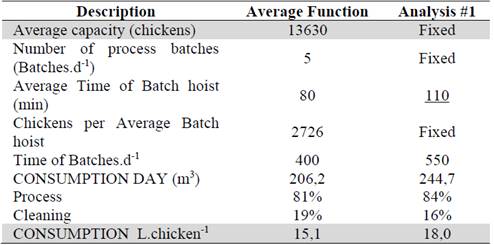
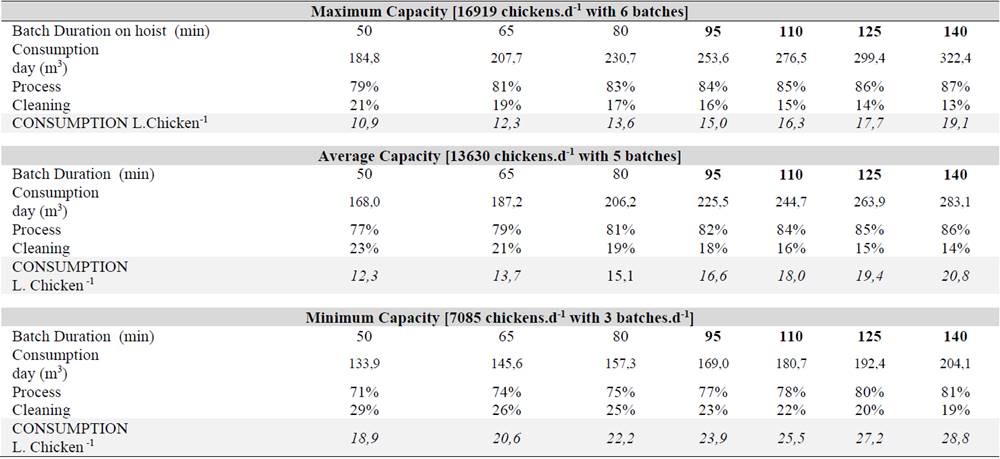
Table 6 shows the increase of water consumption by processed chicken for periods of 15 minutes for each capacity. For the reported maximum slaughter capacity, consumptions were obtained between 10,9 and 19,1 L per chicken, almost double the value. According to these data, for every minute would have a consumption of 1529 L more approximately. Considering the average value, the range found was 12,3 and 20,8L per chicken with an increase of 1279L. In terms of the minimum production capacity of 7085 chickens, the results found were 18,9 to 28,8 L per chicken, giving an average increase of 780 L·min-1. When compared with the maximum values, the minimum number of chickens slaughtered per process caused a higher rate of water consumption per chicken. This is explained by the minimum operating requirements, in water and equipment, that are needed for its execution. This indicates the importance of working with appropriate water management in this sector, confirming that inefficient use doubles water demand.
Table 6 Sensitivity analysis for the maximum, average and minimum production day
Source: The authors
Identifying the critical points that generate an inadequate water performance is fundamental for a sustainable water management and thus successful decision making and not only the remediation of end-of-pipe (for example, WWTP) with high costs in the alternatives, causing a strong economic impact for SMEs.
The cleaning activity was between 13% and 23% of the water use (Table 6), both in the maximum and in the average of one day of operation. However, it is important to note that the percentages of cleaning variation indicated are not because this activity increased with the duration of the slaughter process, because 94% of it was independent of the process. The increase found was due to a faucetless hose used to rinse the floor located in the scalding and plucking areas. The consumption for this activity was between 38,8 and 41,0 m3 representing 2,9 and 5,5 L per chicken, for the average and minimum capacity. The lowest capacity is explained by the minimum requirements of slaughter process, since cleaning must be performed for one or six batches, the carried out the same throughout the plant.
3.4. In situ improvement proposals
In brief, a group of improvement strategies focused on the prevention and minimization of water consumption, considered low cost and easy to implement for SMEs, are presented.
3.4.1. Dry handling of byproducts
Instead of continuing to use water as a means of transportation, it is proposed to consider dry management as a water minimization strategy, seeking a gradual change in water use as a means of transportation. In this case, the change of 50% would allow a reduction of 16,2 m3.d-1, equivalent to 8% of the total average consumption of the production process, and thereby encourage an environmental awareness regarding the management of the resource within the business. Actions like these have been reported by [24].
3.4.2. Records management and control
Starting from the premise "what is not measured cannot be controlled", it is proposed to install a meter, when possible and even if it is second-hand but in good condition, to quantify the volume that enters the Plant. Another recommendation is to plan when an adaptation is achieved at the plant, consider a design of the supply network by areas that have their own measurement record. For example, for the area of scalding, plucking and evisceration have a measuring point. This type of control and measurement are performed by large companies in all areas. Also recommended by Kist et al.[26].
3.4.3. Water leakage management
An option to avoid leaks and their recurrence could be to change to butterfly valves that close gradually. This type of valve located at strategic points (eg water as transport of by-products and high consumption areas), contributes to the reduction of consumption by not being open to the full. The amount of expenditure was 3621 L in 24 hours, representing 2% of the total volume. Although this percentage could be considered negligible by the volume that it represents, it influences the perception of the workers, evidencing a corporate culture of water waste by showing a lack of interest in the maintenance of leaks. Which is why having a periodic maintenance plan for leakage and the state of the networks is critical. At least one revision is proposed per month.
3.4.4. Implementation of low consumption equipment and / or equipment
The elements that are recommended of immediate implementation for the minimization of consumption, are the control devices of closing in the ten hoses. The importance of acquiring and / or repairing the pressure hydro-washer equipment is also highlighted. An example is to consume 0,30L.s-1 with the hose and with the hydro-washed device only 0,09L/s was required. Only this option can represent a decrease in consumption up to 30% for routine and general cleaning activities.
3.4.5. Business environmental education
It is important to promote a business environmental education interested in the care of the water resource because can lead to actions that reduce the impacts arising from water withdrawals and disposal. For example, the greater the demand for water, the greater the generation of wastewater. This awareness also covers the handling of by-products (blood, viscera), and how it can affect the quality of the effluent and the performance of the treatment system. The implementation of minimization strategies with posters or banners, as well as training on improvement in water management, allows moving towards a better performance of the water in companies. It is also recommended to make a periodic check during breaks, to avoid open faucets. Management strategies that help encourage staff in each area to perform better, with a recognition at the end of the month are also very assertive.
3.4.6. Reuse of cleaning water
Due to strong restrictions that food companies must meet, this option has limitations. However, it is a valuable resource to employ, 41m3 daily. Unlike the other proposals, these require a characterization of the water, the storage tank and the location conducive to its use. Depending on the quality of the wastewater of cleaning, this could be used for washing the truck and cages, washing exterior roads, rinsing the byproduct areas and the too, the plant of wastewater treatment [22, 26]. This option has also been reported in the literature, attaining that a 40% of the effluents can be reused, nevertheless, it can be higher if a treatment system for reuse is projected [30].
4. Conclusions
An evaluation of the use of water in a poultry benefit plant was presented. The results show that characterizing the plant allows to recognize variations in its operation and therefore, have more accurate estimates. A consumption of 206,2 m3.d-1 was recorded, equivalent to 15,1L per chicken. This depended on the number of areas, the forms of operation and the execution time in each line of production and cleaning. Additionally, a strong trend of water management as a means of transportation was found 35,8m3, corresponding to 17% of total consumption.
The sensitivity analysis allowed to evaluate the efficiency of the process and to quantify the increase of the water consumption to the maximum, average and minimum capacity. For each, an increase of 1529L, 1279L and 780L per minute was found, respectively, showing a range between 10,9 and 28,8L per chicken. This sensitivity analysis corroborated a lower number of slaughtered chickens, corresponds to a higher water demand. The high consumption of water also responded to practices of water wastage included prolonged leakage, lack of maintenance, hoses without control valves for closure and water based transport. This condition is partly propitiated by having an abundant water supply at a low cost. Inattention to water wastage encourages high consumption in the facilities.
The literature reported water consumption values per chicken of 6,4L, lower than the 8,0L recommended by ETBPP, being a benchmark for good performance and efficiency in water management. Consumptions above this value are considered operationally inefficient. This situation shows the need to work on approaches to sustainable consumption of water resources for this productive process. Finally, to help water management in these sectors, the need to integrate this type of production process with the academy by the strengthening and shaping of work teams is evident. This would allow companies to identify the critical points that generate an inadequate water performance and thus help to mitigate the needs and limitations that exist in the productive processes of SMEs.

