


 English (pdf)
 Article in xml format
 Article references
 Send this article by e-mail
 Cited by SciELO
  Cited by Google
  Similars in
SciELO
Similars in
SciELO  Similars in Google
 Permalink
1. Introduction
Among environmental factors, the thermal factors represented by air temperature, relative humidity, thermal radiation and air movement are those that most directly affect the bird because they compromise homeothermy. These environmental variables can have both positive and negative effects on the production of poultry.
The help of innovative methods, non-invasive assessment tools and control of well-being in a confined environment has been sought to better evaluate the animal production environment. Among the different mechanisms of evaluation, records and studies of sound pressure levels emitted by a group of animals has emerged as an innovative behavioral indicator technology. Thus, the use of appropriate and reliable methodology for recording data becomes essential for an analysis with greater accuracy [1].
Noise levels (sound pressure) inside animal facilities can be studied in two ways; firstly in relation to the vocalization processes of animals housed in different environmental conditions, which gives knowledge about their health conditions or stress. The second approach is related to the internal conditions that may cause health problems in animals and the workers in these facilities. This, for workers, is already supported by the scientific community, with its maximum daily exposure quite clear from the legislation in the country. However, it is difficult to find studies that evaluate the audibility range of domestic animal species. But it is widely known that animals have an audible range greater than that of humans and therefore the effects caused by various noises created by mechanized production activity in animals are unknown. Another relevant aspect in the study of the production environment is the homogeneity of the variables within the facility, which can be assessed by spatialization of these variables.
The geostatistical technique is an important tool in understanding spatial phenomena for accommodation in animal facilities [2]. Thus, the spatial distribution of the thermal and acoustic environmental variables enables an understanding of the relationship between these factors of the production environment and their spatial variation [3-5]. Other studies have also used geostatistics as a methodology for evaluating automatic capture of sound pressure levels in animal production, and in the thermoacoustic and illuminance environment in commercial buildings for raising broiler chickens [1,5-7].
Based on this approach, the aim of this experiment was to study the spatial variability of the noise levels inside two commercial poultry housing, with different adiabatic evaporative cooling systems.
2. Material and methods
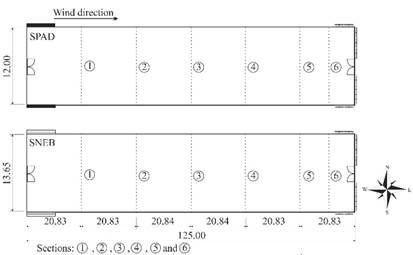
The experiment was conducted in two commercial poultry housing located in the city of Itaberaí, Goias State, Brazil (latitude 16º01 'S, longitude 49º48' W Greenwich, 722 m altitude and atmospheric pressure of 929 hPa): a) one shed equipped with tunnel ventilation mode (negative pressure) and evaporative cooling system of the type with wetted porous material and nebulization (SPAD) whose porous material is comprised of cellulose in each plate with dimensions 10.70 x 1.80 m, and 16 lines of nebulizers distributed throughout the warehouse, totaling 89 water emitters, with an average flow rate of 1.20 ± 1.02 ml s-1; b) the second shed was equipped with ventilation in tunnel mode (negative pressure) and the cooling system type with dampened material, having two panels covered by shading and moistened by 47 nebulizers (SNEB), distributed in front of the plates, dimensions 10.84 x 2.00 m associated and with misting system, consisting of 17 transverse lines, distributed over the shed, totaling 94 sprinklers of water, with an average flow rate of 1.38 ± 0.83 ml s-1. The SPAD and SNEB sheds have dimensions of 12 x 125 x 2.5 m and 13.6 x 125 x 2.5 m, respectively, oriented in the east-west direction. In these animal facilities were housed Cobb broilers, females, with an approximate average stocking density of 13 birds m-2.
The noise level inside each house was evaluated using a digital sound level meter (IMPAC®, mod. P-900DL, accuracy ± 1.4 dBA and resolution of 0.1 dBA). The data were measured manually at each point in six predetermined sections, totaling 36 points. At each point, the noise level was measured three times, totaling 108 repetitions daily (Fig. 1). The data were collected in the summer of 2016 during the hottest hours of the day (14:00 to 16:00 h).
Source: The authors.
Figure 1 Scheme of the divisions of the six sections along the poultry housing. Dimensions in meters.
The following conditions to evaluate the noise level inside each shed was adopted in this study: a) background noise level: without operating the equipment (clean and disinfect periods); b) background noise level + noise level of birds throughout the production cycle (21-42 days), with the action of the ventilation and misting system.
The geostatistical technique based on the theory of regionalized variables was used to describe the noise level. The spatial dependence was analyzed by semivariogram settings [8], based on the assumption of stationarity (intrinsic hypothesis). The classic semivariogram was estimated using eq. 1:
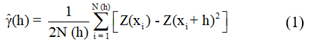
Where: N(H) represents the number of pairs of measured values Z(xi) And Z(xi + h), separated by a determined distance (h). The values of Z can be any of the parameters studied, while the values of xi and xi + H are defined according to the positions of the sampling points within each shed.
After calculating the semivariogram, the values of semivariance and the distance (h) were prepared in scatter plots, having as Y values the semivariances, and as X values the distances. In this graph, a mathematical function must be set using certain parameters, namely: nugget effect (C0); this is the value of semivariance, when the distance is equal to 0 (zero); sill variance (C0 + C1); as the distance increases, the amount of semivariance increases, up to a maximum value at which it stabilizes, named the range (a) and this is the spatial dependency threshold distance, which represents the radius of a circle, wherein values are so similar that they become correlated, as described by [8,9].
The nugget effect refers to the semivariance value for zero distance and represents the random variation component; the sill variance refers to the semivariance value at which the curve stabilizes on a constant value, and the range refers to the distance from the origin to where the level reached steady values, expressing the distance beyond which the samples are not correlated [7].
The adjustment of the semivariogram models was chosen according to the methods of OLS (Ordinary Least Square) or of REML (Restricted Maximum Likelihood). The models tested were the spherical, exponential and Gaussian.
For the analysis of spatial dependence degree (GDE), as proposed by [10], we used the ratio C/(C0+C1), and the proposed ranges: strong spatial dependence (GDE < 25%); moderate dependence (25 < GDE < 75%); weak dependence (GDE ≥ 75%).
After the semivariogram adjustments, interpolations were carried out by ordinary kriging, which allows the display of spatial distribution patterns of the noise level inside each shed. According to [11], kriging is the interpolation method used in geostatistics to predict the value of a variable from a location not sampled through information obtained from the sampled data and spatial dependence expressed in the semivariogram between neighboring samples.
The R software was used [12], through the package geoR [13] to accomplish the semivariogram adjustment, and also the interpolation by Kriging. With the interpolated values, it was possible to carry out the preparation of the noise level spatial distribution maps, using the SIGMAPLOT® 12.0 program.
3. Results and discussion
A descriptive analysis of the data are presented in Tables 1 and 2, the average noise level values within the SPAD and SNEB sheds housing birds were seen in the bands from 67.15 to 69.20 dBA and 67.82 to 71.18 dBA, respectively. The difference above 2.0 dBA between the average minimum and maximum value recorded within the evaluated sheds shows the inhomogeneity of the data in the direction of the length of each shed, and may indicate spatial dependence between the points recorded. Noise levels during decontamination period (DP) inside these sheds, were lower than 40.1 dBA, the sound pressure level of the birds and the ventilation and cooling system in each shed had an average increase of 28.0 dBA.
Table 1 Descriptive statistics for noise level in dBA, within the SPAD shed throughout the study period and during clean and disinfect the sheds (decontamination period - DP).
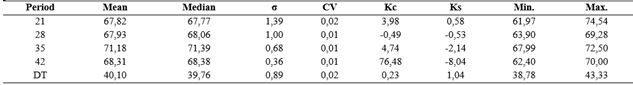
Legend: σ = Standard deviation; CV = coefficient of variation; Kc = coefficient of kurtosis; Ks = coefficient of skewness; Max. = Maximum value; and Min. = minimum value.
Source: The authors.
Table 2 Descriptive statistics for noise level in dBA, within the SNEB shed throughout the study period and during clean and disinfect the sheds (decontamination period - DP).
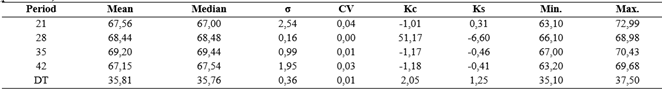
Legend: σ = Standard deviation; CV = coefficient of variation; Kc = coefficient of kurtosis; Ks = coefficient of skewness; Max. = Maximum value; and Min. = minimum value.
Source: The authors.
Evaluating a commercial shed for the production of broiler chickens with conventional ventilation system and evaporative cooling, [5] found average values of noise level equal to 72.1 dBA with the ventilation system switched on. Assessing the conditions of the acoustic environment in a broiler production shed using a tunnel type ventilation system, [3] found a mean value close to those observed in this study that was 69.0 dBA.
The highest coefficient of variation (CV) was found after 21 days (0.04%). This effect is due to the wide variation in noise levels inside the SPAD shed, probably due to increased activity of the birds, the ventilation system, and wind action on the curtain and vegetation in the environment outside the shed.
The sound pressure levels within each poultry shed over the period evaluated with ventilation and cooling system connected showed little difference between the mean and median values. Virtually all periods showed negative skewness, and the only periods presenting positive symmetry were at 21 days and clean and disinfect period. This shows that most of the data tends to have a normal distribution.
According to the geostatistical analysis, all days evaluated showed spatial variability of noise levels within each poultry shed, expressed by semivariogram (Table 3). This result allows us to infer that during the analysis period, the noise levels from the birds and the ventilation system in each shed ensured the inhomogeneity of the spatial distribution of the sound pressure level inside each shed.
Table 3 Method, model and estimated parameters of the experimental semivariogram for noise level inside the SPAD and SNEB sheds throughout the production cycle of birds and the decontamination period (DP) of the sheds.
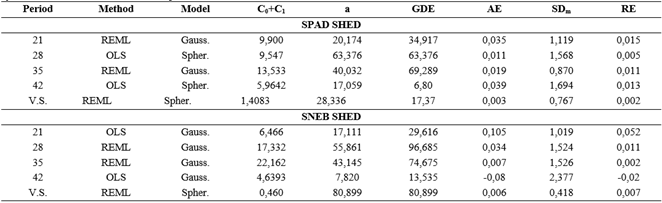
Legend: C0 = Nugget effect; C1 = Spatially dependent component; C0 + C1 = sill variance; a = range; GDE = Spatial dependence degree; AE = Average error; SDm = Standard Deviation of Mean Error; RE = Reduced error.
Source: The authors.
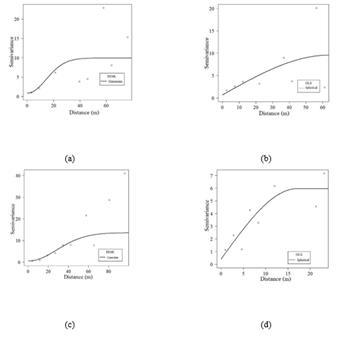
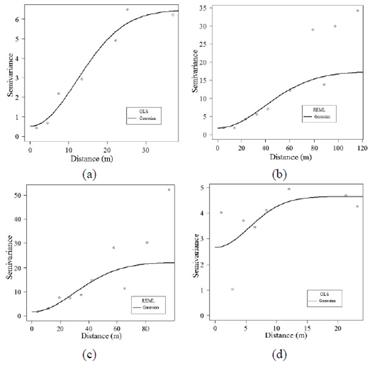
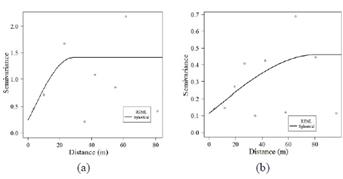
In Figs. 2, 3 and 4 are the semivariograms of the noise levels assessed in sheds SPAD, SNEB, and during the period of decontamination period (DP) the sheds, respectively.
Source: The authors.
Figure 2 Semivariogram noise levels in the SPAD shed for birds of: (a) 21 (b) 28 (c) 35 and (d) 42 days of life.
Source: The authors.
Figure 3 Semivariogram noise levels in the SNEB shed for birds of: (a) 21 (b) 28 (c) 35 and (d) 42 days of life.
Source: The authors.
Figure 4 Semivariogram noise levels during decontamination period (DP) of the sheds: (a) SPAD and (b) SNEB.
The method that most fitted the semivariogram of the variable studied was the Restricted Maximum Likelihood (REML), as observed in Table 3. But the method of Ordinary Least Squares (OLS) fitted only for the noise in the SPAD shed on days 22 and 42 and the SNEB shed on day 42. For almost all days evaluated, noise levels in the SPAD and SNEB sheds fitted the Gaussian model (Table 3). The spherical model was fitted to the noise level in the SPAD shed with birds 28 and 42 days old and the cooling system working. It was also observed that this model fitted for the SNEB shed during decontamination period (DP).
According to the criterion presented by [10], only the noise level in the SNEB shed with birds 42 days old and ventilation and cooling system running showed moderate spatial dependence; while the others showed strong spatial dependence.
An important parameter in the study of semivariograms is the range, which means the maximum distance that a variable is spatially correlated, ie determinations at distances greater than the range are randomized and therefore are independent and classical statistics must be applied.
The range of an attribute ensures that all neighbors (within a circle with this radius) are so similar that they can be used to estimate values for any point between them. The lower range value was 7.059 m for the SPAD shed with birds 42 days old, and the highest for decontamination period in the same shed SPAD (Table 3). The other evaluation periods can be divided into two groups with close ranges: a) SPAD shed in the period 21 of bird life and in decontamination period presented a range between 20.174 and 28.336 m; and for a period of 35 days of life of the birds, of 40.032 m; b) SNEB shed with birds of 21-35 days of life showed ranges between 17.111 and 55.861 m.
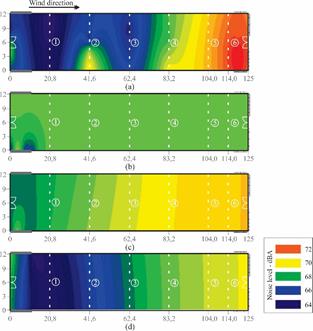
In Figs. 5, 6 and 7 are the maps of the spatial distribution of noise levels in the SPAD and SNEB sheds during the production cycle of the birds and in decontamination period (DP) obtained by interpolation from ordinary kriging.
Source: The authors.
Figure 5 Noise level inside the SPAD shed at different ages of the birds: (a) 21 days, (b) 28 days (c) 35 days and (d) 42 days.

Source: The authors.
Figure 6 Noise level inside the SNEB shed at different ages of the birds: (a) 21 days, (b) 28 days (c) 35 days and (d) 42 days.
Source: The authors.
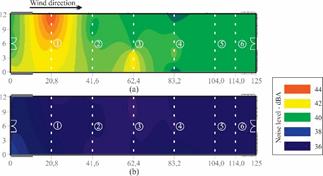
Figure 7 Noise level inside in the sheds (a) SPAD and (b) SNEB during decontamination period.
In general, it is observed that the highest frequencies of noise levels inside the SPAD shed and SNEB with poultry housed therein concentrate between 65 and 75 dBA, which can be viewed spatially in Figs. 5 and 6, respectively. It is noteworthy that the highest noise levels were observed close to the fans. On the other hand, during the decontamination period the highest frequency in the noise levels inside these sheds ranged between 35 and 45 dBA, as can be seen in Fig. 7. Basically, these noises come from the animals themselves, fans and power supply, and inevitably there was the noise contribution resulting from the action of wind on the curtain and vehicles near the sheds. The fact that the ventilation and cooling systems present inside each shed interfere with the spatial distribution of noise level is obvious. There was also greater variation in noise levels in the sheds where the birds were younger, the extremes having the highest values; this may have happened due to greater interference from the external environment with the sheds.
The authors [14] evaluating and comparing the screen surrounding the perimeter of use of conventional laying sheds on the acoustic environment inside the plant, observed noise level of 64.3 dBA.
Evaluating the acoustic environment in a pig nursery, [15] observed noise level peaks inside the shed evaluated as being due to dividers between pigs, interference of pigs screaming in other sheds, employee activities and a faucet that presented a leak. [16,17] emphasized the interference of external activities and/or interaction of the handlers as a form of noise level change for animals, housed or not, which is a natural response to the unknown.
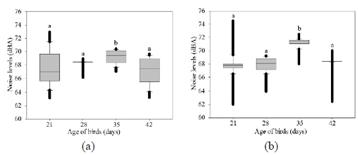
According to the Tukey test (p≤0.05) there was clear evidence for rejecting the hypothesis that the noise intensities between the different ages are equal in the sheds SPAD and SNEB. Thus, there was no statistical difference, from Fig. 8a and 8b, between the noise levels at 21, 28 and 42 days of life for birds in sheds SPAD and SNEB (Tukey test, p> 0.05). The biggest difference of variation in noise levels for birds with 35 days of life occurred in both evaluated sheds. This, in turn, may be due to the thermal environment suffered by older animals where there was a greater need to maintain the thermal environment in the comfort zone inside the sheds, it being necessary in this case, to trigger the entire cooling system of the sheds, increasing further the level of noise in the environment.
Source: The authors.
Figure 8 Representative graph of the profile of average noise levels in the sheds (a) SPAD and (b) SNEB with birds of different ages. The means followed by at least one letter from the days of bird life for each shed do not differ by 5% of probability by the Tukey test.
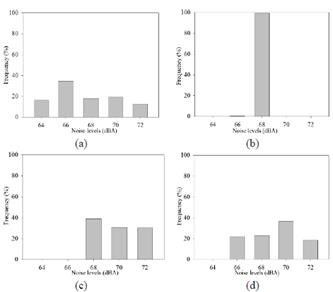
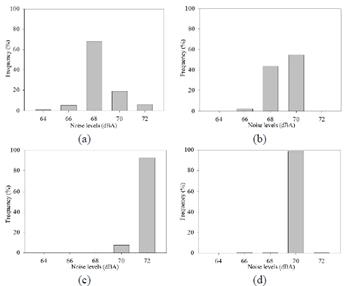
In Figs. 9, 10 and 11 can be observed frequencies of noise levels of occurrences for the interval 64-72 dBA in SPAD and SNEB sheds during the production cycle of the poultry and decontamination period, respectively, obtained after interpolation by ordinary kriging.
Source: The authors.
Figures 9 Occurrence Frequency (%) of noise levels for the intervals 64 - 72 dBA in the SPAD shed obtained after interpolation by ordinary kriging, for birds of: (a) 21 days, (b) 28 days (c) 35 days and (d) 42 days of life.
Source: The authors.
Figures 10 Occurrence Frequency (%) of noise levels for the intervals 64 - 72 dBA in the SNEB shed obtained after interpolation by ordinary kriging, for birds of: (a) 21 days, (b) 28 days (c) 35 days and (d) 42 days of life.
Source: The authors.
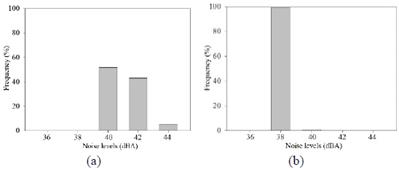
Figures 11 Occurrence Frequency (%) of noise levels for the intervals 36 - 44 dBA in the sheds (a) SPAD and (b) SNEB obtained after interpolation by ordinary kriging, during decontamination period.
The analysis of the frequency of occurrence (Figs. 9 and 10) in sheds SPAD and SNEB shows that the birds remained subject to an environment with noise higher than 68 dBA. Throughout all these days, the noise level in the shed shown SPAD was 68 dBA (44.7%), followed by 70 dBA (21.6%).
However, in the SNEB shed the noise level most evidenced was 70 dBA, with 44.8% frequency of occurrence throughout all the study period. On the other hand, during the decontamination period (Fig. 11), it was observed that the noise level with the higher frequency of occurrence in the sheds SPAD and SNEB remained at 40 dBA and 38 dBA, respectively.
4. Conclusions
Birds housed inside the sheds studied were submitted to average noise levels of 62.0 dBA. During the decontamination period the average noise level was 35.0 dBA;
Most attributes showed low coefficient of variation (CV), with the highest value for birds of 21 days, 0.04%, and the lowest for birds of 28 days, 0.00%, in the SPAD shed.
It was possible to identify the magnitude and spatial dependence for every day in this study by analyzing the noise level semivariograms in the production environment of the birds.
The interpolation by ordinary kriging allowed visualization of the spatial distribution of noise level in the production environment of birds that allowed more detailed information to be obtained on the two cooling systems studied.

