


 Inglés (pdf)
 Articulo en XML
 Referencias del artículo
 Enviar articulo por email
 Citado por SciELO
  Citado por Google
  Similares en
SciELO
Similares en
SciELO  Similares en Google
 Permalink
1. Introduction
Irrigation is a technique that allows farmers to provide food for large populations, but it also consumes large quantities of water and energy. The amount of water lost through this process is affected by irrigation system design and irrigation management. However, optimizing the use of water is one way to reduce irrigation costs. Irrigation scheduling, which is the process of determining when to irrigate and how much water to apply, if done prudently, minimizes runoff and percolation losses, which in turn usually maximizes irrigation efficiency by reducing energy and water use. Soil moisture monitoring is a necessary safeguard to assure that soil moisture levels are adequate [1,2].
Monitoring soil volumetric water content (VWC) and its availability are needed to support plant growth and characterize soil water evaporation. There are several methods available that can estimate in situ soil water content. These methods include time domain reflectometry (TDR), Reflectometry Frequency Domain (FDR), neutron probe, and tensiometers [3-6]. The gravimetric method, which is the oldest method, is disadvantaged by the time and effort required to obtain data, and it does not allow for real-time measurement of water content. However, it continues being widely used for obtaining soil moisture data; it is required for calibrating the equipment used in the other methods because it is the only direct way of measuring soil moisture, and is also the most accurate method [7]. However, non-destructive monitoring methods have become increasingly required for environmental evaluation, precision agriculture, and natural resources management [8]. For this reason, several studies have been performed on instruments for indirect measurement, but few have been conducted for specific soils in Brazil.
ECH2O probes are capacitance sensors that measure the volumetric water content of the soil by measuring the dielectric constant of the soil, which is a direct function of water content. However, soils do not have identical electrical properties. Due to variations in soil bulk density, mineralogy, texture, and salinity, specific mineral calibration for current ECH2O sensors is necessary [9].
Temperature effects on dielectric permittivity measurements are significant under field conditions and occur especially in the upper soil horizon where the soil temperature is influenced by diurnal and seasonal temperature fluctuations [10].
The EC-5 is part of the ECH2O group of Decagon Devices and was developed to be much less sensitive to variation in texture and electrical conductivity because it works with a frequency of 70 MHz. Therefore, its general calibration equation should apply for all mineral soils up to 8 dS m-1 saturation extract [11].
The need for a specific calibration of the sensor for each site is one the most important reasons why the use of this equipment is not more widespread. In addition to the time and effort required, they can be expensive for the farmers. One option is that laboratory calibrations be conducted on typical agricultural soils. This will allow farmers to use more accurate calibration equations than those specified by the manufacturer, tailored to the general type of soil that they are farming. And it will restrict the need for site-specific calibration to only extreme instances of soil abnormality [12]. Sandy soils are extensively distributed in Coastal Tablelands ecosystems in Northeast Brazil. Despite the difficulties involved in utilizing sandy soils, this region is among the top-ranked regions for agricultural production in Brazil.
The ECH2O EC-5 sensor is a promising soil moisture sensor for sandy soils. Our objectives were to: (1) evaluate the accuracy of EC-5 for measuring soil water content in sandy soils, and (2) develop soil-specific sensor calibration curve.
2. Materials and methods
This study was carried out in a greenhouse at the Federal Rural University of Pernambuco, in Northeast of Brazil (08° 01’ 07” S, 34° 56’ 53” W, and mean altitude of 6,50 m). According to the Köppen classification, the climate of this region is As, with annual average precipitation of 1,501 mm, average temperature of 26ºC, and relative humidity of 76%.
Disturbed and undisturbed soil samples were collected at Goiana City (07o 37’ 30’’ S, 34o 57’ 30’’ W), which is representative of sugarcane grown in Coastal Tablelands ecosystems, in the Experimental Station of Itapirema belonging to Agronomic Institute of Pernambuco (IPA). This soil was classified as Spodosol Humiluvic orthic [13], which is very sandy (sand = 859 g kg-1; silt = 25 g kg-1; clay = 116 g kg-1). Both disturbed and undisturbed soil samples were taken from the upper 40 cm. Undisturbed samples were collected in stainless steel cores (5 x 5 cm, inside diameter and height) inserted into the field by an Uhland-modified sampler. Disturbed soil samples were air-dried and ground to pass through a 4.75 mm sieve, then packed in six 5.00 L volume plastic containers. A gravel layer and drainage fabric were put in the bottom of each container, leaving 4.66 L volume available. The samples were saturated by capillarity and then put on a table for water drainage until they reached a field capacity, when they were weighed. One EC-5 sensor (Decagon Devices, Inc.) was placed vertically into each container together with the soil material. A specific amount of soil was prepared for each container to obtain the same bulk density as was measured in the undisturbed soil samples (1.56 g cm-3). Each probe was connected to a EM50 (Decagon Devices, Inc.) to record data daily at 7:00am, 12:00pm, and 4:00pm over 37 days, up to when the difference between successive weight measurements remained constant. As recommended by manufacture, ECH2O Utility software was used to connect and configure EM50. This software allows the user to select the output unit of the sensor measurements (mV, m3 m-3, cm3 cm-3, %, inches per foot). In this work, we chose m3 m-3, which is volumetric water content measured by the sensor and based on the manufacturer’s calibration equation.
In addition to volumetric water content (not discussed in this study), the 5TE sensor (Decagon Devices, Pullman, WA) provides data on soil temperature and electrical conductivity. Three sensors were inserted vertically into three containers to measure temperature and electrical conductivity hourly. These sensors were connected to an EM50 as well.
Gravimetric method, which is the only direct reference method for the calibration process of this sensor, was used to determine volumetric soil water content by eq. (1):
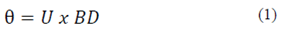
Where: θ is volumetric soil water content, expressed in m3 m-3; U is gravimetric soil water content, expressed in kg kg1; and BD is bulk density g cm-3.
Linear regression fits were then used to relate measurements of obtained volumetric soil water, Y (m3 m-3), and volumetric soil water estimated by sensors, X (m3 m-3), based on manufacture calibration. Data were analyzed and interpreted by analysis of variance and regression analysis. A 0.05 significance level was used in all statistical tests.
Four statistical measures were computed to evaluate and compare each equation-predicted value (sensor) with the observed value derived from gravimetric moisture taken from the laboratory soils. These included the coefficient of determination (R2), mean bias error (MBE), root mean square error (RMSE), and the index of agreement (d) as defined by [14] and shown in eq. (2).
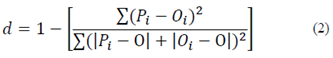
Where: Pi is the estimated value, Oi is the determined value, and O is the mean determined value.
3. Results and discussion
According to the F-test in analysis of variance (ANOVA), measured VWC and EC-5 estimated VWC, as calibrated by the manufacturer, were significant as shown Table 1.
Table 1 Variance analysis of measured VWC and EC-5 estimated VWC, as calibrated by manufacturer.
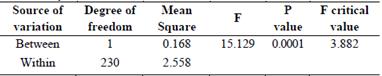
Source: The authors.
However, Table 2 shows there were no significant differences by F-test in ANOVA between measured VWC and EC-5 estimated VWC, calibrated with the laboratory equation.
Table 2 Variance analysis of measured VWC and EC-5 estimated VWC, calibrated by laboratory equation.
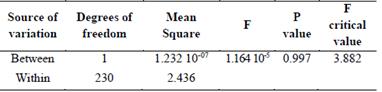
Source: The authors
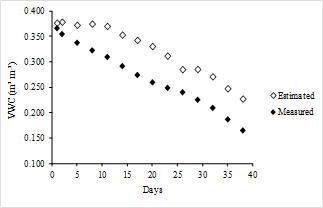
The loss of soil water by natural drying is shown in Fig. 1. The figure shows soil moisture average in the six containers, according to readings of the six EC-5 sensors and also the gravimetric data, which were converted to volumetric water contents using the soil bulk density.
Source: The authors.
Figure 1 Depletion of soil moisture (drying curve) estimated by EC-5 sensor (according to manufacturer's calibration) and measured gravimetrically (converted to volumetric soil water content) during the monitored period.
In the evaluated moisture range, the moisture values obtained using the manufacturer’s calibration were overestimated, relative to those obtained by weighing. The mean estimated value ranged from an initial volumetric moisture 0.377 m³ m-3 to a maximum of 0.067 m³ m-3. The mean determined value, however, ranged from 0.367 m³ m-3 to 0.0314 m³ m-3.
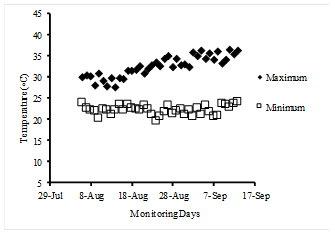
A linear calibration equation, here referred to as the ‘laboratory calibration’ of θ, was developed for EC-5 sensor by plotting the probes readings versus the θ derived from the gravimetric method. The equation was developed using the Microsoft Excel® Regression which is showed in eq. (3) below.
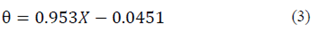
Where: θ is expressed in m3 m-3; 0.953 (slope) and -0.0451 (intercept) are fitted coefficients; and X is the sensor-based factory calibration of θ (m3 m-3).
Measured data and the resulting laboratory calibration equation are shown in Fig. 2.
Source: The authors.
Figure 2 Comparison between factory-calibrated and laboratory-calibrated θ estimated by the EC-5 sensor.
The laboratory calibration equation reflects that the variables explained 98.81% of the variability in the a and b parameters and very good correlation was obtained. The laboratory calibration of θ for the EC-5 sensor closely matched the one-to-one line. This suggested an accurate calibration for the sandy soil, with some scatter at the higher water content range (0.310-0.366 m3 m-3). The difference between soil water content predicted by specific calibration and gravimetrically derived volumetric soil water content ranged from 0.018 to -0.052 m3 m-3, where the positive values demonstrate overestimation of the moisture by the adjustment equation and the negative ones show the inverse. These results agree with [15], which showed a linear soil-specific calibration for sandy clay loam soil using a 5TE sensor.
The factory calibration applied to the data collected from the EC-5 sensors overestimated θ by 0.090 m3 m-3 (MBE), and resulted in an RMSE of 0.06 m3 m-3. However, laboratory calibration improved accuracy at EC-5 in this soil, with a lower RMSE (0.01 m3 m-3) and a higher index of agreement (d=0.9770), which reflects the high accuracy with which the determined volumetric moisture is estimated by the specific calibration. This is in agreement with findings made by [15] that the factory calibration for the 5TE also overestimate θ mainly at the large water contents and field based calibration equation is satisfactory to achieve the required accuracy of this sensor.
Soil texture has important role in temperature and water content variation. In sandy soils surface is not recommended the use of moisture soil sensors, due to the largest fluctuations of parameters. It is also suggested that users of the probes perform their own calibration for their particular application [3].
It is evident that sensor requires unique calibrations for the soil and conditions in which it will operate. Then, it is recommended that laboratory calibration be developed, over factory calibration, since soil specific data are more representative.
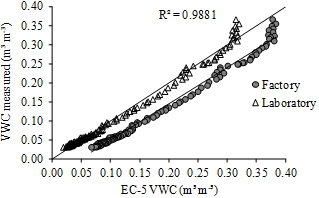
The maximum soil temperature ranged from 27.6 to 36.4ºC, while the minimum ranged from 19.6 to 24.2ºC. Fluctuations in the maximum temperatures were higher than in the minimum, which were more homogeneous (Fig. 3).
Saline soils have an electrical conductivity of saturated extract (ECse) ≥ 4.0 dS m-1 [16]. In this study, Spodosol mean electrical conductivity estimated by the 5TE sensor was 0.030 dS m-1, thus it is not considered saline soil and the probe can be used.
4. Conclusions
This research evaluated the performance of EC-5 soil water content sensor since saturation to drier range, under laboratory conditions for Spodosol which is representative of sugarcane grown in Coastal Tablelands ecosystems.
The EC-5 sensor for measuring soil water content tested in this study appeared to be very sensitive and suitable for continuous measurements soil water content.
The study of the EC-5 has shown that factory calibration of the probe overestimated the volumetric water content and therefore should be substituted by a laboratory calibration.
When fitting the EC-5 sensor readings versus the θ derived from the gravimetric method obtained very good correlation with linear equation (R2 = 0.9881).
Acceptable sensor error for these tests was set to less than 0.011 m3m-3 for the RMSE.

