


 English (pdf)
 Article in xml format
 Article references
 Send this article by e-mail
 Cited by SciELO
  Cited by Google
  Similars in
SciELO
Similars in
SciELO  Similars in Google
 Permalink
1. Introduction
Brazilian industries are facing enormous challenges with the globalization of markets, especially owing to massive technological advances made by developed countries, high competitiveness coupled with low production costs of Asian countries, and European market oscillation. In response, Brazilian industries have sought to optimize resources to increase performance by seeking higher operator efficiency and greater asset availability, along with low production costs [1].
Electric power distribution is one of the most important services provided for the population because it is a crucial resource for development [2]. Thus, electric power companies are seeking cost reduction as well as greater quality and reliability for the services they provide [3].
In this context, members of transmission line (TL) maintenance crews in power distribution companies are challenged to maintain the TLs in a way that meets the requirements of the companies. Maintenance management must be strategic as it is vital for the survival and success of the organization.
Managers must have a clear view of the processes that are internal to maintenance and promote integration among these processes. Many times, managers rely only on their intuition for making decisions [4]. For a maintenance crew to succeed in this new environment, it is crucial that these decisions are not based solely on the tacit knowledge and experience of the team.
In addition, following new resolutions by the Brazilian National Agency for Eletricity (ANEEL), the maintenance areas of electric power distributors were assigned top priority for inspection. Accordingly, companies are increasingly required to provide clarification for any event or anomaly that occurs during operations in their power transmission and distribution systems [5]. Economic sanctions have been imposed in cases of irregularities or negligence found during maintenance inspections. This is the greatest challenge faced by the maintenance company that is the subject of this study. Our research deals with the type of maintenance to be used, the planning actions to be taken, as well as which TL, each with its own characteristics, should be prioritized, and the systematic and impersonal manner in which all these decisions are made.
This work is justified because the company currently has no method to determine which TL is in a more critical condition and which failure mode presents the highest risk compared to the others. Considering the literature, there are techniques and tools that can help maintenance managers make better decisions and not to depend solely on subjective beliefs. The use of different failure analysis tools enables a broader approach because each one has attributes which make the analysis more robust and the result is an effectively managed analysis [6]. This study is also justified by Fabro’s statement [7] that developing tools for maintenance decisions that require more than one procedure to select critical processes is one way to achieve a better operational result and reach objectives required by the task.
Hence, the general objective of this study is to propose a support tool for maintenance decisions based on failure and criticality analysis. This study also includes the following specific objectives: (i) identify the failure modes in electric power TLs considered to be the most important by specialists; (ii) create a criticality index that considers and analyzes the most relevant aspects of the different power TLs, according to the criteria used by specialists; and (iii) present a decision-making instrument addressing the main impacts of the failures in each TL.
2. Methodology
The work method used for this research is shown in Fig. 1.
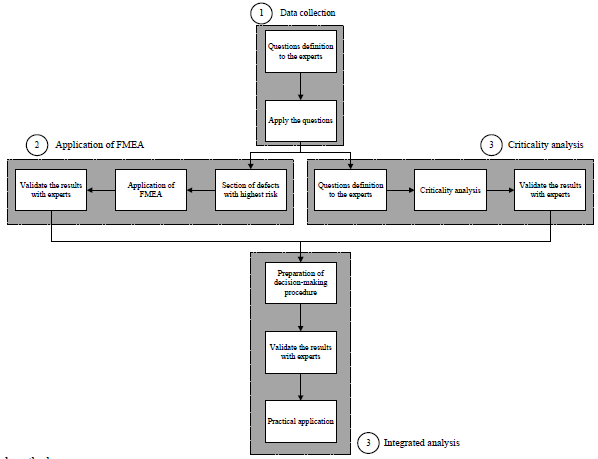
In the first step, data were collected regarding failure and criticality modes in the TL. In that regard, the specialists answered two research questions to detect which defects pose the most risk and cause the most negative impact for the TL, and identify the employee-based criteria to be used for the criticality analysis. Their answers provided valuable information for elaborating a failure analysis and establishing criticality criteria, which were the basis for the construction of steps two and three
The second step consisted of mapping and classifying which defects, among those pointed out by the team in the first step, pose greater risks and cause more negative impact for TL maintenance. Failure Mode and Effect Analysis (FMEA) was used to carry out this analysis, as presented by previous authors [10-13]. Thereafter, the elaborated FMEA was presented to other specialists to confirm if the results are representative and consistent with real situations faced by the team.
The third step was analyzing the criteria that were mapped in the first step and establishing the criticality of the TL utilizing a method employed by many researchers [7,8,14-16]. The Mudge numerical evaluation of functional relationships was used to define the hierarchy of the criticality criteria, and the evaluation was carried out together with two experts from the area. After the weights of each criterion were defined, the Multi-Attribute Utility Theory (MAUT) technique was used in three TLs under the responsibility of the sector. The lines chosen for the study have different characteristics and importance already known by the experts, making it easier for the study to be approved later. The last part of step three was to present the results of the MAUT to other specialists to confirm if they are representative and consistent with real situations faced by the team.
With the results of the FMEA and criticality analysis, the fourth and final step was a flowchart that integrated both tools and guided the specialists to select a system based on the type of conditions in the TLs, whether they are failures or anomalies. This flowchart was analyzed and approved by specialists aiming to determine if there is adherence to the daily practices of the maintenance team.
3. Results and discussion
3.1. Description of the company and the sector
The company is a public service concessionaire for electric power distribution services in the south-southeast region of the state of Rio Grande do Sul, Brazil. The concession area includes the metropolitan, south, coastal areas, and the countryside. The company provides for 72 cities, covering 73,627 km², which corresponds to approximately 34% of the consumer market of Rio Grande do Sul, through its 72,138 km of urban and rural networks. The company provides electric power for 1.6 million consumer units, which is equivalent to about 4.8 million people or a third of the population of the state of Rio Grande do Sul.
The sector under study is responsible for the maintenance of TLs in the cities of Porto Alegre, the metropolitan area (Viamão, Cachoeirinha, Alvorada, and Gravataí), and the coal region (Charqueadas, Guaíba, Minas do Leão, São Jerônimo, Camaquã, and Encruzilhada do Sul). The crew comprises 12 professionals, including engineers, technicians, and technical assistants. The staff has, on average, 12 years of experience in TL maintenance activities.
3.2. Data collection of TL failure modes and criticality
Initially, the experts in the sector who were consulted for the study answered two questions. These questions were designed to investigate and understand which opinions and criteria are used by professionals on crucial decision-making occasions, and how they prioritize interventions and maintenance actions in situations they face daily in their work. The justification for these questions is that currently decisions are based on the technicians’ individual and implicit knowledge. However, based on the responses to the questions and by using appropriate tools, these decisions can be replaced by consensual decisions based on collectively constructed knowledge. The questions are:
What are the criteria used to determine which TL is most critical among those that are under your responsibility?
Among the defects in the TL, which ones pose the greater risks?
The 12 professionals consulted for the study answered the two questions. It should be noted that there were no restrictions on the number of responses that each specialist provided, and the criteria mentioned by the experts are based on a series of internal company rules as well as ANEEL regulations.
The most common answers to question (a) are shown in Table 1.
Based on Table 1, the team believes that the most important criterion among those analyzed is the risk to the population, which indicates that there is a safety concern. The most common answers to question (b) are shown in Table 2.
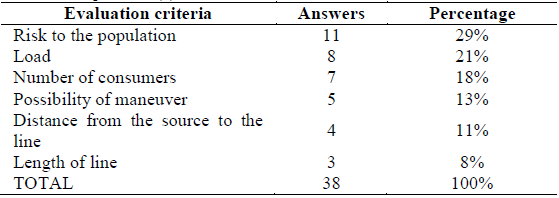
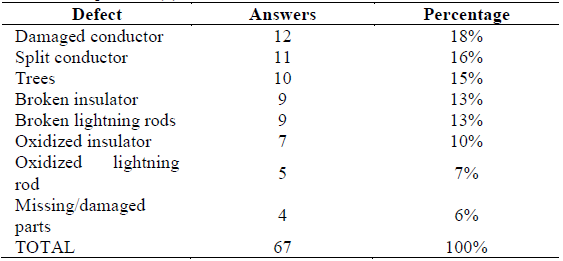
Table 2 shows that the defects that pose the greatest risk are those that concern conducting power (conductors), with the most votes given to damaged conductor, split conductor, and trees in the service area. With these answers, it was possible to verify through the perception and experience of the team which defects pose the highest risk and which criteria are used empirically when deciding which TL is in a more critical condition.

3.3. Elaboration of FMEA
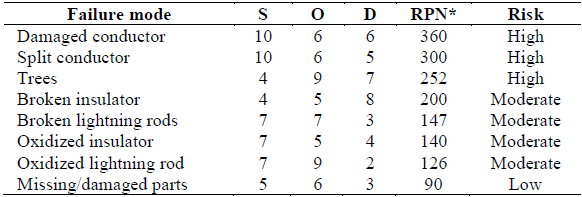
Based on the answers to question (b), a list of defects was created that, according to the specialists, pose greater risks. Thereafter, the FMEA was elaborated and applied. This analysis, which was carried out in three sessions of approximately one hour each, had the participation of two specialists from the sector who were responsible for the tasks of managing and programming field activities. The reference values adopted for determining the Severity (S), Occurrence (O), and Detection (D) in the FMEA follow a model by Leal et al. [2]. The classification of each failure mode is presented in Table 3.
The relationship between the risk priority number (RPN) and the associated risk that was adopted was based on an internal company regulation, which is presented in Table 4.
The results of the study (Table 3) showed that the failure mode that presents the highest risk was the damaged conductor (with an RPN of 360), which is a high-risk failure mode. The failure mode that presented the lowest risk was missing/damaged parts, which is considered to be a low-risk failure mode.
After the FMEA, the results were presented to other experts for approval. According to the team, some limitations were detected regarding the use of FMEA, specifically with respect to TLs. For example, it has been found that there are some failure modes that do not occur frequently; thus, they have a low occurrence rate. Because only severity, detection, and occurrence values are multiplied when determining the RPN, these failure modes will present a low RPN, which is not realistic because they are considered by the team to be extremely critical. In addition, there are some failure modes (e.g., split conductor) whose detection rate cannot be previously determined because they are caused by weather events and other unpredictable scenarios, such as lightning, traffic accidents, and vandalism. Thus, these failure modes occur abruptly with no opportunity to track symptoms that evolve until the failure occurs. In contrast, failure modes related to oxidation and wear may have their symptoms tracked over time. Thus, for failure modes where the detection index cannot be clearly determined, some adjustments and even some changes in the conventions for defining index reference values would be necessary. As one of the objectives of this study is to verify the usefulness of FMEA in TLs, adaptations and adjustments to the method will not be discussed.
Apart from these considerations, the results were well accepted by the team. There was agreement that the tool would be useful for mapping failure modes in TLs and their causes; hence, the team could work on coordinated actions to avoid these causes, such as preventive maintenance for failure modes with higher risk or thermographic inspections to predict anomalies.
3.4. Criticality analysis
Next, a list was created based on criteria that the experts indicated were the most important when choosing a TL, according to their answers to question A in step one. Initially, the Mudge method was applied to compare the criteria. The experts, after having the process used to elaborate the Mudge matrix explained to them, were asked to apply the tool, comparing the criteria (Table 5) to establish a scale of importance
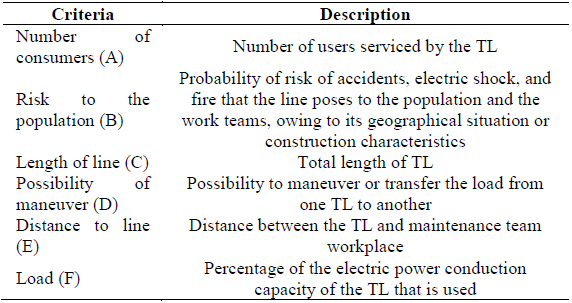
Based on the criteria presented in Table 5 and with the participation of two specialists responsible for the tasks of managing and programming field activities, paired comparisons were made between the criteria; the results are shown in Table 6.
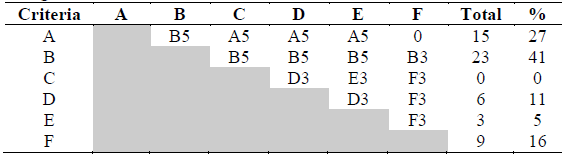
The study found that the most important criterion is the risk to the population with a weight of 41%, as shown in Table 6. The other results were presented to the team of experts who agreed with the hierarchy resulting from the analysis. The fact that the TL length criterion (Table 5) has a weight of zero was also discussed. Initially, this criterion was going to be excluded. However, the team understood that this zero-weight value indicates that the criterion is less important compared to the others; however, it does not mean that it can be disregarded when deciding which line to service in a failure situation.
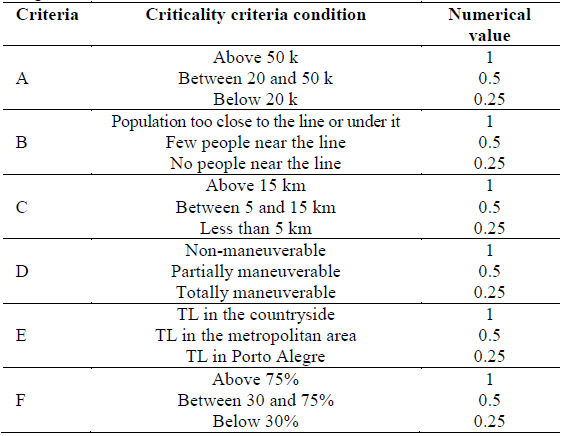
A MAUT was structured using the weighted criteria as a basis for making decisions about which TL among those being analyzed is in a more critical condition. Three TLs with different characteristics, and which were well known to the specialists, were chosen to be part of the MAUT to test the effectiveness of the tool when compared to the decisions that would usually be made in the same situations. Table 7 presents the criteria together with their specific conditions and the weights assigned to each according to their characteristics. The MAUT was constructed based on average values for each criterion and condition, which were extracted from the database of the sector and which contain the construction characteristics of the TLs under the sector’s responsibility.
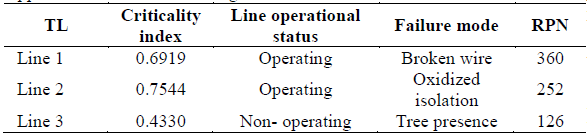
To verify if the proposed model was coherent with the experience of the company, it was applied to three TLs whose characteristics are described in Table 8.
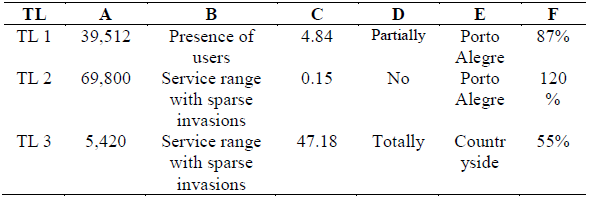
The MAUT was then applied to the TLs described in Table 8 following classification of the criteria and their respective weights as described in Table 7. The results of the MAUT are presented in Table 9.

It was found that the most important line among those studied was TL 2 with a criticality index of 0.7544. Although TL 1 presented a greater risk to the population than line 2, it was considered to be less critical because it had a smaller number of users and a lower load than line 2. The team of experts judged the results as satisfactory. In this way, the developed system enabled a decision to be made in a simple and objective manner; without the tool, only professionals with years of experience and vast knowledge about the TL could make the same decision. The tool made it possible to transform the tacit knowledge of these professionals into explicit knowledge, making it accessible and easy to apply.
There are two very different situations: an anomaly detected in an operating line, a situation in which emergency corrective actions must be taken to reestablish the system as soon as possible; and an anomaly detected in a non-operating line, which characterizes a situation where preventive activities may be scheduled according to the severity of the problem. The flowchart in Fig. 2 shows a proposed system that guides professionals on how to use the tools developed during the course of this study to support maintenance decisions in both cases. The part of the flowchart that guides which steps should be followed when an anomaly is detected and the lines are operational was constructed based on studies by Macedo [8] and Leal et al. [2]. The part of the flowchart that states which steps should be followed when an anomaly is detected and the lines are non-operational was constructed based on studies by Macedo [8] and Casarotto and Kopittke [9]. In addition, both parts were complemented by the practical experience of two members from the team of specialists. This flowchart is based on the FMEA and criticality analysis developed in this study.
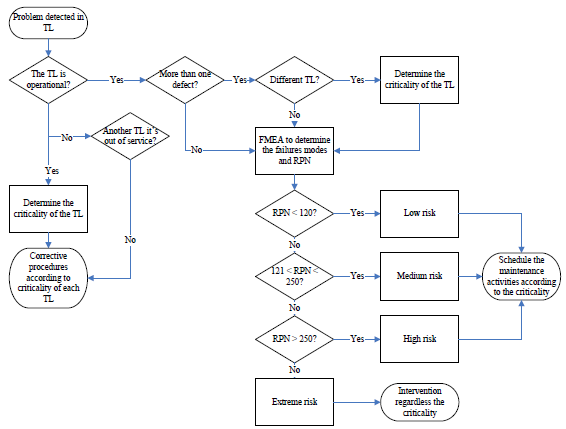
The system depicted in the flowchart in Fig. 2 begins when one or more anomalies are detected in a TL. It takes into account whether or not the line is operating to direct the decision-making to the other steps. The remaining steps are described in the body of the flowchart.
To validate the feasibility of the system, a number of real cases were selected for analysis from the company's database, as shown in Table 10.
Based on the data in Table 10 and following the system presented in Fig. 2, the decisions to be made as well as their order of service are shown in Table 11.
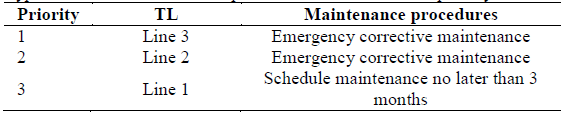
The flowchart in Fig. 2 and the results from the application of the system shown in Table 11 were presented to the other members of the team of specialists who agreed both with the developed system and with the results. Therefore, the procedure was considered very useful by the experts because, according to them, it clearly defines which tool and procedure to follow according to the current situation. In addition, decisions are no longer empirical and individual; they are based on collective knowledge, making the decision-making process standardized and impersonal. The result of this flowchart is a practical example of transforming tacit knowledge into explicit knowledge because, if applied, it would change the way decisions are made by professionals who, instead of acting by instinct, would develop an innovative new approach based on their own tacit knowledge acquired over years of work.
4. Final considerations
This study presented an alternative to systematic decisions once made based solely on the personal experience of each professional. The knowledge of people who work in the sector was used to understand which aspects they considered when making decisions regarding actions to keep TLs operational. With this knowledge, years of practice and errors were systematized into a simple tool which makes the decision-making process more secure and standardized by minimizing doubts and subjectivities.
The proposed tool can identify the failures that pose the greatest risk, investigate their causes and effects, and later recommend actions to minimize their impacts. It was also possible to understand, classify, and assign a hierarchy and relative weights for the criteria that the experts use when selecting the most critical TL; hence, their decisions were based on collective and standardized knowledge.


