


 Inglés (pdf)
 Articulo en XML
 Referencias del artículo
 Enviar articulo por email
 Citado por SciELO
  Citado por Google
  Similares en
SciELO
Similares en
SciELO  Similares en Google
 Permalink
1. Introduction
Evapotranspiration is a major component of the hydrological cycle with profound climatic implications. However, it is the component of hydrologic balance that represents more complexity since it is not possible to measure it directly. So, it is necessary to resort to other ways of estimating it [1]. Actual and potential evapotranspiration are estimated based on various methods that depend on other climatic variables such as precipitation, air temperature, dew point, atmospheric pressure, relative humidity and net solar radiation [2]. Although these variables affect direct evaporation [3], the transpiration of vegetation is also regulated by the characteristics of species. However, according to [4], transpiration is the main process in terrestrial water flows, so estimating biological flows is of great importance in hydrology, even over physical flows (evaporation) [4].
Scientific interest in measuring sap flow and in studying hydric relationships inside plants is not new. Since the beginning of the last century (there are reports from 1914, 1933 and 1940), colorants were used to trace sap flow in stems and roots [5]. The problem with such a use was that the stem had to be cut to measure sap flow. This changed in 1933, when the use of heat as a tracer to measure sap flow was first reported [5], and from there, methods have been improved to estimate plant transpiration accurately in living plants [5-10]. Heat pulse method (HPM) is one of the methods that have been used in the last years to estimate sap velocities and flows in plants, mostly in woody plants. Nevertheless, HPM is more favored due to its simple instrumentation and low power requirements, compared with methods based on continuous power emissions [11]. One of the last proposed methods is the heat ratio method (HRM) [11], whose added value consists of providing a high level of detail to low flows and even to inverse sap flows [12].
Sap flow velocities measurements are punctually made. There are several methods to extrapolate them at plant level [8], and subsequently, it is possible to escalate results at forest stand, basin, or ecosystem level, considering plant densities and species dominance [13,14]. Taken this into account, it is advisable to measure sap flow in several representative plants, trying to capture the natural variability related to site conditions and particularities of each individual. However, when scaling the results, there is an implicit error, which is amplified when dealing with areas with natural coverage composed of a diversity of species. On the other hand, it is possible to reduce the error if it is about plantations or crops that are monospecific and contemporaneous.
It is common to use datalogger devices to measure sap flow velocities continuously, such as CR1000 of Campbell Sci. Besides, the addition of multiplexors allows to increase the number of ports per datalogger (AM 16/32 of Campbell Sci.) [9,14,15]. Those devices are sturdy, reliable and are designed to field work, even under extreme weather conditions.
Because of the costs, it was necessary to consider alternatives for recording information in the field.
In Colombian market there are some free and low-cost hardware and software options such as Raspberry Pi, Arduino and Cubieboard; all of them offer different characteristics and costs, which vary according to the model, capacity and purpose of the board. After considering the technical specifications, the Arduino UNO microcontroller was chosen to perform the process of acquisition, conditioning and storage of the information, mostly due to its versatility and low cost.
Accordingly, a device to measure temperature inside the plant stems, which also generates the heat pulses following the HRM and stores the data, was designed and developed.
2. Methodology
2.1. Sap flow measurement from temperature
During the sap flow measurement using the HRM, wood and sap are heated by pulses, and advection, through the flowing sap stream, carries the heat to the upstream temperature probe, while the downstream probe is heated by diffusion. After some time, both temperature probes are heated, and the heat pulse moves a known distance from the heater, that is, from the midpoint between the probes.
The time taken for the heat pulse to move this distance is used to calculate heat pulse velocity [11] and, therefore, the sap flow velocity. In other words, the HRM measures the ratio of the increase in temperature, following the release of a pulse of heat, at points equidistant downstream and upstream from a line heater [11].
For estimating heat pulse velocity, three needles are inserted at the same distance among them, aligned with the axis of plant stem. Two of them are probes containing temperature sensors, in this case, Type T thermocouples. The heater is located between those probes. Each probe usually has three thermocouples, meaning that temperatures are simultaneously recorded at three different depths, from the cambium to the pith of the tree. Depth and number of thermocouples and their distribution inside the needle, depend on the width of sapwood of species measured.
Each thermocouple records temperature that varies in time, i.e., before and after heat pulse, but also, temperature varies in space, since heat is not transported at the same velocity inside all the sapwood. It is for this reason that using this method requires to multiplex ports to record data, since every thermocouple needs one port. Thus, a set of probes with three (3) thermocouples inside each probe has six (6) measurement points and, therefore, occupies six (6) ports to record and store temperature data (in ºC).
The result of sap flow velocity (in cm.h-1), calculated and corrected according to [11], might be used to estimate the volume of water moved through the plant by time unit, by using the area of sapwood in a transversal cut. To do so, it is assumed that the stem is a symmetric cylinder and that sap is mostly water.
2.1. Design and construction of thermocouples and heaters
Heaters and probes with temperature sensors can be built using easily accessible tools and materials commonly used in electronic industry, as shown in [16]. Besides lower costs, designing and building the probes has the advantage of flexibility to adapt them to the species characteristics to measure. The lengths presented in [16], the wiring and connections between probes and dataloggers/multiplexers are the standard used for woody species.
2.2. Device for temperature data record and store
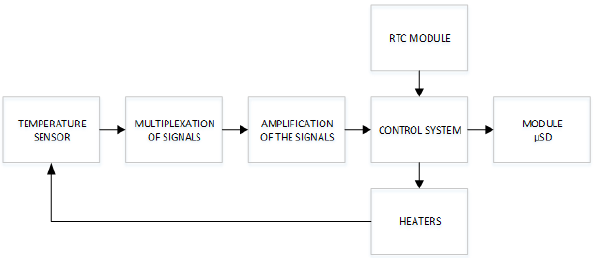
Fig. 1 illustrates the block diagram of the device, which was developed around the Arduino UNO microcontroller, which is a system in charge of three processes: acquisition of the temperature signal, storage of information and control of the heaters.
2.3.1 Acquisition of the temperature signal
The designed device allows to record temperature signal through eight ports, i.e. for eight (8) thermocouples. Temperature changes registered by thermocouples are commuted by the analog multiplexer CD4051. Due to the low amplitude of signals, it is necessary to amplify them with the AD594 instrumental and the MCP6041 operational amplifiers.
The CD4051 integrated circuit is an 8-channel analog multiplexer / demultiplexer, with three digital inputs that control the access of each of the signals. The mentioned device was chosen because it allows to expand the analog entries of the Arduino board, reduces the number of elements to be used in terms of amplifiers per each thermocouple. It supports a range of values in the input / output signals of 15V peak for analogic signals and between 3 to 15V for digital ones, and it does not require delays in the code between the select and read or write actions in a channel [17].
For the conditioning of the thermocouple, an AD594 is used, which is an instrumentation amplifier with cold junction compensation specific for thermocouples. This integrated circuit produces a high voltage output level from a linear proportionality of factor 10mV/ºC [18].
Considering that Arduino makes an analogic/digital conversion in its analog entries, which delivers a 6 bits data, and that the voltage differential given by the AD594 are very small, a MCP6041 operational amplifier is needed, which also has a stable unit gain, taking advantage of the maximum reading range of microcontroller. Such amplifier is suitable for a wide range of low power consumption applications [19].
2.3.2. Storage of information
The conditioned signals are received by the pin A0 of the Arduino UNO control system, which is programmed in such a way that, with the RTC-I2C-TINY module, stores the data, date and time of each measurement made in a micro SD memory.
Arduino has an internal clock which starts timing since the device is turned on. However, when the board is de-energized, the value is restarted, preventing the chronological storage of the information. Therefore, an external module is used to record the time. The device used is the RTC-I2C-TINY, which is a real-time clock based on the DS1307 chip [20]. This measures seconds, minutes, hours, days, months and years automatically [21].
To store the collected data, a micro SD module for Arduino is used. The data are stored in a flat text file with .txt extension, which allows to keep a large quantity of data in a small space, and facilitates reading, analyzing and editing of the content using different software [22].
Every time the micro SD memory is read, the board checks its status, in order to avoid an error. Also, if the memory is not inside the micro SD module, a led light turns on indicating the failure.
In order to use the mentioned modules, the code includes the libraries RTClib.h and Wire.h for the clock, SD.h for the micro SD memory, and the necessary coding lines for its proper functioning.
2.3.3. Heaters control
Following the HRM, the heaters must be turned on for a few seconds (usually four or five) every time a measurement is made, according to the values (of time) assigned by the user. Through coding, the Arduino sends a signal on high by the D6 pin to an NPN general purpose transistor configured as a switch [23]. The commuted signal energizes the coil of a relay, allowing the passage of current from the battery to the heaters, during the predetermined time. The coil of the relay is simultaneously connected to a resistor, a capacitor and an inversely polarized diode to protect the control element of the overvoltage caused by the coil when it is commuted.
2.3.4. Generalities
Because the system is connected to a 12V battery, it is ideal to decrease the voltage to 9V, considering the Arduino board tends to heat up when working with a higher voltage. The reduction can be made with a voltage regulator of reference LM7809 and with the capacitors indicated in the packaging datasheet. The latter are used to reduce the noise coming from the battery [24].
The microcontroller is connected to a computer through a USB port, using a USB cable type A/B. The prototype has a user interface that enables to easily change the sampling times and the duration of the heat pulse; in addition, it prevents the user from making changes in the code that may affect its proper operation.
2.2. Calibration
Some commercial dataloggers, such as the CR1000 from Campbell Sci., use reference sensors to convert the received signal directly into temperature. Therefore, the user receives the information in ºC without having to make any type of adjustment or transformation. On the other hand, the developed device, gets the information as an electrical signal and stores the values of the voltage delivered by the transducers. Thus, it needs to be calibrated by the user, in order to build an equation to transform the millivolts into temperature (in ºC). To build the equation, several simultaneous measurements are needed, both with the device and with a standard sensor that generates temperature data. In order to develop the previous calibration procedure, the environment conditions must be as similar as possible to those in which the measurements will be performed. Then, observations and measurements made with the device indicate that significant altitudinal and environmental changes modify the range of the recorded data of the developed device.
2.3. Test measurement of the devices in the field
In order to test the correct functioning of the developed device in field conditions, data were recorded for almost three weeks (between December 4 and 21, 2017) in a set of native species in Santa Elena. It is a village of Medellín, Antioquia, located at 2200 meters above sea level, with an average temperature of 14.5 ºC and an average relative air humidity of 89%.
Measurements were made in three (3) adult individuals, two (2) known as Arrayanes (Myrcianthes leucoxyla) and one (1) Sietecueros (Tibouchina lepidota). Two groups of sensors were installed in each tree, one oriented to the north and the other to the south.
In total, we tested five (5) devices and one CR1000, each one with a set of sensors of three needles: two probes with two thermocouples each, and one heater. The sensors were installed as suggested by the authors of the HRM: at 1.3 m from the floor, inserted horizontally, aligned to the axis of the three and separated by 0.6 cm. The devices were programmed to make one measurement every 15 minutes, recording data every second, in this manner: 30 initial seconds, they stop and turn on the heater during four (4) seconds, then they keep recording temperature for 110 more seconds. Every measurement lasts, 144 seconds in total and stores 140 records for each thermocouple.
Regarding the trees measured, a sample was taken with a 5-mm diameter increment borer, to estimate the density of sapwood, moisture content and width of sapwood and tree bark.
Both commercial devices and the device proposed require external power supplied through a 12V battery.
3.1.Results and discussion
3.2. The device
The bibliometric analysis of scientific publications in two highly recognized databases as Scopus and IEEE Xplorer shows that the number of publications with the words “Arduino based” in the title, abstract or key words has increased during the last decade, reaching 99 in the first data base and 59 in the second, in 2017. The main reasons for using these devices are their simplicity, small size, low cost and ease to purchase it in the market [21,22].
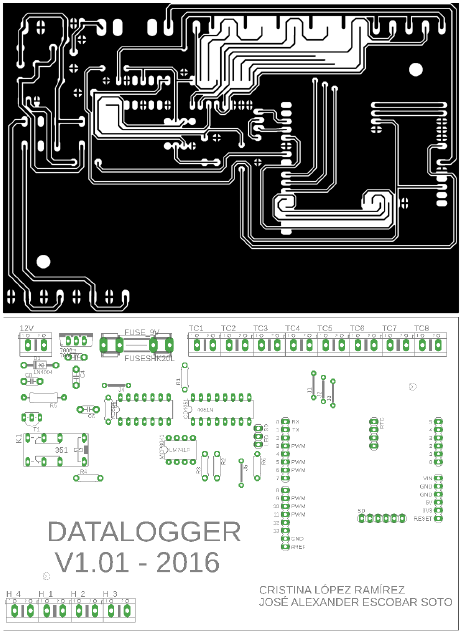
Fig. 2 shows the schematic design of the circuit, where the connection between the selected electronic elements is detailed. Fig. 3 presents the spatial distribution of each element on the printed circuit board (PCB), both developed with the free version of Eagle software [26]. The resistance and capacitance values used to build the device were selected according to the manufacturers’ connection recommendations of the integrated circuits in their corresponding datasheets [17-23].
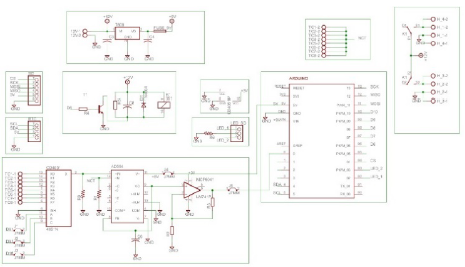
Source: the authors
Figure 3 Top and bottom layers of the printed circuit board (PCB) with register 13-64-171
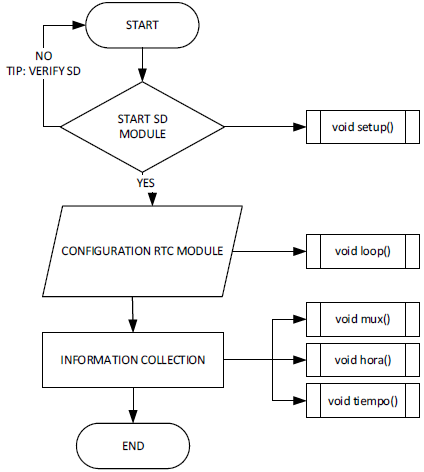
The programming on the Arduino UNO board has several functions used cyclically to collect the data. When starting the code, it is verified if the micro SD memory is inside the SD module (setup () function). Only if the module detects the memory, the recovery of the RTC module is performed. Once the RTC module is configured, the process of data recording begins (loop () function). The code allows the user to determine the number of data to be stored for each sampling period (time () function) and the time the heaters must remain on (mux () function). Every time a data is written to the text file, it is stored next to the date and time of the measurement (time () function) (Fig. 4).
The complete code with the programming of the Arduino UNO is shared as a complementary material document.
3.3 Calibration and field measurements
As for calibration, the data used were taken inside an Arrayán, where a set of probes was connected to the developed device and the second set was connected to the CR1000 (Campbell Sci.), which was recording field data at the same temporal resolution as the devices, every 15 minutes, between December 15 and 17, 2017. With the recorded data for those two days, the calibration equation was built. The best fit was obtained with a quadratic equation. Equation 1 presents, as an example, the result obtained in this exercise, to convert voltage (x) into temperature (y). The resulting equation has a determination coefficient (R2) of 0.8.

It was found that, as long as the device has a sufficiently charged battery to function properly, it has the ability to record information continuously for several days in a row, even weeks. Some additional advantages of the presented device, regarding the commercial devices usually used to estimate sap flow, as the CR1000, is that the proposed device records the information in a micro SD memory with a high storage capacity and easy file download. On the other hand, according to the experience of the authors, the memory of a CR1000 device recording all the generated data (140 per each thermocouple every 15 minutes) only lasts for around three (3) days, after, it begins to overwrite the recorded data.
During the field work of this test, some failures occurred in individual ports or in complete devices that had already been making measurements in the field (specifically in tropical high mountain ecosystems). They were subjected to extreme environmental conditions like wide variations in temperature and high air humidity, during several months. According to specialized studies in electronics, high humidity conditions affect the functioning of the various electronic components, even on a microscopic scale [27] which, under such circumstances, is magnified over time.
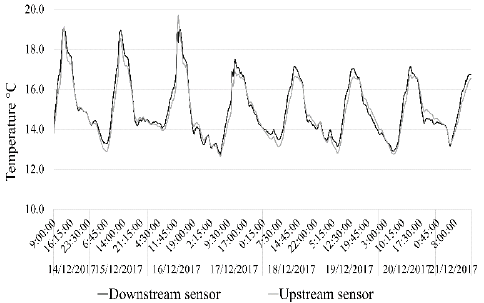
As an example, Fig. 5 presents the average values for the first ten (10) records in every measure (before turning on the heater) for almost eight days, for two thermocouples connected to the developed device. Values are already transformed into temperature, and it is possible to observe the diurnal cycle of this variable, but measured inside the tree trunk, so the amplitude of cycle is lower than the air temperature [28].
Source: the authors.
Figure 5 Average temperatures, per measurement made and recorded during a week by two thermocouples, the upper and the lower sensor, connected to device 3, as an example
Although the time of data collection was longer, the series presented in Fig. 5 was the longest reported. That was due to the failures related to the batteries charge.
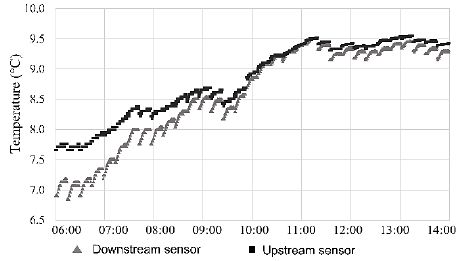
In every measurement, it is possible to observe a group of stable data at the beginning, followed by increasing temperature values, indicating the effect of the heat pulse. The magnitude of the temperature increase after the heat pulse is related to the sap flow transporting the heat, so usually the increase is higher in the downstream than in the upstream sensor. When the tree is actively transporting water or sap, this last sensor receives the heat mostly transported by diffusion through the plant tissues, while the downstream sensor is heated by the pulse transported or conducted by sap (Fig. 6).
3.4 Sap flow velocity
With the dataset in Fig. 6, an estimation of sap flow velocity (Vs) was made, according to the HRM [11]. To do so, the specific caloric capacity proposed by the cited authors was used. The density of the wood was estimated at 402 Kg m-3 and the moisture content of the xylem of these arrayanes gave, on average, 71%.
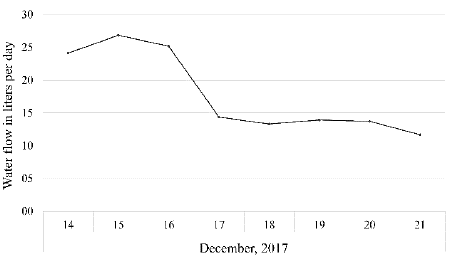
The area of conducting tissue was estimated by using the measured tree diameter (25.2 cm), the width of the tree bark (5 mm) and the width of sapwood (11 mm). Results are presented in Fig. 7.
Source: the authors.
Figure 7 Estimated water flow (liters per day) transported by an Arrayán adult tree.
Although the showed results (Fig. 7) are low for an adult tree, they are within the expected ranges for a native species from a primary forest, since those species have higher water use efficiency and adaptability to possible environmental constrains, such as water availability [7,25,26]. The variations evidenced between the first three days and the rest of the measured days are consistent with temperature original data presented in Fig. 5, i.e., transpiration rates depend on environmental conditions such as solar radiation, air temperature and relative air humidity, linked to the evaporative demand of the atmosphere or the water vapor pressure deficit [31]. Therefore, it is normal for the same individual to have different transpiration rates under different environmental conditions.
3.5. Recommendations to improve the device performance
Using Arduino to replace high cost or difficult acquisition devices is a common option, according to the literature [21,28]. Many of these prototypes are used in interior spaces with controlled environmental conditions and most of the publications do not report an intense use of the device [21,28-31]. These conditions favor the results, while the intensive use of Arduino and any type of electronic elements in outdoor spaces [32] will inevitably impair the operation of electronic components; unless they have been especially adapted for applications of measurement, registration, and control under extreme environmental conditions [33].
As the general objective of sap flow measurement is to characterize the physiological response of plant species to environmental conditions over several days in a specific geographical condition, it is inevitable that the datalogger device is exposed to uncontrolled climatic variables (temperature and air humidity) even if protected from the weather (rain, direct solar radiation, wind, etc.).
Studies have shown that climate cycles conjugated with environmental humidity increase corrosion failures in electronic components [27]. An encapsulation of the electronic components must be designed to reduce the impact of those weather variations, considering the different openings for cooling, input and output of electrical port connectors, hinges, location of screws, and so forth [27]. The material with which they must be designed, for example, the type of polymer [34], among other aspects [35], must also be considered.
This device design is another field of study that increases the costs and the time of production. Therefore, the main advantage offered by this option -its low cost compared to commercial device- gets lost.
Due to this situation, it is recommended to analyze the environmental conditions and intensity of use of the device to be developed, in order to prevent any deterioration that the device or its components may have, affecting the correct performance of its work.
4. Conclusions
The bibliometric analysis allows identifying a trend in the increase of the use of Arduino as a suitable alternative for the design and integration of devices, especially for its accessibility, low cost and versatility of applications.
Laboratory tests or under controlled conditions evidence a high degree of reliability of the data, resulting from the measurement with the device based on Arduino; however, it is susceptible to failure and generation of errors after being submitted to high relative humidity conditions from the air.
The cost involved in producing this prototype is significantly lower than that which would involve the use of commercial devices. The improvements in quality and robustness will depend on the needs and budget of the user.
The development of measurement, storage and monitoring systems that integrate multidisciplinary processes allow them to respond to the requirements and specific conditions of the researcher, optimizing the available resources.
Technological independence implies a reduction of costs and the possibility of new developments that respond to local conditions. It also gives the possibility of converting the developments into value-added products for regions.


