


 Inglês (pdf)
 Artigo em XML
 Referências do artigo
 Enviar este artigo por email
 Citado por SciELO
  Citado por Google
  Similares em
SciELO
Similares em
SciELO  Similares em Google
 Permalink
1. Introduction
Our society lives under the precepts of economic liberalism. According to [32], the basis of this philosophy is that the market itself generates the economic balance, defining issues such as price, supply, and demand. Hence, companies that fail to maintain good productivity and return on invested capital will eventually succumb to the most efficient competitors.
Successful companies can be said to have understood the importance of well-done planning; it is at this stage that they have flexibility and opportunity to design the project and seek cost reductions. Planning failures may affect the operation of the company for some time after its full implementation, generating unnecessary costs and limiting the productivity of the company severely [23].
According to [20], approximately 10% of US GDP is related to logistics expenses. The same proportion happened in Brazil during 2010, when logistics expenses reached 400 billion Reais (at the time approximately 235 billion dollars) [21]. Therefore, the importance of this sector to define whether a company will succeed or not clearly stands out. [20] also stated that among the most critical logistics costs are transportation and storage costs.
According to [2], storage is composed of several factors and can represent up to 25% of the logistic cost. Among these factors, the most relevant are rent, maintenance, energy, depreciation, taxes, repacking, machines, and employees. Besides the operational costs, storage is still composed of the risk of stock shortage (stock out), and opportunity cost for all money spent in immobilized assets (stock or buildings) [6].
The control of storage costs is imperative to have a suitable structure to operate the company. Therefore, it is crucial, while planning a new Distribution Center (DC), to calculate the number of storage positions needed as well as all resources demanded by the operation [2]. Both a shortage or surplus of resources may affect the company’s return on invested capital [21].
The traditional method for design a DC is through static analysis, which consists of the use of productivity means and calculating the amount of each product needed to avoid stock out, given monthly demand and stock policies. Usually, enterprises ally these results to its manager’s experience and a benchmark in similar warehouses. The consequence of this methodology is to design resources that fail to fit in actual operation. To overcome this challenge, [33] suggested the use of computer simulation as a way to adjust the resources and propose improvements from the planning stage.
A successful computer simulation must represent the dynamic characteristics of the DC operation. To design resources it is crucial, to define thoroughly how the operations will be executed and finding the optimal way to run them. Reception, storage, separation, and expedition are some of the activities done in a warehouse.
The process that uses most resources is picking, which consists of collecting products to complete orders that make part of a load [31,24]. There are four well-known forms of separation: discrete picking; batch picking; zone picking; and wave picking [10]. Most often, after the separation, there is quality control, which exists to make sure all vehicles are loaded with the demanded product.
The research objective of this paper is to describe the use of discrete simulation to define the best picking and quality policies to a food industry. Thus, this paper is organized as follows: a review from previous work undertaken in the area of DC operations and computer simulation are in Section 2; Section 3 brings information about the case study; Section 4 presents the simulation results, and finally in Section 5 we provide a conclusion.
2. Literature revie
1.1. Distribution center operations
Despite the desire of companies to eliminate inventory, it is known that this is unavoidable due to several factors, such as supporting variations in demand, transportation problems, improving service levels, among others [2]. Several works in the literature propose methods to design efficient warehouses, and in the following paragraphs some of these works are described.
[12] emphasized the importance of planning a CD and developed a tool that includes all the items that should be considered in the planning stage. Similarly [19] carried out a survey with operation managers in leased warehouses. Their goal was to find out types of structures that are essential for the operation and those unnecessary, which can be eliminated to reduce costs.
According to [12], the first step is to define the objective of the CD. [2] describes four possible objectives: 1) product maintenance, it is universal for all operations; 2) consolidation, receipt of fractional loads and shipment to only one large customer; 3) fraction, receipt of a single large load and shipment to many small customers; 4) combination, receipt of large loads from multiple units, rearranging them to multiple clients.
The second step for a successful design is to understand its size, the number of products (pallets) that will be stored simultaneously [12]. [2] suggests determining that figure statically, by the sales forecast divided by estimate turnover, which takes into account the companies policies to avoid stock-outs. However, the number of positions alone does not define the size of the warehouse, since depending on the operational characteristics it is possible to have a significant variation of other resources and layout. For example, some operations may work well with storage structures more compact such as push-backs, other may need to work with hand pallet, which due to the extensive ground occupation may require more machines to store the products.
Material handling system is considered an intensive activity because it is primarily manual. It covers movement, stocking, and keeping track of all products [2]. Separation is crucial in this process because it represents on average 55% of handling costs [31,24] The best picking policy depends on factors from desired service level to the daily demand in boxes or pallets [1].
The authors in [8] present an article aiming to develop a discrete simulation model that supports the analysis and evaluation of improvement alternatives for the warehouse operations of a mattress industry. Among the findings, they argue that the simulation improves the capacity for picking and dispatch, due to our allowing for computational analysis and the evaluation of alternative improvements. Also, they improved the permanence of the mattresses in the system, making it more efficient.
[22] propose five picking policies, but according to common sense, explained by [10], there are only four policies, and any other method is a derivation of one or more of these. The most basic is discrete picking in which a worker is responsible for a full request. Zone picking consists of dividing a warehouse into several zones (blocks), and an operator is accountable for collecting all products inside this zone. In batch picking, several requests are combined, so each product is collected in more copious quantities. With wave picking, the picker collects the articles requested for several orders followed by a final process wherein each order is isolated. In the case of different conditions (humidity, temperature, among others) in the chambers and the antechamber, it is recommended that an area inside the chamber be designated to consolidate the order before loading the vehicle, which is necessary for the last three picking policies cited [2].
Regardless of the picking policy, it is possible to use pre-automated solutions for better efficiency. Forklifts and pallet jacks give agility and are often essential for the operation [2]. A barcode reader is a popular electronic picking tool because it helps the picker by guiding between the storage structures and allows real-time verification of articles collected through a barcode.
An innovation that replaces barcodes is Radio Frequency Identification (RFID) technology, which should streamline inventory management and reduce picking mistakes. It is a radio frequency label and can operate at different frequencies, depending on the environment. [3].
There are other well-known methods used to reduce picking mistakes. Pick-to-voice is a system in which the picker is guided with a headset and a microphone, where he receives instruction for the next steps and confirm by voice his actions. Pick-to-light is a system where lights on the shelves indicate to workers the requested articles and quantity [3]. According to [30], these solutions can reduce errors by up to 95%.
Fully automated solutions enable robust gains in operations with high volume and fractional demand. It is possible to achieve a significant increase in productivity with fewer employees and great noise reductions [7]. Issues such as high land prices and human resources, mainly for 24 hours operations and unique environments, are factors that encourage full automation solutions. On the other hand, such systems can make operation inflexible and sensitive to failures, and needs requires investments with long paybacks [33].
Picking is followed by quality control, which usually occurs in the antechamber, close to an expedition dock. In case of picking with much noise, quality control becomes a compulsory correction process for 100% of requests. However, in systems that guarantee process stability, it is possible to design sample quality control methods, allowing savings in resources and ensuring process reliability.
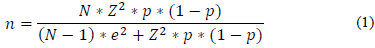
The minimum number of samples (n) is calculated, as shown in Equation 1, using the size of the population (N); failure probability of the analyzed event (p); margin of error (e); and reliability (Z value derived from the normal distribution).
The desired reliability varies according to the need of the company, but the idea of 6-sigma is widespread. This practice is based on the Shewhart chart, "X-Chart", where the centerline is the samples mean, and the upper and lower control limits vary three standard deviations from the mean, giving an amplitude of six standard deviations [27].
X-Chart, which works with means and "R-Chart", known as the amplitude graph, have already been studied by several authors, among them [5] who demonstrate the applicability and the construction of this tool.
Besides the traditional method for calculating sample size, there is the fuzzy controller method for adjusting sample size, first suggested by [29] and improved by [17]. These authors proposed an approach called loss-based algorithm. From a random sample size and analysis for several standard deviations (within a Shewhart graph), the authors were able to determine in each case if the sample size should be reduced or increased. They then applied the algorithm to find the expectation of financial loss and the optimum samples quantity.
Another factor that contributes to the handling of products is its positioning inside the warehouse. Setting fixed storage is not recommended, although it may reduce employees, it certainly increases warehouse idleness because it segregates demand variations, requiring a larger storage area - a better idea is to update product positions frequently. [2]. It is possible to define the positioning by product characteristics such as complementarity, compatibility, size, and popularity. However, [13,14] developed the COI (Cube per Order Index"), an indicator that combines size and popularity and is still the optimal method for operations where the picker has to collect just one article.
Also, it is necessary to define the number of docks and other resources that support the operation. Docks usually are bottleneck points, and an attempt to improve their use is to divide them into several sides of the warehouse. It might be a good solution for some kinds of operations. However, this may result in extra costs as the distance traveled by workers increases [12]. Equipment such as dock levelers are essential for loading trucks of different heights and for keeping up high productivity. Parking is also critical for operational efficiency because there have to be enough parking spots for all vehicles and the turning radius must enable trucks to perform curves [33].
1.2. Simulation
Several definitions of computer simulation have been proposed over the years. In [9] is summarized as a tool that, through a model, designs a real system to study behaviors and evaluate possible improvements in operational strategy.
[18] defended the use of simulation in the first steps of planning logistics plants to optimize transport between areas, size of facilities and the scaling of resources. The method of simulation maks it possible to identify in advance and with low-cost, operational restrictions as well as advantages and disadvantages of a proposed layout. However, simulation has a vast range of applications, services, manufacturing, equipment failures, among other applications [9,16].
Among the advantages of applying this technique are the following attributes: better understanding of the system, including the relationship between variables, easier identification of bottlenecks, no need to simplify reality as much as in analytical models, less maintenance, and flexibility to test hypotheses without interfering the operation. On the other hand, it is hard for another expert to replicate the model, and modeling takes time, training and specific knowledge. Attempts at simplification to save time during development usually lead to unsatisfactory results [9,16].
The development of simulation goes through four stages. First comes the planning, in which the objective of the simulation must be defined as well as the necessary resources to build it up. [16] suggests using the 5W2H tool as a guide. It is common sense that setting a clear goal, through a straightforward question, is essential to the success of a simulation. The second stage is data collection and processing as well as working out system statistics involved in the operations. Third, translation of this information into a simulation language, to verify and validate the model, which means to ensure that the obtained results are representative and satisfy the logic of the system. In this step, it is also essential to define the number of replications and tested the hypotheses suggested. Finally, the process should be documented to facilitate the replicability of the experiment and aid further progress [9].
1.3. Comparable studies
To determine the most efficient layout, [15] studied a DC operation with a high variety of perishable products. The authors firstly estimated the number of resources, time, and cost for each process. After, they developed a distance matrix for each of the three scenarios proposed. Thereby they evaluated, through linear programming, which scenario would minimize cost with an acceptable cycle time in that operation. The study brought improvements to the project, as it inverted docks sides and the warehouse flows from the y-axis to the x-axis.
[4] simulated in Excel alternatives to improve picking efficiency, using distance traveled as an indicator. He proposed changes in the purchase path, inventory allocation, picking policy, and layout strategy. The research showed improvements when applied these changes. However, it was not possible to implement due to the imperfections of the existing plant.
[22] focused their studies on separation, developing a model to determine, regarding costs, the best picking policy. In their method, the authors considered four costs: people, equipment, workload balance (some policies may leave employees idle while others overload, generating higher costs), and IT costs (including needs for conveyors, hardware and software that may differ). He showed that changes in the picking policy would result in savings, besides that he achieved a better understanding of the cost composition and those most relevant.
Also focused on order separation [28] created a model to minimize the process time of an order by varying the quantity of grouped orders within a request wave. The picking policy under analysis was a combination of discrete and waves, in the sense that they consolidated several requests, but only one picker collects the entire wave. The total process time is composed of three factors, waiting time until the wave is formed, waiting time until the picker is available, and picking time. Applying the method, they found possible to reduce process lead-time and resource utilization only by changing the size of the waves.
[11] conducted a case study to improve DC productivity by changing the Warehouse Management System (WMS) to fit the operation better. They visualized in a macro way the operations and the process flow. During the analysis of inefficiencies, they concluded that the poor layout was a barrier to optimize the system.
[25] researched the applicability of computer simulation in logistics systems. They modeled the project with stochastic and deterministic variables and studied how the model responded as it progressed regarding randomness and variability. The research evidenced that deterministic parameters do not reproduce randomness, so they do not reproduce reality. On the other hand, stochastic parameters responded satisfactorily; the authors also emphasize the importance of double-checking the inputs to avoid mistakes that can later affect the implementation of the project.
[26] simulated the logistic process from the entry of an order until the delivery to the final customer. The authors proposed to change the loading method decision to maximize container occupation. The baseline scenario employees were responsible for deciding which orders would load each container, while in the alternative scenario a computer optimization model did the same job. They simulated both situations and found results that proved the effectiveness of the tool, reducing the need for resources, such as docks, and vehicles.
[34] had the objective of improving the picking using vehicle routing model for a Mexican company. They modeled the vehicle routing problem through the software VIAMENTE, and the results were reported in Stat:Fit, so that once the probability distributions were obtained, they could prove the benefits of the results before applying to the operation. The results showed less need for vehicles and improvements in picking productivity due to the consolidation of the loads.
With the objective of reducing raw material transport time, [35] found it necessary to work on the wagon unloading cycle time. The authors simulated through Delmia software, which enabled them to propose three alternatives. The solutions proposed could reduce the cycle time by up to 20% without affecting the other operations of the system.
1.4. Distribution center characteristics
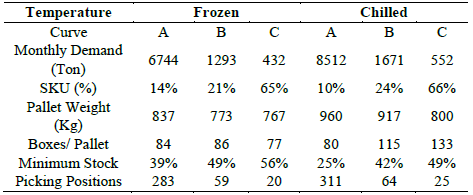
This case study is about an operation of a distribution center of a food industry that has on average 480 products (SKU), chilled or frozen. This DC has its main characteristics of maintenance and fraction. To keep items in proper conditions, it is necessary to store them in different chambers, according to their temperature.
The analysis of the sales for three months and an ABC classification for each temperature was made. This aggregation was chosen to group articles with similar variability of demand and supply. As a consequence, this case study will treat the problem in a simplified way, with six products, three frozen and three chilled.
The characteristics of the new grouped products were calculated by a weighted average of the information of each SKU of that group. According to Ballou (2006), the minimum stock policy is calculated by lead-time of supply, daily demand, and their respective variability. The result showed in percentage on Table 1 is the proportion of the monthly demand that the company must store to avoid stock out. The need for pallets of each product in the picking area is calculated from the daily demand. Table 1 reflects the characteristics, and operational requirements of the company studied.
Once the DC was characterized, the next step was to understand their operation, as shown in Fig. 1, at the flowchart. The balls on the left side of each operation box represent the resources seized, and their colors correspond to the colors in the resource frame.
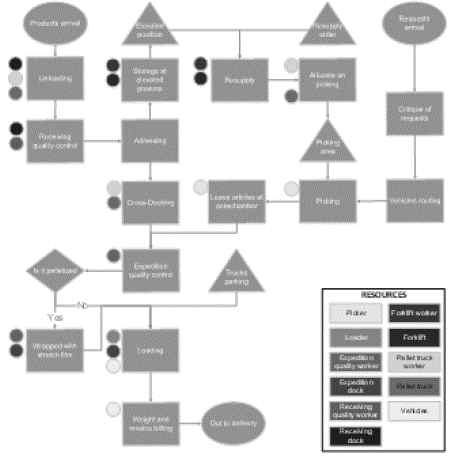
The system begins with the arrival of supply trucks. These vehicles approach a dock to unload, with a pallet jack, and go through the receiving quality control before releasing the truck. There are cases in which the load reaches the DC, only for lower pallet height and carries on to the customer in the same or other vehicles, operating as a kind of cross-docking. However, these cases are an exception and were disregarded in this case study. Therefore, all checked loads are addressed to elevate positions (storage addresses located at levels above the ground) with forklifts. Once in an elevated position, they are allocated to the picking addresses only in case of a resupply order.
The system compiles all requests and performs the critique of each order (adequacy of an order to verify if there is any service restriction). Following, is the vehicle routing process, grouping requests together in vehicles. Once the composition of a load of each vehicle is defined, the Warehouse Management System (WMS) generates the collection path for each picker. The separation adopted by the company from the case study is the discrete picking. After collecting the articles, the picker leaves it in front of the dock, at the antechamber.
The WMS sends a resupply order to a position every time that there is less than 20% of the picking capacity. Internal safety standards impose that resupply operations must occur in two stages: first, a forklift removes the elevated position and places the pallet close to the destination picking address; then an operator uses a pallet jack to allocate the pallet inside the address.
Once at the dock the request goes through the expedition quality control and then, just before loading, it goes through a decision process. If the truck is destined to customers who receive it palletized, that is, customers requesting at least one whole pallet, it is wrapped with stretch film. Otherwise, the truck is loaded box by box. Finally, the truck is weighted, and a billing invoice is issued before it leaves for delivery.
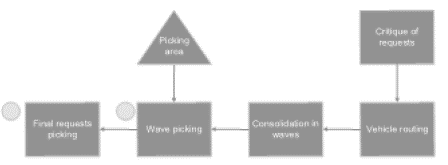
The alternative scenario proposed in this paper is the use of wave picking. To that end, we grouped all small vehicles for picking. A group of pickers is responsible for collecting all items from that wave and leaves it in a holding area inside the chamber to maintain proper temperature. A new separation takes place, breaking the waves into the requested vehicles and taking the requests to their expedition dock. This alternative is demonstrated in Fig. 2.
1.5. Model development
The planning and objective of the work were defined following [16] proposal to use the 5W2H tool. It was established as an objective question if resources were balanced and which operations were bottlenecks. Besides that, the computer simulation should bring evidence whether the alternatives brought improvements to the process. The development was divided into three stages:
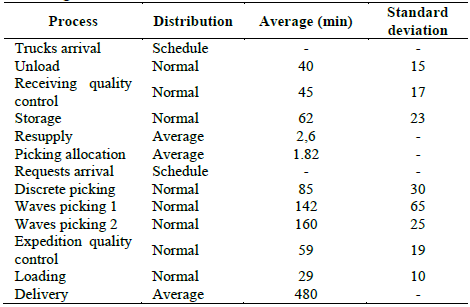
Data collection, which was facilitated by the company that provided a significant amount of information from their operation. It was considered a run time of 3 months; this period gives us a real understanding of operational peaks, usually concentrated in the last week or even the last day of the month. The research uses deterministic data to determine in what time the supply trucks and the requests arrives in the system. Processing times were modeled, and their distribution and parameters (mean and standard deviation, for example) were established as shown in Table 2.
1) The designed model is very similar to the flowchart described in Fig. 1 with only some necessary adaptations for Simul8 ®, to facilitate understanding. It is described as four large parts:
a) Receiving: The work shift is from 6:00 a.m. to 2:00 p.m. The entity at this point is the receiving vehicles that must be unloaded and checked still at the receiving dock. The following step is storage in which the entities are pallets, so the trucks are broken into pallets on the predetermined characteristics of each truck; this process is done through Visual Logic of Simul8 ®. Each one of the six previously defined articles has its queue that is equivalent to the elevated positions; all pallets are stored in these queues.
b) Resupply: When a picking position reaches less than 20% of capacity a resupply order is issued. Simul8 ® perform this operation also through visual Logic. As forklifts must remove pallets from the elevated positions and only pallet jacks can allocate these pallets in picking the task must be divided into two operations.
c) Picking. The work shift is from 20:00 until 04:00. When the pallets are stored in picking positions, the entity is transformed into boxes. The fraction from pallets to boxes is done according to products registration shown in Table 1. Orders arrive deterministically following the schedule sheet. There are at this point two distinct flows: considering the boxes as entities, the first flow is the picking of these boxes from their respective picking addresses, and the respective inventory update"; the second flow, where the requests are to entities of the simulation, is the loading of the products in the vehicle and the shipment of the order. In the second flow, this research proposed an alternative process, replacing the requests by waves as an entity, so small vehicles were joined in groups of five requests. After the first picking process, a final separation is done in which waves are fractioned into the expedition vehicles, going back to the baseline scenario flow.
d) Shipment: The picker allocates the request at the dock where it goes through the expedition quality control and loads in a vehicle to go out to delivery. The baseline scenario has 100% of vehicles being checked. An alternative to a sample quality control was proposed. The expedition begins just after picking, starting at 10:00 p.m. until 6:00 p.m.
2) Validation was performed through the tracing technique. Deterministic data were inserted into all variables to verify if after each event the desired state was reached.
From the methods proposed by [9], we adopted replications to analyze variability. As the simulation time was set at three months, five replications guaranteed low confidence intervals and a computational processing time of approximately 30 minutes. Another concern related to the non-terminal models is the first bias, so we chose to represent the initial state by the steady state of the system.
3. Results
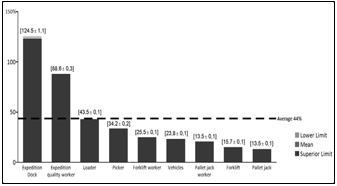
The baseline scenario, discrete picking and with 100% of vehicles going through quality control, was first analyzed. Graph 1 shows the utilization of the resources and indicates that there is a bottleneck located on shipment, so the alternatives of wave picking and quality control by samples converge to the objective of improving DC efficiency. The utilization of the 125% on shipment dock is justified because it is seized at quality control and released only after loading. Vehicles that were in the loading queue at the end of the shipment shift are using this resource over operational capacity. Also, it can be seen that the confidence intervals found were negligible.
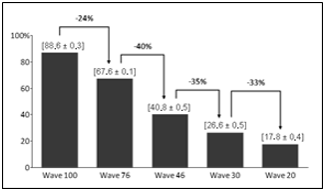
Further, nine alternatives were proposed, varying the picking policy to wave picking and expedition quality control on 100%, 76%, 46%, 30% and 20% of the vehicles checked for the reliability of 100%, 99.9997% (6σ), 99 %, 95%, and 90% respectively. The minimum number of samples were obtained through the formula proposed by [27], where population size equals 16,093 requests, probability of failure of 50% (as there is no measurement it is the worst-case scenario) and margin of error of 1%.
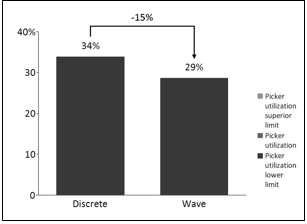
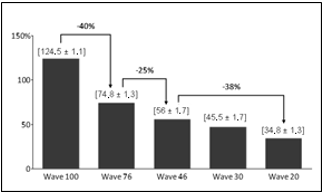
The first analysis made was between both picking policies. Shown in Graphs 2, 3, and 4, the results concerning the resource utilization and waiting time at first glance may lead to contradictory conclusion, but as explained in the remained of this text is very consistent. While pickers utilization, Graph 4, is lower in the wave picking, requests have to wait more time for separation. A possible reason is due to the allocation of the picker resource in the wave picking model. As both operations (collection of the articles, and final separation) are performed by the same resource picker; often one process can lock all resources and paralyze the other activity, resulting in long queues.
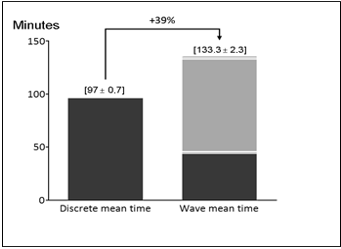
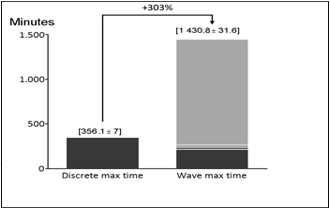
On the one hand, Graph 2 brought an understanding that changes in picking policy would be harmful to the operation, as it increases by 39% average waiting time. Graph 3 highlight it, as maximum waiting time raise up to 303%.
On the other hand, Graph 4, of picker utilization, shows a 15% reduction in the need for the resource picker, which shows that there is a room for improvement in wave picking alternative. Further researches testing this scenario of resource pooling and optimizing the number of requests in each wave may be more conclusive about the change in picking policy.
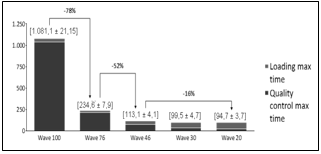
Also, in Graphs 5 to 12, we were able to show the effectiveness of change to sample quality control up to the reliability of 99% and 46% of vehicles checked.
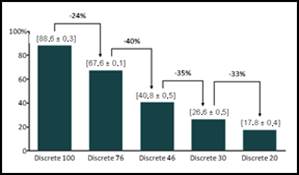
We found in this situation significant gain in resources utilization as in waiting time. Graphs 5 and 6 shows explicitly, as expected that for both picking policies the quality worker utilization drops as reduce the number of vehicles checked.
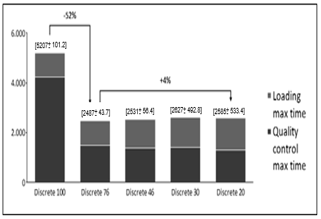
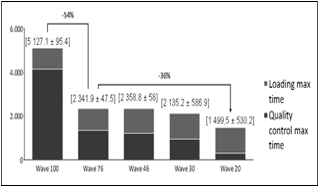
In Graphs 7 and 8, it is possible to see a significant reduction in expedition dock utilization for 76% and 46% of vehicles checked while the reduction between Wave46 and Wave30 is smaller. This reduction happens because loading process becomes each time more significant, reducing gains as the reduced number of vehicles checked
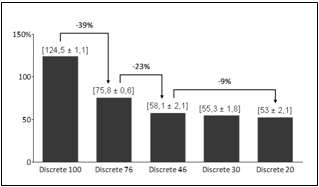
Graphs 9 and 10 show similar behavior in quality control plus loading average waiting times for discrete and wave picking. As dock utilization decreases it is possible to reduce the total waiting time until a certain point, where it stabilizes. However, these graphs show some thought-provoking features.

First, Wave picking shows a better result between the scenarios of 76% to 46% of vehicles checked. Secondly, it does not help the system reduce the number of vehicles checked more than 46%, because we end up overloading loaders and having almost no impact on the total average waiting time.
Graphs 11 and 12 emphasize even more the results found previously. Another crucial data taken from these graphs is the maximum waiting time, which in some scenarios beat 1000 (thousand) minutes for quality control and loading, even with the utilization of approximately 50% for the resources involved. This issue is due to the company's characteristic of a sales peak at the end of the month. These sales enter the queue of orders to be shipped but are typically delivered within the next week, as represented by the computational model.
The premise adopted was that only one request can occupy the dock at a time. However, sometimes may happen that there are one request loading and another passing through quality control. Further research should test change the place where quality control occurs. An alternative from the antechamber (in front of the dock) is the retention area inside the chamber proposed for wave picking. The expected results for the alternative is to give the docks higher turnover and thereby probably improve shipment productivity.
4. Conclusion
This work contributed to bringing aspects of a warehouse operation, explaining the importance of planning before the beginning of the implementation of a DC and especially to applying computer simulation to analyze a real logistics situation. The gains regarding process understanding, generation of alternatives to processes, considered bottlenecks, and testing alternatives without a cost are evident following the proposed methodology.
The results allowed us to state with precision that the bottleneck occurs in the separation and especially in the expedition process. The results indicate a great potential in changing wave picking. This potential is emphasized by better results when applying sample quality control and by the alternative of held quality control in the retention area.
There are some opportunities for further studies. The first one concerns the allocation of picker resources for wave picking policy; a possible alternative is to work with a pool of resources. The second one is changing where expedition quality control takes place, from the antechamber to the retention area in the chamber. Two possible restrictions for this is that in the discrete picking policy there is no retention area. Moreover, it would result in more employees working in a cold environment. Third, there would be the need to calculate the optimum number of vehicles per wave.
The main result of this case study is the significant gain in the implementation of sample quality control with 6-sigma or 99% reliability. As it is only possible to perform it in operations where noise is low (i.e., the quality control exists only to guarantee process stability and not as a necessary picking adjustment), it is recommended that tests be carried out with pre-automated solutions. Other research cited in this paper proves that technology can successfully reduce noise and guarantee assertiveness. These results show a broad impact on employee reduction as resources utilization fell sharply in the proposed scenarios, making the investment in these solutions financially viable.


