


 English (pdf)
 Article in xml format
 Article references
 Send this article by e-mail
 Cited by SciELO
  Cited by Google
  Similars in
SciELO
Similars in
SciELO  Similars in Google
 Permalink
1. Introduction
A significant number of new experiments reinforce the conclusions reached by Bunyard et al., [1] that the airflow detected during air-refrigeration cycles in the experimental structure are the result primarily of anisotropic implosions of air surrounding the loci of water vapour molecules undergoing condensation. Meanwhile, the kinetic energies associated with air density changes at the cooling coils are found to be inadequate by an order of magnitude even to move one cubic metre of air at the velocities obtained, thereby repudiating the expectation that denser air sinking through gravitational force would set up a measurable air circulation in the structure.
In effect, the experimental evidence indicates that condensation results in a measurable unidirectional flow with sufficient kinetic energy to generate a complete circulation of air around the internal space of the structure, as detected by the anemometer when sited 6 metres away from the site of condensation. The experiments indicate that the velocity of the airflow during air refrigeration cycles is dependent on the rate of condensation and that lower rates of condensation correspond to lower airflows. If air density changes from refrigerated cooling were to have been the prime cause of airflow, then each typical experiment would give a similar result, insofar as the reduction in temperature by some 10°C in each cooling cycle would cause a similar increase in the volume and density of air passing over the cooling coils. Instead, different airflows are encountered in different experiments. Furthermore, the airflow shows its maximum rate of increase at the very beginning of each cooling cycle, before any significant air density change has taken place. That finding should not be surprising given that the kinetics of condensation incur one thousand times more energy per air volume than those associated with air density changes. The experimental results indicate that the physics of the kinetic energy associated directly with condensation provides the necessary force to account for the airflow engendered.
2. Methodology
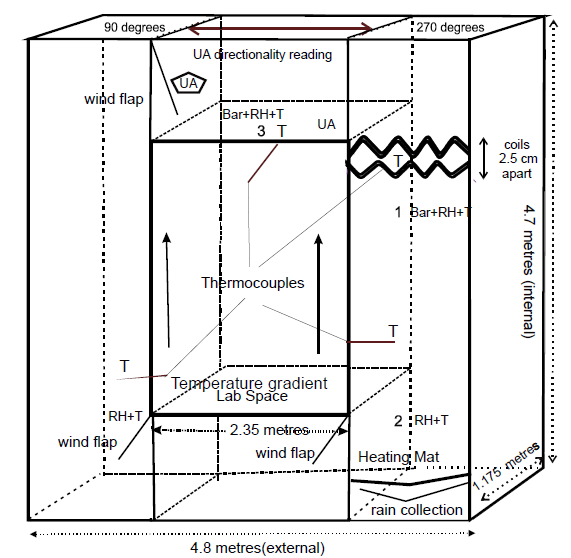
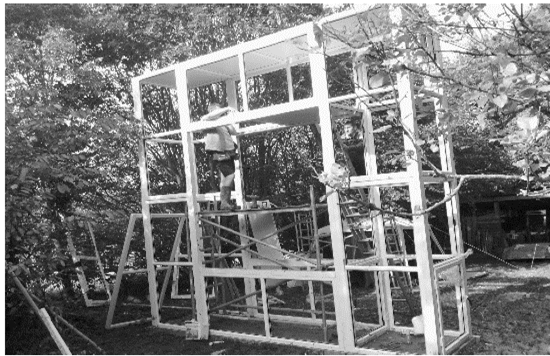
The same structure was used as in the first set of experiments [1], but this time the Gill 2-D ultrasonic Windsonic (accuracy ± 2%) anemometer (UA) was kept in the same position during the course of all the new set of experiments, one half metre up from the floor of the upper tunnel and some 20 cm from the left-hand column. The anemometer was therefore measuring the airflow 2.5 metres away from the cooling pipes and the locality of condensation. The dimensions of the structure and the siting of the sensors for measuring changes to barometric pressure, humidity, temperature and airflow are shown in Fig. 1. Meanwhile, tests with the anemometer 6 metres away from the cooling coils, in the lower tunnel and close to the left-hand column, revealed that airflow was maintained during the periods of refrigeration. That finding, together with the webcam display of the wind flaps, indicated that a substantial proportion of the total enclosed air, hence 20 kilograms, was caused to move during the refrigeration cycles.
Source: Bunyard: [1]
Figure 1 Diagram of structure with sensors: Barometer (BAR), 2-D Ultrasonic Anemometer (UA) Thermocouple (T), and Relative Humidity Hygrometer, which also measures temperature (RH+T). The refrigeration coils, heating mat and rain-collector are also shown. It illustrates the set-up when the air circulation is clockwise, (gauze flaps). Sensors for RH+T have been placed at each of the three numerals at locations (1), (2) and (3), and BAR at locations (1) and (3). Location 1 is 0.05 m beneath the lower coil and 0.1 m below the junction of the upper tunnel with the right-hand column. Location 2 is 1.2 m above the floor of the right-hand column and location 3 is 0.5 m above the floor of the top tunnel. The top right T is 0.005 m from the upper cooling coil. The lower T in the right-hand column is 1.75 m up from the floor and the T in the left hand column is1.5 m from the floor. The T in the upper tunnel is 0.75 m from the junction with the right-hand column.
3. Equations
Standard physics [2,3] are applied throughout to interpret the experimental results. The three variables of temperature, barometric pressure and relative humidity are used to calculate the partial pressure of water vapour (ppwv) using the exponential equation of Clausius-Clapeyron, [2] p.165, eq. (1)-(2). Since at an atmospheric pressure of 1013.25 hPa, p 2, water boils at 373 K, represented as T 2,it is possible to substitute for p 2 and T 2. The saturated partial pressure of water, p 1.at each temperature, T 1 can be determined as follows:
Eq. (1) can be rewritten as:
In eq. (1)-(2), Q, latent heat of evaporation is 40.65 kJ mol-1, R, the ideal gas constant, is 8.31 J K-1 mol-1. The actual partial pressure of water vapour, , in the three numbered locations in Fig. 1, is given by multiplying the result by the relative humidity, RH, as measured by the hygrometers.
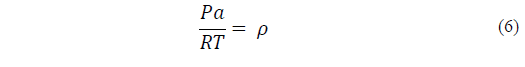
The air density is obtained through the use of the equation of state for ideal gases [3] p.86:
Where p is the barometric pressure, hectopascals (hPa), p is the air density in kgm-3, R is the ideal gas constant, J K−1mol−1 and T is the temperature in Kelvin.
To obtain q, the absolute humidity of water vapour kg per kg of moist air, the formula, Eq. (4), is used where 0.621 (18/29) is the ratio of the effective molecular weights of water vapour and dry air, [3] p.127:

Since R varies with the degree of humidity, eq. (5), is used with the values 287 J K-1kg-1 for dry air and 461 J K-1kg-1 for water vapour [3] p.89:

Patmos is the barometric reading at that moment in time for the three locations and p wv is the partial pressure of water vapour, as calculated, at the same time of reading. When the value of q is applied to Eq. (5), it gives the value of R, the ideal gas constant for moist air, as water vapour is added or removed.
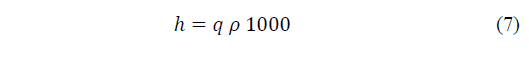
To calculate the specific humidity, h (water vapour in grams per cubic metre of moist air), the values of q and ρ (the air density in kgm-3) are required, as are the values for R, see eq. (5) and T, as derived from the experimental data.
Source: Bunyard.
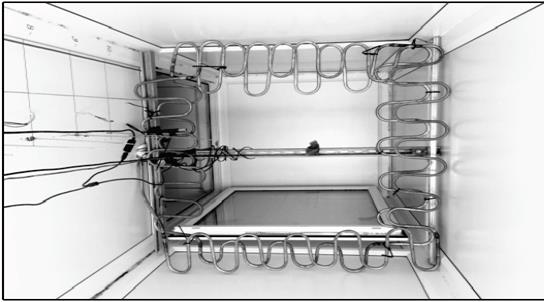
Figure 3 The double-layered cooling coils, three-quarters up in the right-hand column.
The air density ρ, in kgm-3 is obtained eq. (6), using the ideal gas equation, see eq. (3), where the barometric pressure is given in pascals (Pa):
The humidity, h, of moist air, in grams per cubic metre will be obtained, eq. (7), from the proportion of humidity, q, in a given air density ρ, as from eq. (6):
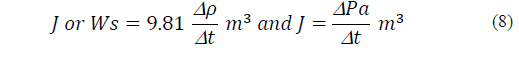
Eq. (8) (mass*acceleration) provides the kinetic energy values (Ws) for changes in the partial pressure of water vapour,
 and that of change in air density per second,
 The gravitational constant, g, is taken as 9.81 ms-2, and t is the time in seconds:
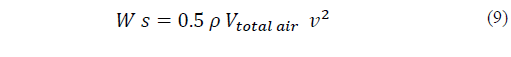
Using eq. (9), the kinetic energy required in circulating all the enclosed air (V) in the columns and connecting tunnels (some 16 m3) can be estimated from the average air density at the time of measurement and from the measured air velocity. For example, at an average air density, ρ, of 1.25 kgm-3, and a volume V of 16 m3, the total mass of air would be 20 kg. With a velocity, v, of 0.2 ms-1, the kinetic energy required would be 0.4 Ws [4].
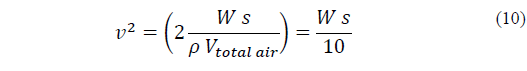
Transforming Eq. (9) into Eq. (10) provides the means to convert the kinetic energy (Ws) from the rate of change of air density and of partial pressure into average airflow velocity in the entire structure (mass of air 20 kg):
As McIllveen [3] (p.443) points out, thermodynamically, it is relatively straightforward to calculate the temperature increase in each kilogram of air as condensation takes place, eq. (11):
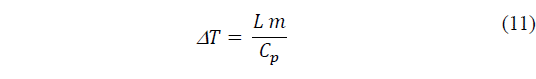
Where T is Kelvin; L is the latent heat of vaporisation of water vapour directly to ice, 2.9 MJ kg-1; and Cp is the heat capacity of dry air at constant pressure, 1,000 J kg-1K-1.
McIllveen gives the example of 1 gram of water vapour condensing into liquid water and shows that it will warm 1 kg of air by 2.5 °C: a substantial amount.
The condensation of water vapour leaves the remaining air denser, which combined with its expansion into the partial vacuum from condensation causes the temperature to decline. The relationship between temperature change and absolute humidity is as follows [3] (p.444), eq. (12):

Source: Bunyard
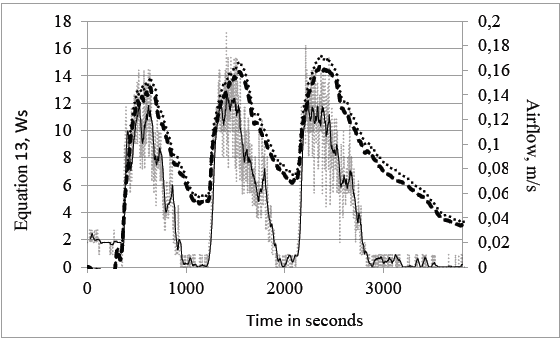
Figure 4 Experiment 5th June, 2018, with three refrigeration cycles, each lasting 5 minutes plus 10 minutes between. Three curves are shown: (1) the rate of change in the absolute humidity (q) of the volume of air passing over the cooling coils per second, light, dotted line, Ws; (2) the rate of change in the partial pressure of water vapour (ppwv) per second of the same volume of air, heavy dashed line, Ws; (3) airflow, ms-1, moving average with 30s period, continuous line. As eq. (13) indicates, the curves of ppwv and of eq. (12) should correspond closely.
Where T v is the virtual temperature of the water vapour; T is the actual temperature of the air; and q is the specific humidity of moist air, kg water vapour per kg moist air. For the condensation of one gram of water vapour in 1 kg of air at 0 °C, the temperature reduction would be 0.17 °C.
Again, multiplying the small temperature reduction,
 by C
p
the heat capacity of dry air at constant pressure, 1,000 J kg-1K-1, the negative kinetic energy can be calculated. That calculation is equivalent to the net negative kinetic energy derived from the change in ppwv, eq. (13), Fig. 4. Hence:
by C
p
the heat capacity of dry air at constant pressure, 1,000 J kg-1K-1, the negative kinetic energy can be calculated. That calculation is equivalent to the net negative kinetic energy derived from the change in ppwv, eq. (13), Fig. 4. Hence:
4. The concept of air parcels
In their earlier paper, Bunyard et al. [1] describe the concept of air parcels as a means to determine the average amount of air passing over the cooling coils per second. In determining the rate of change in the partial pressure of water vapour, whether in grams of liquid water generated, or in kinetic energy (negative Ws), eq. (2)-(8) are used. The negative kinetic energy (implosion of surrounding air) can equally be obtained from eq. (12) by multiplying the temperature reduction by the heat capacity of dry air at constant pressure, 1,000 J kg-1K-1eq. (13). The result of the analysis is for a cubic metre per second rather than for the actual quantity of air which passes over the cooling coils. The measurement of the actual condensation and resulting rainfall provides the means to determine what proportion of one cubic metre actually flows per second across the cooling coils.
Therefore, from the data, h x (gm-3) can be obtained and from knowing the actual quantity of condensate, c, eq. (14) will give factor x or the ratio between one cubic metre and the air parcel, Fig. 5:
In effect, the total condensate, c, as measured from the precipitate, multiplied by x, will be equal to the aggregate of water vapour condensed, h x (gm-3), the factor, x, being the number of times the actual block size divides into 1 m3. The surface area of the coils is 0.642 m2 and taking into consideration that the parcel volume is calculated as if the total surface area were squashed flat into a plane, the factor x will be 1/0.642 ef , where ef is the average effective layer, as if it were jutting upwards from that plane, eq. (15):
The effective layer varies from one experiment to another, the difference being a consequence of the airflow velocity and, in effect, the greater the airflow, the greater the volume of the parcel of air which passes over the cooling coils. That relationship has consequences for the relationship between air density change as a result of a parcel of air cooling and the degree to which the airflow has caused it to move over the coils. Indeed, the slower the flow of air, the smaller the volume per second of the air parcel and the smaller the air density change. In essence, the curve showing the rate of change of air density during a cooling cycle will correspond closely to the curve of the rate of change in the partial pressure of water vapour, even though the implosive energy (Ws) associated with condensation is some 1,000 greater than that of the air density change. The curve of the air density will be precisely the inverse of that related to partial pressure change, even though approximately 1000 times smaller in terms of kinetic energy, Fig. 6.
Source: Bunyard
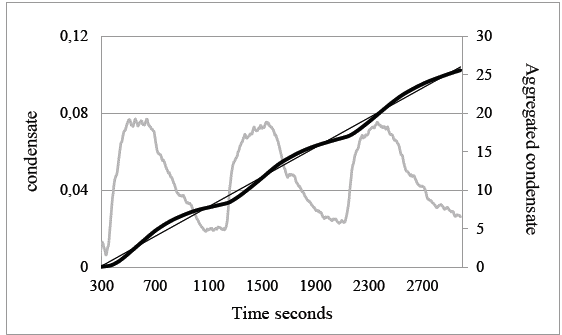
Figure 5 Experiment of June 5th, 2018, showing the rate at which condensate, g/s, is generated during each of the three refrigeration cycles, light line. Eq. (14)-(15) provide the basis for calculating the per second air volume size that is undergoing effective refrigeration. The accumulation of condensate nearly follows a straight line with a correlation of 0.995, thick, dark line. The almost linear rate of condensation enables the calculation of the average rate of condensation simply by dividing the accumulated aggregate of rainfall by time.
Source: Bunyard
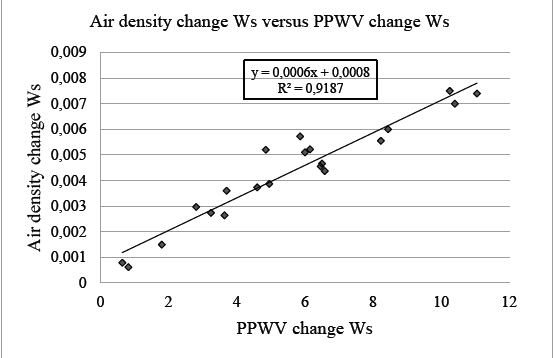
Figure 6 Data from 26 experiments, showing plot of air density change against the rate of change of the partial pressure of water vapour as condensation takes place. Both air density change and ppwv change measured in Watt-seconds. In general, the energy associated with the partial pressure change is approximately one thousand times greater than that of air density change.
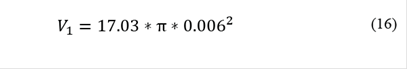
If no air passes over the cooling coils, as for instance before any cooling cycle is initiated, the volume encompassed by the cooling coils will be the total length of the copper tubes multiplied by П multiplied by the radius squared, i.e. 17.03*3.1418*0.006^2. The stand-by volume is therefore 0.00193 cubic metres. Meanwhile, the air parcel volume is derived from eq. (14)-(15). As a result, the actual radius of action around the copper tubing during any experiment can be determined. eq. (16) gives the stand-by volume and eq. (17) the volume of the air parcel during an actual experiment. Given that 17.03 and π are common to both equations, eq. (18) is obtained and then eq. (19) [5]

5. Discussion
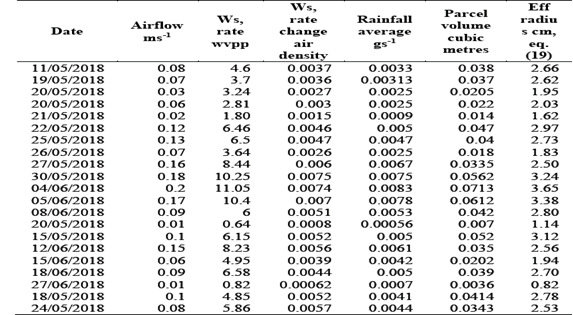
Depending on the experiment, the parcel volume per second varies from 0.0036 m3 to 0.0713 m3, see Table 1. The experiment of June 5th, 2018, as shown in Fig. 4, 5, indicates that the parcel volume size on average per second during condensation is 0.0612 m3 and the effective radius outwards from the centre of the copper tube is 3.38 cm, eq. (19), Table 1. Meanwhile, the aggregated condensation of water vapour against time, with a total accumulated of 26 grams, follows a near-straight line with an r 2 of 0.995, such that the ratio x of collected rainfall to the calculated rainfall for a parcel size of 1 m3 s-1, comes out close to 25.
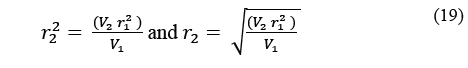
From Table 1, the rainfall in gs-1 plotted against the rate of change in the partial pressure of water vapour shows a high correlation coefficient of >0.98, Fig. 7.
Source: Bunyard
Figure 7 Rainfall per second is plotted against the rate of change in partial pressure of water vapour. The rate of condensation, as determined by the volume size of the air parcel, follows close to a straight line with an R2 of 0.98.
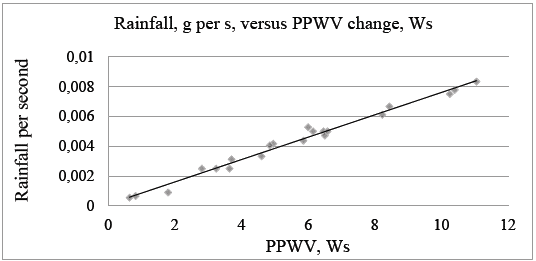
Condensation as rainfall, gs-1, versus airflow, ms-1, from different experiments, again gives a high correlation coefficient of 0.98, thereby supporting the finding that the airflow is contingent on the rate of condensation, Table 1, Fig. 8.
Source: Bunyard
Figure 8 The combined results of different experiments, as indicated in Table 1, show a strong correlation between the collected rainfall, gs-1, and the airflow during the cooling cycles. Correlation Coefficient, 0.98 with an R2 of 0.92, p < 0.001.
The experiments described here, and additional to those in the first published paper, [1], were undertaken in order to review the widely held notion that changes in air density and the resulting kinetic energy from the sinking of cooled air would be sufficient to account for the airflow encountered during the experiments. Moreover, to explain away the much greater kinetic energy (>1000 times greater) incurred during condensation, the claim was that the implosion, as each molecule of water vapour condensed, would be wholly isotropic and that the surrounding air would move into the evacuated locus in a symmetrical manner such as to nullify any tendency for the airflow to be uni-directional [4].
In their 2017 paper [1], Bunyard et al. explained that the kinetic energy associated with air density changes was insufficient by an order of magnitude to have caused the registered airflow and that a number of experiments showed a flow of air upwards over the cooling coils during periods of condensation and therefore in a direction counter to any flow that might be caused by air density changes. Nevertheless, the evidence that the air density change paralleled graphically those changes to the partial pressure of water vapour did raise questions concerning the cause of the airflow (see Fig. 6). For instance, if changes in air density were not the cause of the measured airflow, why would there be any correlation between the airflow velocity and the rate of change in air density?
As Fig. 9 indicates, even though the air density rate of change increases with airflow, it becomes clear that the energies involved with the rate of change of air density are insufficient to have caused that airflow, even were that flow to be a theoretical 10 per cent of the total air mass enclosed in the structure, hence 2 kg. In fact, the positioning of the anemometer plus the movement of the wind-flap gauzes indicate that a much higher proportion of the total air enclosed in the structure flows during an experiment when the condensation rate is relatively high.
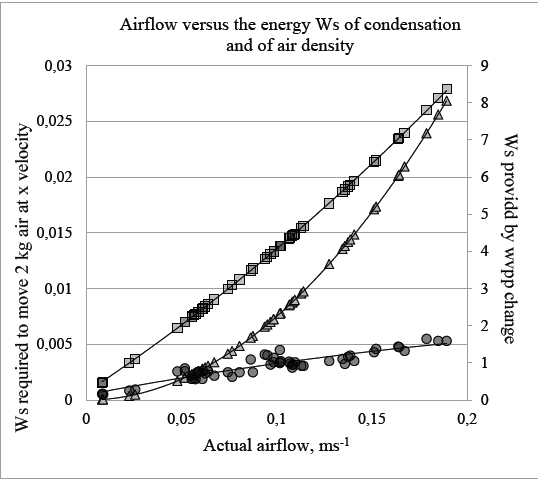
Source: Bunyard
Figure 9 Airflow and the energies associated with condensation and air density. The left-hand Y-axis refers to the minimum energy required, Ws, to move one-tenth (2 kg) of the total air in the structure, according to the velocity of airflow, X-axis. The right-hand Y-axis refers to the actual energy associated with the ppwv change and condensation, Ws, in relation to actual airflow velocities. The plot of condensation change versus actual airflow is represented by the curve with points as squares, and sufficient energy is associated with condensation to move all 20 kg of air in the structure. The curve with the points as triangles is the minimum energy, Ws, required to move 2 kg of air, at different airflow velocities, assuming no energy is needed to overcome turbulence and friction. The curve with points as circles is the energy provide by the change in air density in relation to airflow.
In Fig. 9, the trajectory of the air density kinetic energy curve falls far short of the minimum energy curve required to move just 2 kg or one-tenth of the total air. For instance, at airflows of 0.15 ms-1, the minimum energy required is 0.018 Ws, as seen from the curve with points as triangles, eq. (9)-(10), whereas the energy provided by the change in air density is no more than 0.004 Ws and clearly inadequate. By way of contrast, 7 Ws of kinetic energy are associated with the rate of condensation that accounts for airflows of 0.15 ms-1. The available energy from condensation is clearly enough to move all the air in the enclosed structure, even were friction and turbulence to be taken into account.
Furthermore, if air density change were the prime cause of the airflow, then, given that the refrigeration leads to a reduction in temperature at the cooling coils of some 10.5°C on average during the cooling cycle, each and every experiment would result in equivalent airflow, irrespective of the degree of condensation or indeed humidity.
The results of the experiments indicate that no such equivalence is found, with different experiments giving different results in terms of airflow, Table 1. For instance, on the 20th May, 2018 and 27th June, 2018, the airflow was practically non-existent at 0.01 ms-1, yet the temperature during cooling cycles fell by more 10°C, sufficient to have brought about a substantial airflow if air density increase were the prime mover. In both those instances, condensation was minimal at 0.62 and 0.84 Ws respectively.
In conclusion, condensation, as marked by rainfall, is the cause of the detected airflow; hence, the rate of change in air density is a consequence of being associated with the effect of condensation on the volume size of the air parcel, eq. (14)-(15) rather than being the cause of the airflow. In effect, it is the velocity of the air over the cooling coils which determines the rate of cooling of an air parcel and therefore the rate at which the air density increases.
When the refrigeration is first switched on, the drop in temperature at the coils will cause condensation to occur, according to eq. (2). At that point, the energy required to move the air surrounding a locus of condensation will cause the air to flow more rapidly over the cooling coils, thereby resulting in a process of positive feedback. The system then reaches a point of dynamic equilibrium between the quantity of air flowing over the coils and the rate at which that volume of air can be cooled. As Fig. 4 shows, airflow increases rapidly at the beginning of each refrigeration cycle, as does condensation and associated kinetic energy, and then flattens before fading away once the refrigeration is switched off.
The question is whether the small-scale experiments have any relevance to the atmosphere at large? In fact, the physics employed in the experiments are precisely those used in determining the relationship between water vapour condensation and temperature in the lower atmosphere [3].
Despite that, the conventional point of view is that the kinetic energy for air mass convection derives from the general principle that hot air rises and cold air sinks. However, as Makarieva et al. [6,7] point out, when hot air rises in the lower atmosphere it cools because of expansion and when the same, but now cooler, air sinks it heats up, such that the overall gain or loss in kinetic energy is zero.
Makarieva and her colleagues advocate that the physics of water vapour condensation and cloud-forming are critical for air mass circulation such as is embodied in the Hadley Cell air mass circulation of the equatorial tropics [6,7]. They highlight the role of contiguous, closed-canopy rainforests in feeding the atmosphere above them with water-vapour derived from a high rate of evapotranspiration.
Nevertheless, climatologists, with rare exception, have resisted the idea of a biotic pump theory (BPT) in which a large expanse of tropical humid rainforest brings about sufficient humidity through evapotranspiration to cause a high rate of cloud condensation which in turn leads to ocean-to-continent surface winds such as the trans-Atlantic Trade Winds [6,10].
According to the BPT, rainforests, year-round in the equatorial tropics and during the summer in boreal regions, feed the lower atmosphere with water vapour, up to 5 per cent of atmospheric pressure, and thereby provide the source material for cloud formation [6,7]. The depletion of water vapour and the resulting rarefaction of the local atmosphere in the locality of condensation cause convection over the forest, according to the BPT. From that point of view, it is the hydrological cycle, including water evaporation and condensation, which drives convection and therefore the circulation of the air masses. That is in sharp contrast to the orthodox view of convection and air mass circulation, which argues that the movement of the air mass drives the hydrological cycle through latitudinal differences in temperature, helped on by the buoyancy generated as a result of the release of latent heat [3] p. 444, eq. (11). In effect, the BPT states that the major physical cause of moisture fluxes is not the non-uniformity of atmospheric and surface heating, but that water vapour is invariably upward-directed as a result of the rarefaction of air from condensation [6,7].
The very fact that the condensation of a few grams of water vapour per second can give rise to measurable uni-directional airflow during the experiments suggests how much more powerful the same physical mechanism in the atmosphere at large. The evapotranspiration (ET) over the 5 million square kilometres of the Brazilian Amazon amounts to an average of 1,370 mm per year [8]. The kinetic energy associated with the implosion as water vapour from evapotranspiration condenses into clouds (therefore approximately equal and opposite to one-twentieth of latent heat energy) translates to some 5 Ws for every square metre of forested land. If that energy were delivered in a few pulses during daylight hours, those bursts of ET would impact on the rate of cloud condensation and hence on the surface flow of air. Some evidence exists from the ground-based meteorological station within the Biological Station of La Selva in Costa Rica, that the absolute humidity at the surface undergoes some ten pulses during daylight hours [9]. Whereas 5 Ws would give airflows of 2.85 ms-1, the pulses of absolute humidity from ET could give airflows of 7 ms-1 (Trade Winds) and require a condensation rate of 30 pascals per second per cubic metre (30 Ws). The 5 Ws is the average over 24 hours and, on the assumption that transpiration occurred in pulses during daylight hours, the 30 pascals per second of condensation and partial pressure change per cubic metre would be readily obtained.
6. Conclusions
The experiments described in this study, including those shown in Table 1, indicate that air density changes around the cooling coils are insufficient by more than an order of magnitude to bring about the observed airflows, and that more than sufficient potential energy, bound up in the partial pressure changes of condensation, is available to account for the actual airflows. In the experimental set-up at least, both latent heat release and air density changes from the refrigeration can be ruled out as the cause of the consistent uni-directional net airflows. Anisotropic, hence physically-directed airflow to the locus of condensation remains the only candidate. The experimental evidence, therefore, flies in the face of the accepted dogma, which states, without any evidence, that isotropic-condensation is the norm. In effect, the trigger for such directed airflows derives from distinct edge conditions in the vertical plane, above and below the area of condensation [1].
The laboratory demonstration of anisotropic condensation in causing enhanced air mass convection would strongly suggest that the great forests of the world play a fundamental role in air mass circulation through providing water vapour via evapotranspiration, and in bringing rain to the deep interior of continents [6,7,10].

