


 English (pdf)
 Article in xml format
 Article references
 Send this article by e-mail
 Cited by SciELO
  Cited by Google
  Similars in
SciELO
Similars in
SciELO  Similars in Google
 Permalink
1. Introduction
Energy management technology called "Integrated Energy Management System (IEMS)" (ISO 50001) was proposed in Colombia in 2007 as result of a government-funded research project, which consists of the application of statistical tools for the improvement of energy efficiency in production process [1]. It also presents an efficient tool for the management of Energy Efficiency in all areas, replicating concepts and nomenclatures to facilitate the transfer of significant experiences in the optimization of company resources [2-3].
To design a strategy for energy reduction it is essential to determine the state of the energy consumption by analyzing the indicators of the companies, for that reason some researcher evaluated the hive furnaces in several companies, and described the characteristics of energy in average based in 205 furnaces analyzed by making a diagnosis in the energetic elements. From these they concluded that the management of thermal and electrical energy in most of the companies visited do not have predictive maintenance plans [4].
Some other researchers stated that ISO 50001 is an innovative strategy to optimize the measurement of energy in large energy-consuming plants, taking into account that the proposed solutions represent a critical challenge for many companies because the benefits of improvements in the energy management could be potentially canceled by the costs of an Energy Management System. In particular, monitoring key performance indices is a crucial activity for several reasons: It is one of the first activities that affects in the first instance the quality of the measurement of key performance indicators, second, the system requirements and, accordingly, investment valuations [5]. It is because from the above industries dedicated to the manufacture of products they can achieve energy savings of up to 40%, some without capital investment, through the application of energy management methods [6].
In Europe and the world rising energy costs, new environmental legislation and energy security concerns are pushing companies to increase industrial energy efficiency. For this reason, companies are willing to identify the most cost-effective techniques to increase energy efficiency in their factories, in order to achieve improved efficiency, energy use must be measured in more detail and in real time, to obtain a knowledge of the energy use patterns of all parts of the manufacturing system [7].
Taking into account the above, for governments and manufacturing companies, global warming, rising energy prices and the creation of an ecological consciousness have stimulated manufacturing to efficiently try to identify effective measures to increase the energy efficiency in the manufacturing processes of any productive sector. This is why researchers propose, first of all, to analyze the concepts and tools of measurement, control and improvement of energy efficiency in production management proposed in the literature. Secondly, show that ICT tools and standards are important to facilitate efficient production. Third, the need for industries based on expert interviews [8].
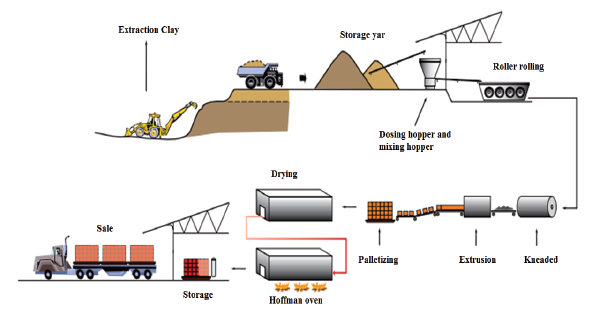
Within the ceramic industry case, the processing of the raw material consists mainly of three phases, which are; preparation of the ceramic paste, molding of the piece and baking. In the first stage of the preparation process, the composition and plasticity are modified by adding other clays in order to obtain a homogeneous ceramic paste, then molded according to the desired shape under pressure or extrusion. Once the molded part has been obtained it is proceeded to be dried by controlling the rate of water evaporation in order to avoid defects in the piece. Afterwards, the piece is sintered, that is to say, it is subjected to the cooking process in order to decrease the porosity, increase the density and the mechanical strength (Fig. 1) [9-13].
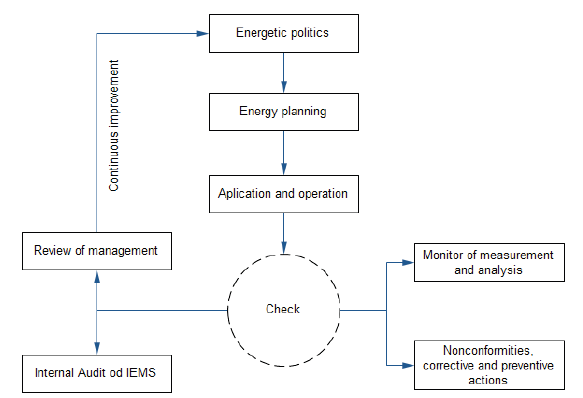
The energy planning process in the production of ceramic blocks was carried out according to the NTC-ISO 50001 standards [15]. The Fig. 2 shows the scheme adapted from the standard, which established the indicators of energy performance.
Most clays are used as raw materials for the construction ceramics industry, 90% of the production is mainly devoted to the manufacture of building materials and aggregates. Only 10% are engaged in other industries (Papermaking, rubber, paints, absorbents, bleaches, molding sands, chemicals and pharmaceuticals, agriculture, etc.) [17-19].
According to their capacity of production and technological development, the ceramic industries have been classified into chircals, small, medium and large [20]. The production process is managed in three strategic measures: Mining, the clay transformation and the commercialization of the final product. One of the final stages of this process is the baking done in the ovens. For its execution, the oven goes through three stages: preheating, burning and cooling; it must be properly controlled, in order to obtain products with minimal defects and reduce environmental impact [21].
The processes always have variation due to the fact that different factors intervene through the 6M: materials, machinery, measurement, labor (personal), methods and environment. Therefore, through the normal or common working conditions, all the M contribute in the variation of the exit variables process, in natural or inherent form, but also contribute special or unusual variations, reason why over time the 6M are susceptible to changes, mismatches, wear, errors, oversights, failures, etc. In this way, two types of variability appear: the one that is due to common causes and the one that corresponds to special or attributable causes. It is because of the above that it is fundamental to distinguish efficiently between both types of variation, and in this way to take the appropriate measures in each case [22].
Statistically, when a process works only with common causes of variation it is said to be in statistical or stable control because its variation over time is predictable. Moreover, regardless of whether the variability is large or small, the performance of the process is predictable in the immediate future, in the sense that its central tendency and the extent of its variation remain unchanged at least in the short term. In contrast, a process in which special causes of variation are present is said to be out of statistical control (or simply to be unstable); these types of processes are unpredictable in the immediate future, because at any moment it may appear again situations either with a special effect on the central tendency or on variability.
2. Materials and methods
The methodology used for the implementation of the Integral Energy Management System in the ceramic industry is developed in three stages as proposed by the guide for the implementation of the "Integral Energy Management System" [23]. These are described below:
2.1. Determination of the process window regarding the energy structure of the company
An important requirement for the development of the methodology is the identification of the energy variables involved in the H-10 block manufacturing process, for which the following characterization was performed:
The state of energy management of the process through the analysis of the production and the energy consumptions associated by stages of the process, all areas of the company were evaluated, including non-productive, taking into account the monitoring performed by the operators in each one of the stages.
The company captures a high level of energy management, backed by the high production generated monthly, so that the following situations are assumed:
The existence of leaders or work teams in charge of the analysis of the monitoring, operational decision making, evaluation of the results of the management of variables and the identification of new potential of increase of the energy efficiency.
Policies based on the integrated management system, written procedures and indicators in all areas with a focus on the control of energy consumption.
Encouraging staff towards a culture of reducing energy costs, encouraging teamwork towards energy efficiency in all areas of the company.
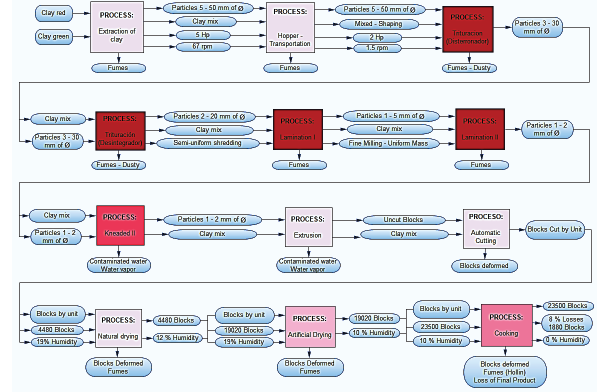
The Fig. 3 describes each of the stages of the productive process that is carried out in the company, the most important are those highlighted in dark color.
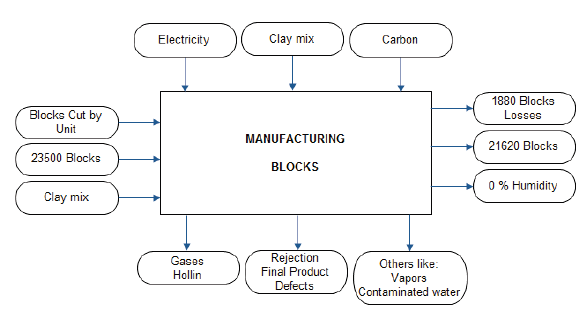
In the Fig. 4, it is generally described the inputs, outputs and wastes required for the manufacture of a block of the company [24].
2.2. Estimating energy savings due to operational variability
Energy saving is immersed in energy not associated with production. In a scatter plot of Energy vs. Production for the process (Fig. 3), the non-associated energy is the value of the intercept on the Y axis of the best fit line to the data dispersion, also known as the Energy Baseline. The relationship between production and energy consumption is linear for most industries, this indicates that the reciprocity exists between the points.
2.3. Application of the procedure for the Energy Planning in the company
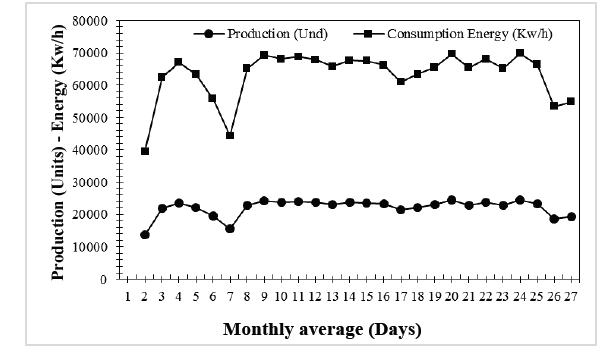
The Fig. 5 shows the simultaneous variation in the time of the consumption of electrical energy with the production (Blocks H-10) corresponding to the I Semester of 2016, in which the data of the days were produced in a monthly period of consumption of electric power (Kw/h) and production (Units).
Source: The Authors.
Figure 5 Analysis of the behavior of electrical energy vs production in the period I-2016.
The Table 1 describes the average behavior of the selected semester for the development of the research.
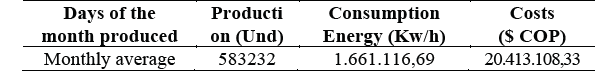
For the semester it is observed that the consumption of electrical energy with respect to production is stable, without the incidence of anomalies, that is to say an increase of the consumption of electrical energy taking into account some of the factors of the 6M, this is due to the manual preventive maintenance is done by company personnel to all equipment every 8 days and contingency plan to maintain stable energy consumption levels. It can be observed that for March 2016, there is evidence of the greater consumption of electrical energy of the brick, but this is due to the increase of production that is directly proportional as long as there are no maintenance faults in the process.
3. Results and discussion
As investigation objective, it was decided to evaluate the stability of the process taking as reference two variables: the Electric Energy Consumption and the Production Index. This is done by using the control charts, in this particular case with the individual chart. This chart is selected because it is applied to processes where there is an extended period of time between one measurement and the next one, where the consumption of electric energy and the monthly production indexes are gathered. This type of analysis makes possible to identify whether the process is working with common or special causes of variation, in order to stabilize it and then evaluate its capacity.
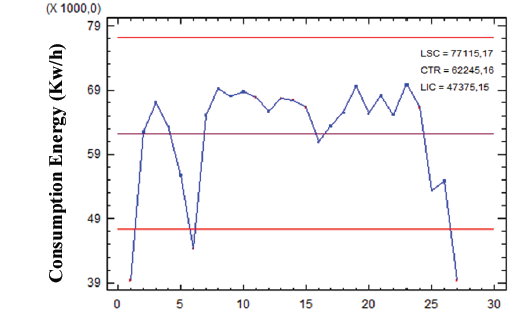
The Fig. 6 shows the individual chart for the Electric Power Consumption (Kw/h) variable for the first half of 2016, by using Statgraphics Centurion software.
To see how unstable the process is proceeding to calculate the instability index using following equation 1:
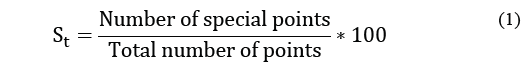
From which it follows that:

The calculated instability index is in the range of 2-5%, so the stability of the process is regular according to the criteria of the statistical book and six sigma[22]. However, due to the characteristics of the variable, good stability can be considered, regardless of the 3 points that stand out from the control graph, which does not affect the stability of the system, so that production in those days of the month was reduced to the half.
3.1. Verification of the normality assumption
To verify the normality assumption, the non-parametric Kolmogorov-Smirnov test is performed with the help of Statgraphics Centurion. The results for both variables are shown in the Table 2.
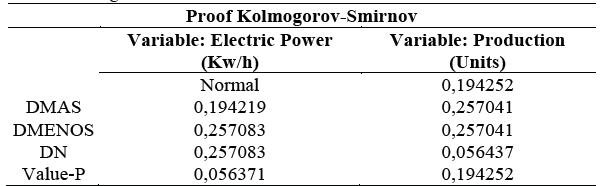
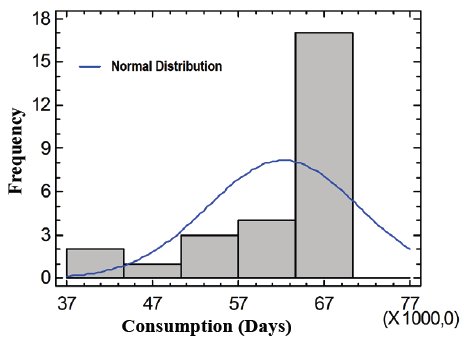
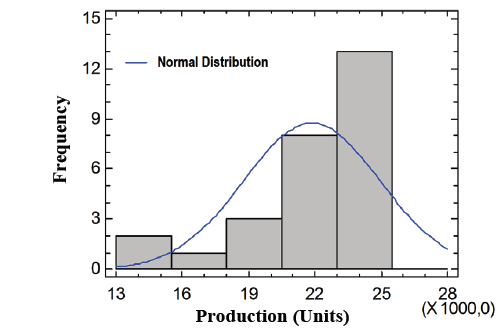
Since the P-value is greater than 0.05, It is worth the idea that both variables come from a normal distribution with 95% confidence. Figs. 7 and 8 allow corroborating the results obtained.
Source: The Authors.
Figure 7 Histogram for the analysis of the normality of the variable Electric Power.
3.2. Evaluation of the capacity of the process. Variable: consumption index (Kw/h)
Once the stability of the process has been evaluated its capacity can also be assessed. In this case we have to get the variable among the best smallest, where it is important that the values are lower than a certain maximum value or higher specification, which in this case is 260000 Units, this is what is contained in the plan production of the company. What is wanted is to verify if the process is able to comply with that specification.
The Fig. 9 shows that the process is able to meet the higher specification which is corroborated with the value of the actual capacity index of the process, this is shown greater than 1.25 which is considered adequate according to statistical book and six sigma for processes with only one specification [22]. By the above, it can be said that the process is not 6 sigma but can be in 3, 4 or 5 sigma.
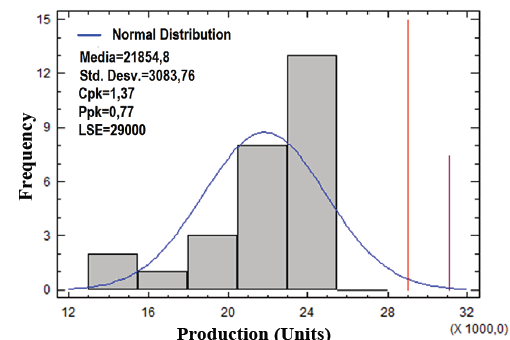
3.3. Identification of areas of significant use of energy and consumption
The company records and analyzes indicators related to:
Taking into account the following specification:
Specification upper limit (LSE) = 29000.0
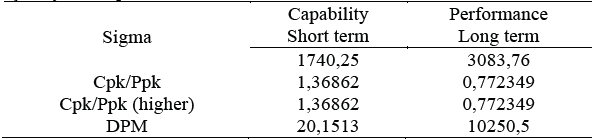
Results from the software in the Table 3 with its respective Fig. 10.
It was found that the variable is strong and therefore the process is stable so the results obtained are shown in Table 4.
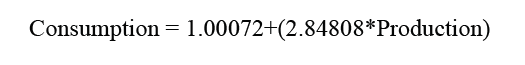
The results are adjusted to a linear model to describe the relation between Consumption and Production, obtaining the following equation of the model:
Since the P-value in the ANOVA Table is less than 0.05, there is a statistically significant relationship between Consumption and Production with a confidence level of 95.0%.
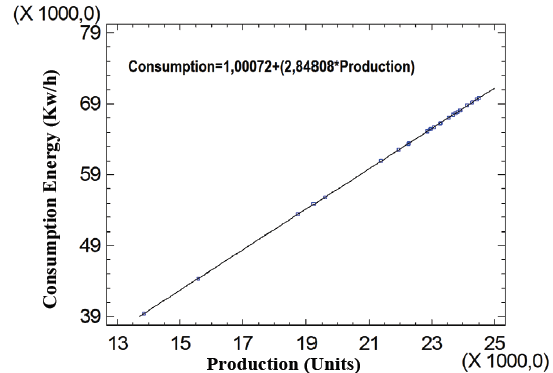
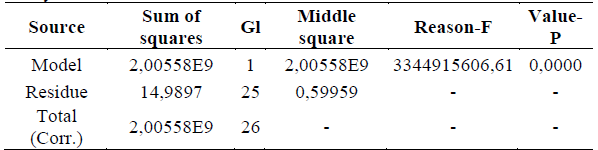
The value of R-Square indicates that the adjusted model explains 100.0% of the variability in Consumption. The correlation coefficient is equal to 1.0, indicating a relatively strong relationship between the variables. The standard error of the estimate indicates that the standard deviation of the residues is 0.774332. This value can be used to construct prediction limits for new observations, in addition it is necessary the analysis of energy not associated to the production by means of the following equation 2:

Where:
Ea = Percentage (%) of Electric Energy not associated with production (Kw/h).
Eo = Electric Energy not associated with production (Kw/h).
Em = Energy Half (Kw/h).
From which it follows that:

Because the energy is not directly associated with the level of production in the company for the period of the first half of 2016, the total values of all processes are added, for example:
Illumination of plants, electricity for offices, ventilation.
Air-conditioned areas.
Energy used in maintenance services.
Vacuum work of electrical or thermal equipment.
Preheating of equipment.
The value of the percentage of energy not directly associated with the level of production (Ea) must be as small as possible, even though this value varies with the type of production and with the type of technological process used, it is a parameter to monitor and control. In this research this value was not taken into account.
4. Conclusions
The structure of energy consumption in the company is made up of electric energy as the first variable in importance, so energy planning is done for this.
The analysis performed for the variable consumption index (Kw / h) shows that the specification of 29000 Units is currently met, but a possible deterioration of the indicator for further performance is identified.
The following is proposed as the energy base line: Consumption=1,00072+(2,84808*Production), with a correlation coefficient of 0.774 and energy not associated with production that is minimal.
Proposals for improvement are made based on efficient planning and implementation of maintenance and good practices for the use and consumption of energy. It is also proposed to monitor the energy management process throughout the daily control and analysis of the variable energy consumption and energy not associated with production in more detail.
The International ISO 50001:2011 standards encourages the integration of energy management systems with quality management systems, production planning and energy planning.
Proposals for improvement should be made in the spot of efficient maintenance planning and implementation and good practices for energy use and consumption. It is also proposed to monitor the energy management process through the daily control and analysis of the consumption and production index variable.

