


 Inglés (pdf)
 Articulo en XML
 Referencias del artículo
 Enviar articulo por email
 Citado por SciELO
  Citado por Google
  Similares en
SciELO
Similares en
SciELO  Similares en Google
 Permalink
1. Introduction
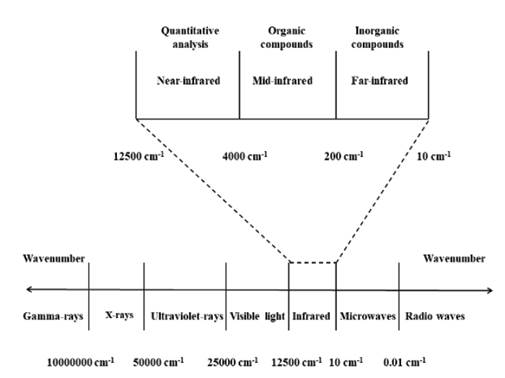
Fourier transform infrared (FTIR) spectroscopy is a nondestructive chemical characterization technique that encompasses the wave number range of 12500 cm-1 to 10 cm-1 of the electromagnetic spectrum (Fig. 1). This spectral zone is divided into three regions: near-infrared (12500 cm-1 - 4000 cm-1), mid-infrared (4000 cm-1 - 200 cm-1) and far-infrared (200 cm-1 - 10 cm-1) [1-4]. This instrumental technique is based on the dipole moment (μ) and the molecular vibrational frequency. The first term is based on the polarity of a chemical bond (+δ - δ-) within a covalently linked molecule (e.g., +δH-Clδ-), if the value of μ is different from zero it is possible to absorb IR radiation. The second term is based on the frequency of the IR radiation (emitted by the IR spectrometer lamp), which must correspond to the molecular vibrational frequency of the chemical bond for which its vibration is possible. When these conditions are fulfilled, the molecular bond can experience different types of vibrations, which are grouped into two categories, stretching vibrations (changes in bond length) and bending (changes in the bond angle).
Within these two categories, vibration signals can appear in the range of 1200 cm-1 to 600 cm-1, which is called the “fingerprint region” of the chemical bond studied or a sample. In this region, the molecular vibrations are unique for each compound, therefore, this area is very important accurately to characterize chemical compounds [5-10]. It should be noted that the fingerprint region falls within the mid-infrared, which is also called fundamental infrared because organic molecules and most inorganic substances absorb IR in this region. The fingerprint region is very important to characterize structures such as polymers. Polymers are macromolecules formed by repetitive units called monomers which are covalently bonded. The crystallinity and structural order, two very important characteristics of a polymeric material to define its application, are generally determined using X-ray diffraction and nuclear magnetic resonance, respectively. It is known that operationally these two characterization techniques require a high consumption of electrical energy and expensive reagents to perform an analysis compared with an FTIR analysis. Therefore, this last instrumental technique becomes a very important tool to obtain information about the crystallinity and structural ordering of a polymeric material from the fingerprint region analysis of its IR spectrum. However, this area is almost never discussed because of its complexity due to the large number of signals that appear in it. In the literature, we find IR analysis for homopolymers such as rubber and poly (methyl methacrylate) (PMMA) [11-12]. However, there are few studies related to the fingerprint region analysis of a copolymer such as ethylene-vinyl acetate (EVA) [13-14].
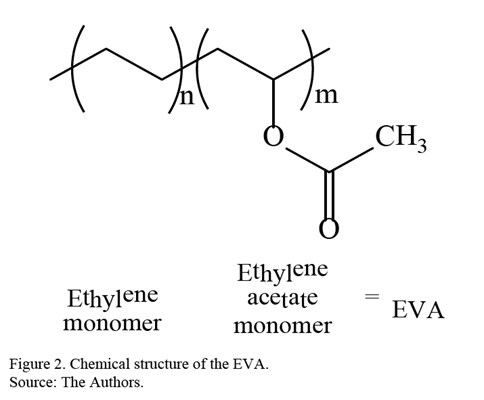
Currently, there are a wide variety of polymers with unique characteristics and properties, for example, polyethylene (PE) and poly (ethyl vinyl acetate) (EVA). EVA is a transparent and flexible plastic used mainly in the adhesives industry and as a drug-eluting device [15-17]. In Fig. 2, the chemical structure of EVA is presented.
On the other hand, the chemical characterization of polymers by IR using their fingerprint region is very complex because in this area multiple signals appear and that is why it is used infrequently. However, the analysis of this region is very important to identify the environment of the monomers and determine the structural characteristics of the polymer. The difference between the EVA polymers is the concentration of the vinyl acetate (VA) group, their FTIR spectra according to the literature are very similar and difficult to assign what is what by this instrumental technique.
In this paper, the fingerprint regions of three FTIR spectra of EVA polymers were analyzed and their structural differences and crystallinities were determined.
2. Materials and methods
EVA was used with different percentages of VA (18%, 28%, 40%) from the company Dupont CoTM. The instrumental characterization was performed using a PerkinElmer FTIR model Spectrum 100 in a range of 4000-550 cm-1 with 16 scans at room temperature. The second derivative and area value of the curve of the vibration signals was obtained using the Origin 8.5 software. Each vibration signal has its own slopes, maxima or minima and concavity, therefore the application of the second derivative of an FTIR spectrum allows uncoupling of two or more overlapping vibration signals.
3. Results and discussion
Infrared spectra of the three EVA polymers are presented in Fig. 3. Qualitative analysis with the naked eye is possible to differentiate between the spectrum of EVA18 with respect to EVA28 and EVA40 by vibration signals of stretching at 3300 cm-1 and the bending vibrations at 1640 and 1560 cm-1 corresponding to the hydroxyl group (-OH), the conjugated carbonyl (-C=O) and the methylene group near the ester group (-CH2CO2-), respectively. These vibration frequencies are similar to those reported in the literature for these groups [18].
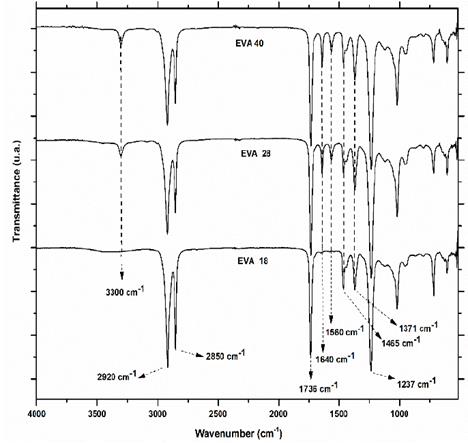
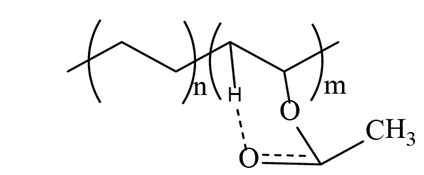
Although the VA monomer does not have -OH in its structure, there is a chemical interaction between the carbonyl group with a neighboring hydrogen atom to form hydrogen bonds (Fig. 4) and conjugated carbonyls, either with the methylene of the VA or of the ethylene monomer. The intensity of the vibration signal at 3300 cm-1 of the EVA18 is lower than with the other two polymers.
This was expected due to differences in VA group concentration between the three polymers. However, it is more difficult to differentiate between the IR spectra of the EVA40 and EVA28, although the VA concentration is higher in the first polymer. The presence of the signals at 1560 and 1640 cm-1 indicates that there is probably a chemical interaction between the chains of the EVA reducing the number of linear chains present in its structure, as well as its crystallinity. However, this information is verified from the analysis of the fingerprint region. In Fig. 5 the IR fingerprint regions of the three EVA polymers are presented.
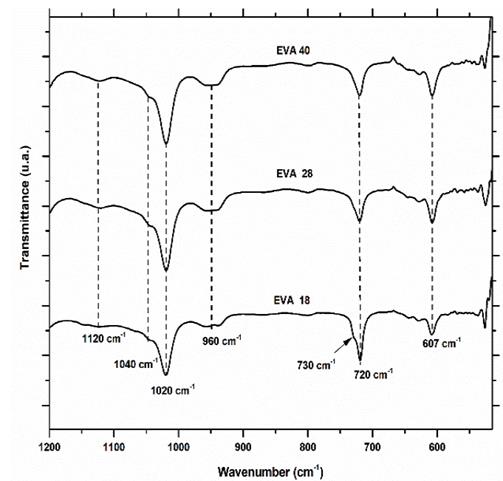
The vibration signal at 607 cm-1 corresponds mainly to the deformation vibration of the methylene groups (-CH2-) of the EVA monomer. From the IR spectra, it is observed that this signal increases its intensity when the concentration of VA increases, this is EVA18 ˂ EVA28˂ EVA40. The area under the curve of this vibration signal for each of the spectra verifies this visual appreciation (Fig. 6).
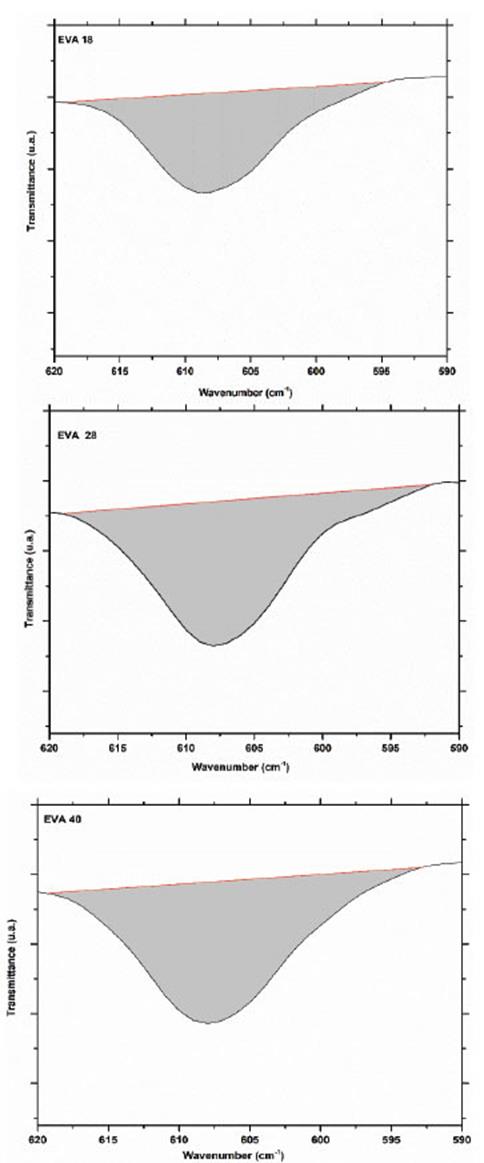
Obtaining an area of 78.2, 122.7 and 125.6 u2 for EVA18, EVA28 and EVA40, respectively. The vibration signal at 720 cm-1 corresponds mainly to in-plane bending or rocking of the methylenes (-CH2-) of the ethylene monomer and as expected, the intensity of this signal decreases in the order EVA18 ˃ EVA28 ˃ EVA40 (Fig. 7).
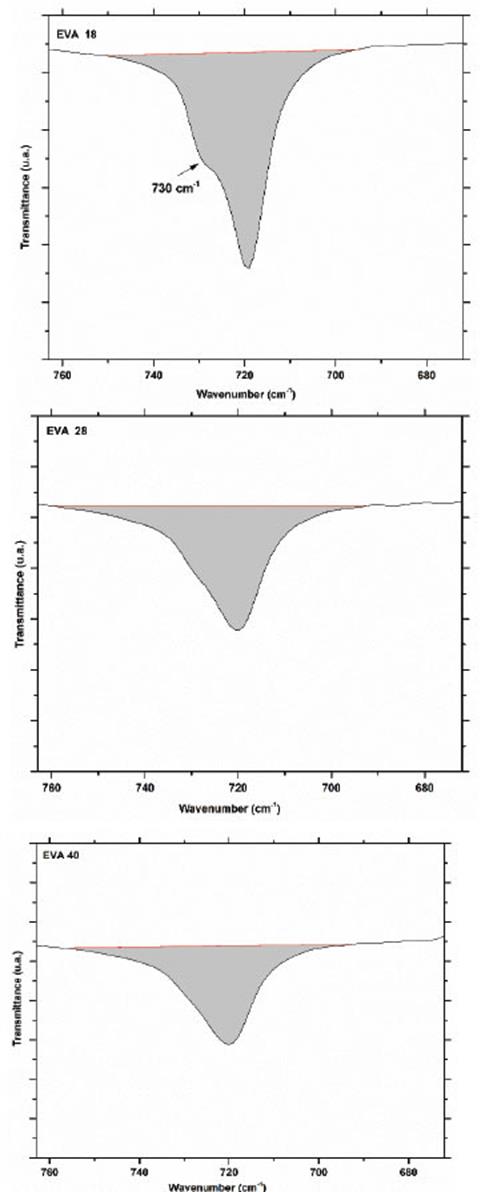
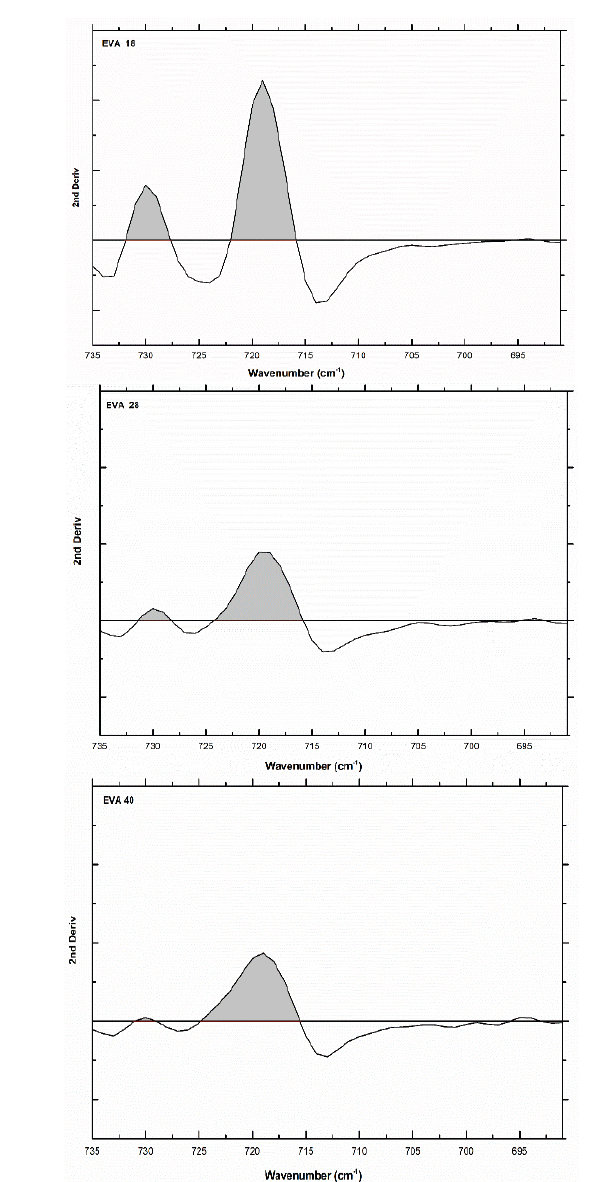
The area under the curve of this signal verifies this trend: 295.6, 238 and 239 u2, for EVA18, EVA28 and EVA40, respectively. Although practically, the EVA28 and EVA40 have the same value. The EVA18 presents a vibration signal at 730 cm-1, which has the shape of “a small shoulder” on the vibration signal at 720 cm-1. This small shoulder indicates that a part of the PE chains has a linear conformation. This signal is overlaid in the EVA28 and EVA40 spectra, but in the second derivative of these spectra, it is clearer to observe the signal, Fig. 8. The second derivative allows uncoupling of two or more vibration signals that are overlapping. In addition, from this second derivative, it is easier to differentiate between the EVA28 and EVA40 spectra. The relationship between the areas under the signal curve at 730 cm-1 allowed finding that there is a decrease of 85% in the linear conformation in EVA28 and 97% in EVA40, both with respect to the EVA18. This decrease is related to the crystallinity of the three polymers due to the linear conformation of the chains favoring the crystalline zones of the EVA.
Source: The Authors
Figure 8 Second derivative of the vibration signal at 730 cm-1 of the three EVA polymers.
Therefore, a lower crystallinity is expected in the EVA40 with respect to the other two polymers. An approximation of the value of the crystallinity could be obtained from Eq. 1 proposed by the authors of this work.

where AV is the area under the curve of the vibration signal at 730 cm-1 and AC is the area under the curve of the vibration signal at 720 cm-1, producing a crystallinity value of 24.39%, 6.95% and 1.03% for EVA18, EVA28 and EVA40, respectively.
These results of crystallinity agree with those reported in the literature for EVA, which has a crystallinity percentage interval of 0-40% [19]. It should be mentioned that the increase in the crystallinity of the EVA polymer is a function of the content of the monomeric ethylene unit, so if the monomeric unit content of VA in the EVA polymer tends to zero, the crystallinity content would increase to more than 40% but would not reach a value of 100% because theoretically there is no totally crystalline polymer because the spatial conformation of the polymer chains during its synthesis is not uniform. Therefore, the analysis of the fingerprint region allows qualitatively to determine the presence of crystalline areas and make an estimate of this. There are other instrumental techniques that allow the determination of crystallinity quantitatively, such as X-ray diffraction (XRD), but it is a more expensive methodology [20].
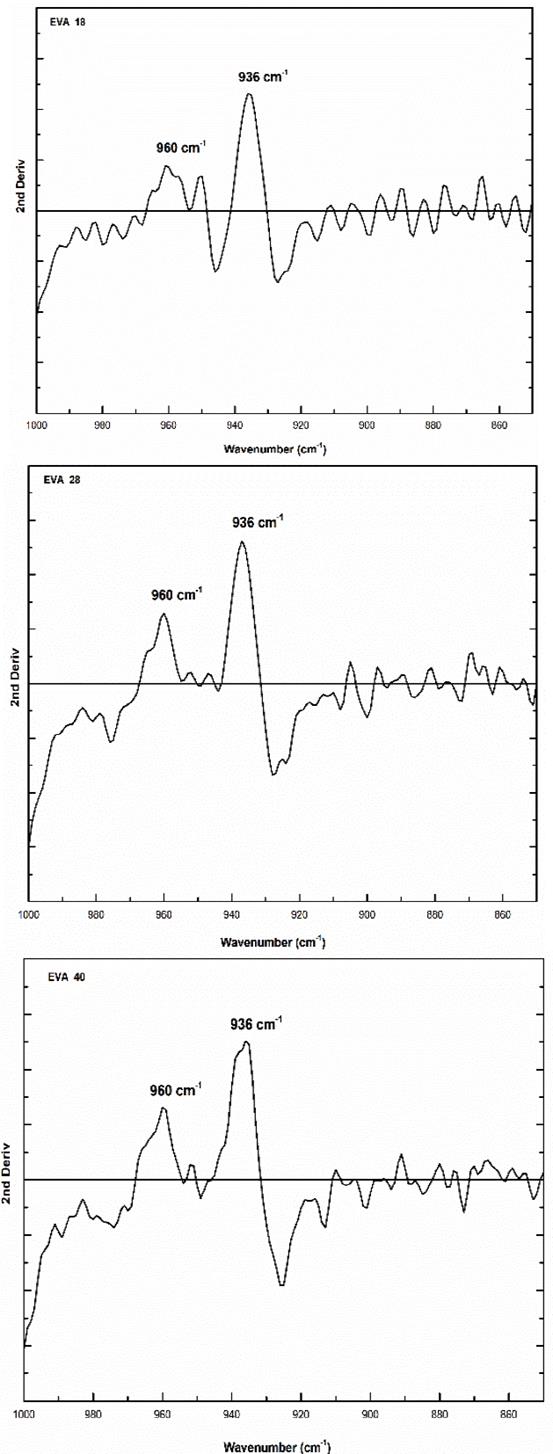
In addition, the analysis of the fingerprint region allows a qualitative estimation of the linear structure of the polymer and by the XRD technique, it is complex to determine it. On the other hand, the vibration signal at 960 cm-1 corresponds to the skeletal movement of the methylene groups (-CH2-)n and it is observed that there is a similarity in the three EVA spectra (Fig. 5). The second derivative of this signal shows that there are significant differences between the EVA18 with respect to the other two polymers, Fig. 9.
Source: The Authors.
Figure 9 Second derivative of the vibration signal at 960 cm-1 of the three EVA polymers.
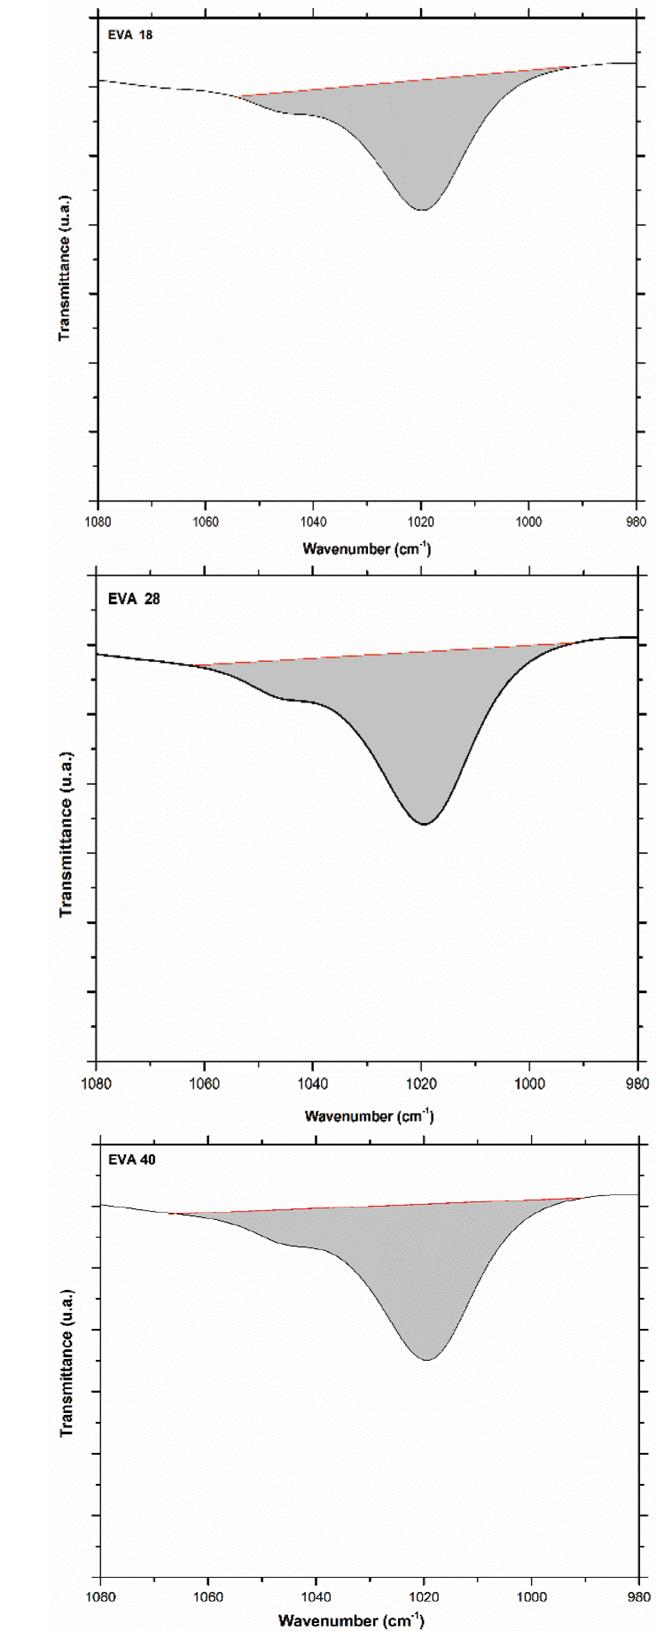
This difference in the number of peaks and their intensity is due to the greater freedom of movement of the methylene groups that the EVA18 has with respect to the other two polymers. This vibrational movement is similar to a dance floor where the dancers are the methylene groups. The VA group decreases this movement, that is, it reduces the degrees of freedom of the polymer chain when its concentration in the polymer increases. On the other hand, the vibration signal at 1020 cm-1 corresponds to the H-C-O bond bending of the VA monomer. The EVA40 has a higher concentration of H-C-O, therefore, the intensity of its signal is greater with respect to the other two polymers as shown in Fig. 10.
Source: The Authors.
Figure 10 Area under the curve of the vibration signal at 1020 cm-1 of the three EVA polymers.
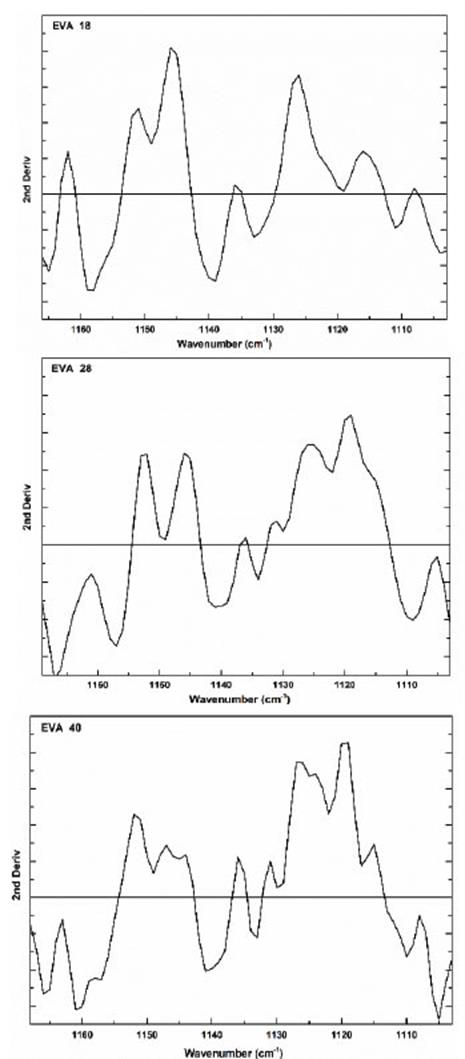
The area under the curve of this vibration signal is 437, 641 and 659 u2 for EVA18, EVA28 and EVA40, respectively. The vibration signal at 1120 cm-1 also corresponds to the H-C-O bond bending of the VA group (Fig. 5).
This signal is very similar in the three polymers; however, in the second derivative, we observed significant differences due to the increase in VA concentration (Fig. 11). In this vibration signal, all the interactions of the -C-O bond with respect to all neighboring atoms are observed. This signal is like a dance floor where the dancers are the group -C-O, the larger the more amorphous the EVA polymer. Therefore, this movement is a function of the concentration of the VA group.
Source: The Authors.
Figure 11 Second derivative of the vibration signal at 1120 cm-1 of the three EVA polymers.
Other signals that appear in the three IR spectra of the EVA polymers (Fig. 1) are at 2920 cm-1, 2850 cm-1, 1736 cm-1, 1465 cm-1, 1371 cm-1 and 1237 cm-1, which correspond to the stretching vibration (asymmetric) of the CH2, the stretching vibration (symmetric) of the CH, the stretching vibration of the carbonyl group (C=O) of saturated ester, the vibration of in-plane bending or scissoring-bending of the methylene (-CH2-), the rocking out-of-plane vibration of CH of the methyl group and to the in-plane rocking vibration signal of the -CH2- group. These vibration signals are similar to those reported in the literature for these groups or chemical bonds [21]. All these results indicate that the flexural vibrations are more intense when the polymer is more amorphous because there is less steric impediment for the bending vibrations, and vice versa, the more crystalline the polymer, the less intense the vibration bending signals are.
4. Conclusions
The fingerprint region is unique for each compound and provides very important information to differentiate polymers that are composed of the same repetitive units. From the analysis of the fingerprint region of the infrared spectrum of the EVA polymer, it is possible to obtain information about its crystallinity and structural arrangement, obtaining crystallinity values of 24.39%, 6.95% and 1.03% for EVA18, EVA28 and EVA40, respectively. The number of linear chains of the EVA copolymer increases as the VA concentration decreases. The VA decreases the degrees of freedom of the ethylene monomer and favors the formation of hydrogen bonds. This analysis of the EVA fingerprint region can be applied to other polymers.

