


 Inglés (pdf)
 Articulo en XML
 Referencias del artículo
 Enviar articulo por email
 Citado por SciELO
  Citado por Google
  Similares en
SciELO
Similares en
SciELO  Similares en Google
 Permalink
1. Introduction
Currently, Big Data is one of the most popular terms in information systems and is used to describe large volumes of data that are exploited to gain competitive advantages in the case of private companies or achieve efficiencies in the case of public organizations. The main challenge of such organizations is the management of these vast data, their collection, processing and analysis. However, the information obtained from the Big Data analysis depicts that the function of insights is key to competitive advantage, allowing them to make timely decisions, optimize resources and even prevent disasters [1].
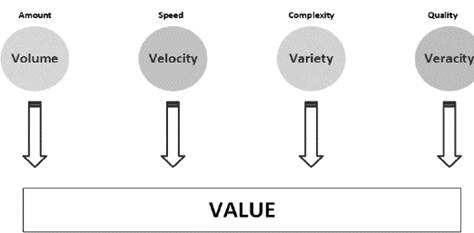
For a set of information to be considered as Big Data, it must comply with certain properties. Among others, these are the most frequently mentioned: volume, velocity, variety, veracity and value [2]. The main goal of Big Data is to obtain value from the data analyzed.
The continuous generation of data in smart devices, sensors, social networks, web browsing and the deployment of the Internet of Things (IoT), among other technologies, has prompted researchers’ interest in the development of new solutions for the management of this massive quantity of data. Through these solutions, it has been possible to add value to the gathered data, and one of its applications has enabled social problems to be tackled, such as overcrowding, transportation, environmental pollution, safety, health and migration [3-5]. In addition, Big Data also supports the creation of innovative products and services that have a positive impact on society [6]. Society is moving into the information age and the use of Big Data promotes innovation in administration, strengthens the competitiveness between companies and contributes to productivity improvement [3].
Many countries have adopted the advances in Big Data analysis for social matters, and South America is also gradually adopting it, but is still in the initial stages. According to a forecast, in 2023, it is expected that Big Data in Latin America will reach US$ 8,593.5 million in revenue [7]. Latin America is facing a great challenge due to the fact that traditional professions are disappearing, and the global economy is becoming more based on skills and knowledge than manual work. The current Industry 4.0 trend provides the ability to take advantage of data and digital technologies in order to accelerate modernization and offers the opportunity to strengthen the economy [8].
According to the United Nations, the world population will reach 8,600 million inhabitants by the year 2030, 9,800 million by 2050 and 11,200 by 2100; consequently, there will be a clear increase in food demand [9]. To cite an example, agriculture has been one of the economic sectors in the region, particularly in Argentina, where Big Data integration proposals have been suggested. A study conducted in Argentina considers agriculture to be one of the main areas to meet these needs and demonstrates that the inclusion of Big Data fosters improvements in the management of agricultural processes [10].
Agriculture in Argentina supplies 400 million people and contributes approximately 9.3% of the country’s GDP. Around 75% of agricultural production corresponds to cereals with a production of approximately 3.4 million tons per year. Argentina is the main exporter of soybeans with more than 50% of the market. With Big Data and other technologies such as GPS, the Internet of Things and machine learning, precision agriculture is possible through the generation of reports on weather, soil conditions, water resources, market demand and production logistics [10].
In this paper, we present studies from some countries that have adopted Big Data for decision-making in problems related to economic sectors. Based on the studies that fit the region’s reality, stages are detailed with the list of activities that must be performed so that Big Data can be efficiently used by e-government. With this objective, the following research questions have been posed:
What studies exist related to Big Data integration in e-government?
Can Big Data be integrated in e-government decision-making processes?
The main contribution of this study is to present a framework focused on the great potential of Big Data integration in the decision-making processes related to a country’s economic sectors. As far as we know, this is the first approach to define this kind of framework. Scientific digital libraries were examined and several works about Big Data and e-government were available, but we did not find a specific study about a framework.
The next sections of the article are structured as follows: section 2 characterizes Big Data with basic definitions of its properties; section 3 presents a brief literature review related to Big Data analysis solutions for social purposes published in scientific articles; section 4 defines the reference framework for the integration of Big Data in e-government decision-making processes and details all the activities for its implementation; section 5 presents a case study where the proposed framework is applied to Ecuador in the environment protection sector. Finally, section 6 presents the study’s conclusions and suggests future work derived from this article.
2. Characterization of Big Data
As mentioned above, Big Data is the name given to data that complies with certain properties, from which the most commonly used are briefly explained below.
Volume refers to the large amount of data produced, in the order of terabytes and upwards. Velocity concerns the speed in which information is produced within a small period of time. Variety corresponds to the distinct types of data that can be handled, such as structured, semi-structured or unstructured data. Structured data are organized in rows and columns as in a relational database; semi-structured data also have structure but they are not organized as in a relational database, for example, log files and metadata; and unstructured data have no format, for example, images and videos [2]. Veracity relates to data acquisition from reliable sources, and without errors. Value refers to the data’s usefulness for the process of knowledge generation [1].
Fig. 1 represents the main characteristics of Big Data, all of which converge to the value of the data. This characteristic, the value, is considered the most important because it allows us to generate useful guidelines for decision-making.
3. Literature review
The idea of integrating Big Data in e-government decision-making systems stems from the literature review on existing innovation studies in scientific databases about Big Data and the sectors of interest for a government. This literature review aimed to identify the latest and emerging trends, and it was conducted from 2015 to 2018.
The 314 studies that were found mainly tackled the application of Big Data in agricultural and natural resources exploitation, environmental protection, health and social care, housing, education, the economy, employment and transportation management. From these studies, 23 were deemed relevant according to our interest in proposing a frame of reference and presented case studies that contributed to our proposal’s development. Below is a brief explanation of how these studies fell within the article’s area of interest.
Torres et al. [11] presented a study based on deep learning, which allowed the prediction of the amount of photovoltaic solar energy that will be produced throughout the next day. This study facilitated ensuring a stable supply of electricity in Australia by analyzing Big Data from solar energy production records gathered from the two previous years.
Zuo et al. [4] used Big Data analysis to measure urban pollution through an indicator called PM2.5, which measures particles smaller than 2.5 microns generally present in emissions from diesel vehicles. Due to their penetration capability in the respiratory tract, they pose serious health risks to living creatures, especially human beings. The article reflected the results of an investigation into the interiors of buildings in the city of Beijing. In the same context, there were several other studies focused on air pollution monitoring by Big Data analysis techniques [4,5,12-18]. Some focused specifically on vehicular congestion [19-20], while others examined the adverse effects that occur in humans, such as infertility [21].
Zhang and Mi [22] conducted a Big Data analysis to quantitatively estimate the impact that bicycle-sharing would have on lowering energy consumption and emissions of carbon dioxide (CO2) and nitrogen oxide (NOx) in Shanghai. In conclusion, they identified the existence of greater positive environmental impacts if bicycles were shared during heavy-traffic periods: in the morning and at night.
In China, Cheng and Liu [23] analyzed Big Data on the web to explore how government attention to companies can influence their environmental performance. Consequently, they determined that companies with greater public attention are more aware of the importance of protecting the environment.
Regarding the analysis of Big Data applied to agriculture, Escudero [10] presented a case study in Argentina, which identified that the application of Big Data in agriculture allows for improvements in process management. The decision-making generates positive economic impacts in the agricultural production value chain by prioritizing benefits and reducing costs and risks, among many other advantages.
Jinbo et al. [24] presented a proposal based on IoT, Apache Hadoop, which is a platform for Big Data analysis, and machine learning techniques, to manage agricultural production in China. The proposed solution enabled agricultural ecological environment monitoring through the collection, transmission, storage and processing of Big Data, using the processed information to later perform production control and reporting. As a result, the proposal aimed to solve three basic problems: resources scarceness, environmental deterioration and quality problems in produced goods.
Wright [25] discussed the application of Big Data analysis and its success in different companies. For instance, while Shell uses Big Data to monitor equipment performance and to forecast oil and gas reserves, CERN uses it on the 30 petabytes of data produced per year by sensors that monitor millions of subatomic particles generated by colliding particles in order to grasp the fundamental structure of the universe.
Yang [26] performed a literature review in which Big Data was used to determine the impact of corruption on Asian countries’ economic growth.
Holm and Ploug [27] presented Denmark as a society that has focused on the analysis of Big Data for health care, education, employment, housing and pollution. With governmental regulation that facilitates the usage and disclosure of public data, it was possible to achieve great research advances; however, they are currently proposing a consent model for data usage that would allow access to private records for research purposes. This study provides our proposal with a guide to promote Big Data e-governance in South America.
Tseng et al. [28] presented the development of a solution, based on Big Data platforms, to take decisions in situations of vehicular congestion in the Taiwan Area National Freeway Bureau. Their proposal was implemented on Apache Storm to analyze enormous amounts of streaming data, such as road density, traffic events and climate conditions to predict traffic congestion.
Sanchez et al. [29], in a study conducted between 2006 and 2013 amongst Latin American countries, and through data mining techniques, determined that Brazil was the country that had the most controls of gas emissions in its electric power generation.
Fernandez et al. [30] used machine learning techniques and data acquired through sensors to perform a predictive analysis of hypertension levels in Cartagena’s inhabitants in Colombia. This study aimed to create proactive programs among patients suffering from this ailment.
The studies described above demonstrate the potential that the integration of Big Data has in this digital age and the great research opportunities that it can provide in strategic sectors. The analysis of Big Data is expected to assist in overcoming regional economic and environmental challenges.
Following the literature review, and as mentioned by Seo and Lee [5], it can be concluded that the integration of Big Data is an important key to counteract current social problems through public and private ordinances.
In the studies presented, two areas stand out: Big Data engineering and Big Data management. In the engineering aspect, the acquisition and preparation of the data is carried out; while in the management function, Big Data is analyzed and then information is acquired based on the results obtained. Therefore, the referential framework proposed in this article contemplates both areas.
4. Proposed framework
In order to promote the use of Big Data in economic sectors, and based on case studies from other regions, three main phases were established to aid the implementation of the reference framework: diagnosis, planning and implementation. The respective activities from each phase are detailed in Table 1.

In the diagnosis phase, it is necessary to gather information about existing regulations and restrictions that may influence, in a positive or negative manner, the adoption of the solutions identified in the literature review, and to identify all sources capable of providing the required data.
During the planning phase, the Big Data integration framework and the entities responsible for its implementation are established. Based on section 1 Introduction and section 3 Literature Review, the proposed Big Data integration framework focuses on the economic sectors of e-government, such as education, health and social care, transportation, agricultural and natural resources exploitation, housing, construction and environmental protection. The objective of the frame of reference is to identify the procedures that must be followed by public or private entities in charge of processing and analyzing all the information generated, for later decision-making processes by the government.
In the implementation phase, the governments, through their ordinances and policies, should carry out the implementation of the frame of reference and analyze their existing challenges and opportunities.
Due to the scope of this study, we have focused on the planning phase. Fig. 2 presents the proposed Big Data integration framework, to carry through the planning phase. The framework has been divided into three stages: Big Data production, management and analysis.
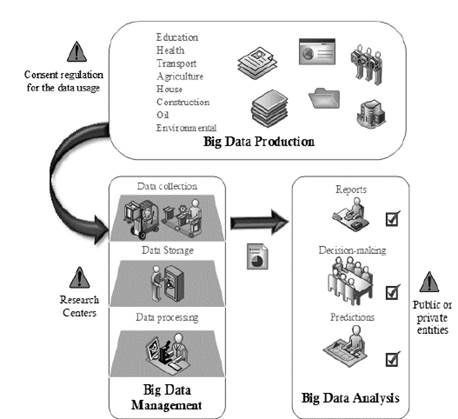
The following paragraphs detail each stage of the proposed framework for the integration of Big Data in e-government.
4.1. Big Data production
Big Data production refers to the identification of data sources related to the economic sectors. These may be public or private databases, regulatory entities’ registers, census and survey information, data generated by smart devices, social networks and IoT equipment, among others. In addition, it is very important to ascertain whether any consent regulation exists regarding data usage for research purposes. It is worth noting that at the time of verifying the data, it must comply with the properties outlined in section 2 Characterization of Big Data. This information and any other that may have been considered relevant during the development of the project should be identified in the diagnostic phase.
4.2. Big Data management
Once the data sources have been identified, we proceed to the management of Big Data. In this stage, there are three main processes: data collection, data storage and data processing. The process of transmitting data from the source to the storage equipment comprises the data collection. For the storage and data processing, it is deemed important to define whether it is necessary to have a research center to oversee these tasks. During the processing, data must be explored, and the necessary pre-processing operations carried out. These may consist, for instance, of data cleaning, data transformation or data packaging operations. In addition, at this stage it is convenient to perform a preliminary analysis of the information to detect and correct possible inconsistencies [31,32].
The tools or platforms used in this phase are independent of the frame of reference, because they should be based on the Model Driven Architecture (MDA), specifically the Platform Independent Model (PIM) [33].
4.3. Big Data analysis
After processing the data, the next step is the analysis of the information produced by Big Data. This involves the evaluation of the results obtained that allows reports to be generated, predictions to be made or decisions to be taken. Likewise, it is necessary to define which public or private entities will be responsible for taking actions based on the results obtained.
Within this phase, it is possible to select which analysis techniques are considered to be more appropriate and, in addition, models for future usage can be designed and built [34]. It is important to consider the efficiency of the operations, the quality of the data and its security. As in Big Data management, the framework proposes the use of PIM to make the model independent from the platform.
Once the three stages have been completed, the results obtained should be conveyed through reports in order for the decision-making entities to take decisions and act appropriately for the country’s economic sectors. In turn, this will provide an incentive for other technological innovation projects capable of augmenting knowledge, innovation and development in both national and international contexts. It is important to mention that the three stages are iterative and the tools and platforms used must be scalable to cope with increasing and rapidly changing volumes of data.
Regarding the generation of government policies, there are several research proposals that can be applied to e-government, such as challenges in policy application [35], strategies that can be adopted [36,37], recommendations for applications in agriculture, health and transport [38] or the promotion of these policies [39].
5. Case study in Ecuador
Due to the establishment of governmental policies allowing access to open data from economic sectors, Ecuador was selected as a case study in order to provide the reader with an example of the implementation of the proposed reference framework. Additionally, new challenges are proposed in the Plan Nacional de Desarrollo 2017-2021 [40] in order to push the country’s development, centered on three main axes: equal rights and opportunities for everyone during their entire life; the economy at the service of the society; and social and government interconnectivity.
One of the main objectives is to achieve independence in the exploration of natural resources, through the production of value-added goods and services provisioning, guaranteeing natural resources, ecosystems, species and climate protection. As explained in the Plan Nacional de Desarrollo 2017-2021, the Ecuadorean economy has always been based on natural resources’ exploitation, which has limited the technification of its industrial fabric and affected environmental sustainability. Dependence on natural resources has also limited the growth of the country’s GDP when resources are scarce or disappear. As an alternative, the use of applied technologies to increase productivity, in terms of knowledge, innovation and technological development, is proposed.
Based on this governmental policy, and on the successful case studies provided by international experiences, Ecuador can also use the large amount of data produced by different devices in order to improve Ecuadoreans’ quality of life and the government’s credibility. To achieve this goal, Big Data analysis is the key to assessing the current needs and trends in society [3].
For the aforementioned reasons, several ventures have been proposed in the country, at a corporate level, related to Big Data analysis for incorporating information and communication technologies (ICT) in the industrial sector. Morán and Cañarte [41] presented a bibliographic study of ICT incorporation in small- and medium-sized enterprises (SMEs) with an emphasis on the adoption of Big Data platforms. An issue of the Ecuadorian magazine Líderes highlighted successful case studies from companies that had used Big Data analysis in their processes in Ecuador; for instance, Teojama Comercial observed a 10% sales increase in the same year of its implementation [42]. According to the company Vía Inteligente and its WiFi Tracking methodology, the application of Big Data analysis in the touristic area of Quito attracted 11.38% more customers throughout 2018 [43]. However, according to Stephen Brobst of the Teradata company, when compared to other countries in the region, Ecuador is a new market for Big Data, and it is now the right time to adopt it and generate an optimal competitive environment [44].
From the previous examples, it can be concluded that Big Data in Ecuador is being adopted by private entities for the improvement of their own commercial strategies. However, its area of application is much wider and can assist in solving important public problems in the areas of health, education, housing and environmental protection, among others. In conclusion, the Big Data paradigm currently revolves around the business world. Therefore, the proposals for its use in e-government are timely.
In order to depict the application of the proposed model, a case study in the Ecuadorean environmental area is presented. Firstly, the open data bank from the Instituto Nacional de Estadística y Censos (INEC) of Ecuador1 has been identified as a suitable Big Data source. This organization is considered to be a reliable source, because it is an official organization of the State, which is responsible for the production of statistical information in Ecuador.
The 2011 year corresponds to the initial available date of this open data source; the latest available year for data is 2016. The purpose of this case study is to determine the current number of energy-saving luminaires installed in domestic households and estimate their usage until 2020, as an example. Subsequently, waste management ordinances for these types of luminaires can be created with the data obtained.
5.1. Big Data production
As mentioned in the previous section, the planning phase proposed a reference framework consisting of three stages: the production, management and analysis of Big Data. In terms of production, for this case study, the INEC was the source of Big Data, because its website contained the necessary information about the number of energy-saving luminaires in households from Ecuador.
Regarding data usage consent, INEC provides its data under the Creative Commons 4.0 license, which allows legal sharing, repurposing and remixing, as long as credit is given to the original creator. Among the several data formats available for the required analysis, the CSV format was selected as it can easily be processed by several programming languages, for instance, Python.
As INEC only provides data from 2011 to 2016, the main challenge at this stage was to identify the data files that contained the required source data, in this case, the number and type of luminaires installed across the country.
For the development of this case study, it was necessary to manually locate the data in the INEC data bank. This was found under Información ambiental en hogares - Encuesta Nacional de Empleo, Desempleo y Subempleo (ENEMDU)2. In conclusion, at this stage the main challenge was the efficient provisioning of data for further processing and analysis.
The data obtained can be considered as Big Data because it complied with all of the characteristics and properties of Big Data enumerated in section 2 Characterization of Big Data: volume, velocity, variety, veracity and value. These characteristics are detailed below.
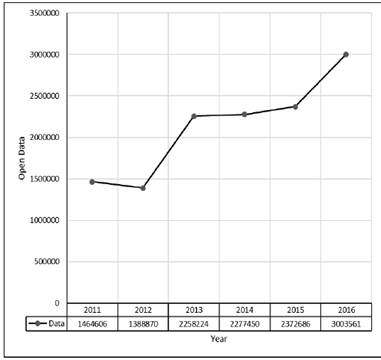
5.1.1. Volume
Fig. 3 displays the growth of available data from 2011 to 2016. For this case study, the data obtained from a single file were:
For the year 2011, there were 1,446,606 records.
For 2012, two documents existed; one corresponded to the month of June that consisted of 1,297,520 records and another to December with 1,388,870.
For 2013, 2,258,224 records.
For 2014, 2,277,450 records.
For 2015, 2,372,686 records.
For 2016, the amount of data increased to 3,003,561 records.
5.1.2. Variety
Although the data format was unchanged in CSV format over the years, it was observed that the data structure only stabilized in 2014 and that previously the nomenclature used changed year after year. This is because the norm that regulates and standardizes open data preparation and publication in Ecuadorean public administration entities has been in force since 2014 [45].
Some of these structure changes are listed below:
In 2011, energy-saving luminaires were under code AM242, which corresponded to field 65.
In 2012, no data was collected regarding in-home luminaires.
In 2013, code A15A was used and the data were in field 47.
As of 2014, the subject was represented by code A07B and maintained in field 24.
The data had to undergo an Extraction, Transformation and Loading (ETL) process in order to obtain the required information.
5.1.3. Velocity
If the 2011 and 2016 years are compared, an increase exceeding 100% can be observed during this five-year period, in just a single file. The problem was that the data were generated at such a speed that, without applying reduction techniques, it may not be possible to promptly process and store the data in its entirety.
5.1.4. Veracity and value
The data obtained can be considered to be valid because they were obtained from a reliable source, such as the INEC, under the Open Data Public Policy Guide [45]. With respect to the value provided by the data, this is demonstrated during the management and analysis phases of the proposed model.
5.2. Big Data management
Once the data of the ENEMDU survey had been collected, it had to be stored and processed for further analysis. In the management phase, it is necessary to process the data so that it becomes valuable information for the country’s private and public sectors.
For this case study, the first challenge was to identify the location of the data associated with the number of in-home energy-saving luminaires in each file. As mentioned earlier, the data structure was not the same across the source data files. For this reason, it was essential to perform a pre-processing activity over the collected data; thus, every file had a standardized structure.
The second challenge was to infer the missing data for 2012, because the survey did not reflect this data for the months of June and December. To resolve this matter, linear interpolation based on the data of 2011 and 2013 was applied. Other techniques could have been used, but as this was a demonstration case study for the proposed frame of reference, one of the simplest methods was employed.
According to several studies, when different methods for the imputation of missing data are compared, for a complex Big Data analysis the neural networks present a lower mean square error (RMSE). However, if less computation time is required, linear regression may be preferred, for example, the linear model with multiple imputation (MICE) [46,47].
Fig. 4 presents the data obtained from the INEC open data bank. Information regarding the year 2012 has already been corrected and a projection for the years 2017 to 2020 is included. This projection was performed using linear extrapolation with data from previous years. Extrapolation was used as a simple way to predict data.
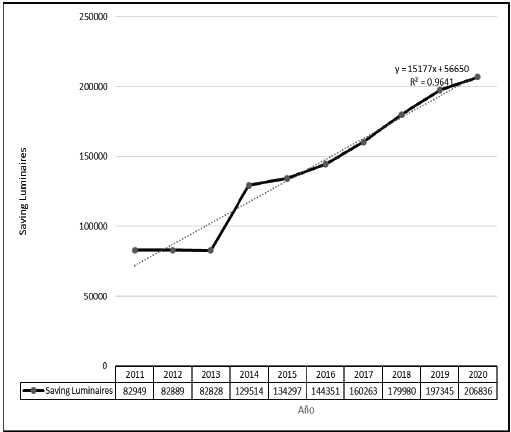
Source: The Authors.
Figure 4 Number of energy-saving luminaires in homes 2011-2016 according to INEC.
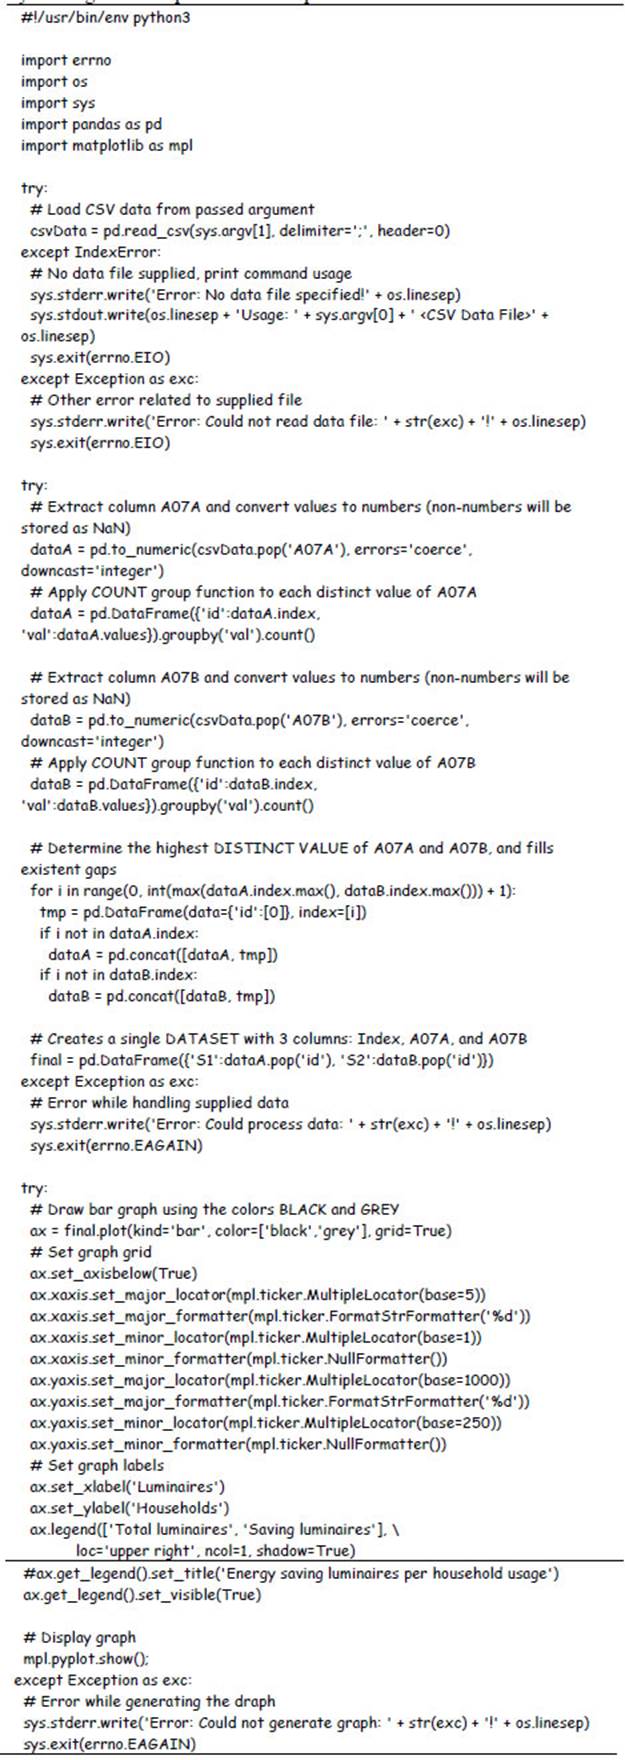
With the same data, a comparison was made between the total number of luminaires and those households equipped with energy-saving luminaires per house for the latest available year, that is, 2016. To achieve this goal, the Python programming language was used, and its code is displayed in Table 2. In a quick overview, the code allows the data to be loaded from a CSV data file and presents the information of interest in a graphical manner, in this case the number of in-home luminaires.
Fig. 5 shows the execution result of the Python code, where black bars correspond to the total number of in-home luminaires and the gray bars represent the number of in-home energy-saving luminaires in Ecuador. The data presented corresponds to the year 2016, which is the latest year of available information.
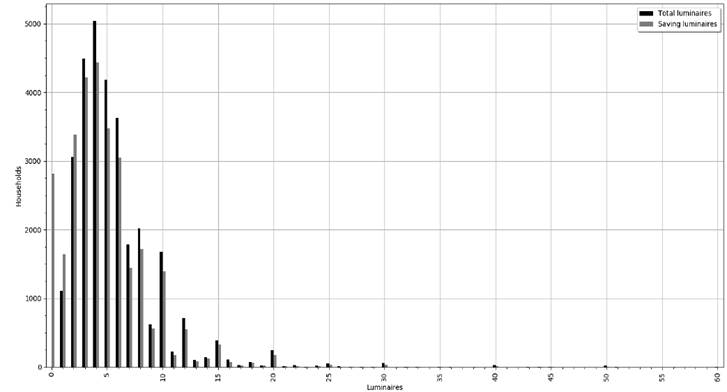
This is a basic example of some of the information that can be produced using currently available open data, without using complex programs. Using similar methods, additional information can be extracted and deduced from INEC through the same CSV file. This includes information such as garbage waste disposal, batteries usage, water consumption, energy consumption, transportation system usage, land usage and occupancy.
5.3. Big Data analysis
During this stage of the case study, it was essential that experts in the environmental area analyzed the information and determined the appropriate measures according to existing regulations. In Ecuador, the most important entity responsible for analyzing and acting in accordance with this information is the Ministerio del Ambiente3.
According Fig. 4, there has been a growth in the use of energy-saving luminaires in homes that follows the expression y=15177x+56650, being the variables y the year and x the number of energy-saving luminaires. As result, Table 3 presents the growth in the adoption of energy-saving luminaires in Ecuador.
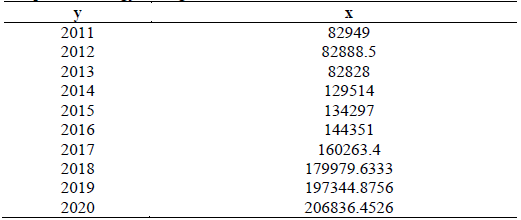
Hence, a clear increasing trend can be observed regarding the adoption of in-home energy-saving luminaires. As these types of luminaires use small amounts of mercury, on average 4 mg [34], it could be concluded that the first decision to be made in the environmental sector would be a waste management policy targeted for this kind of luminaire, in order to avoid ecological risks, such as land or water poisoning.
It is important to underline that mercury is a persistent chemical element considered highly toxic and can affect the nervous system, the skin and DNA, among other affections, in humans [48].
6. Conclusions
This article presented studies in countries that have applied Big Data analysis to different social contexts, such as agriculture, environment, health, transport, economy, education, employment, housing and natural resources, among others. A brief literature review was conducted to examine scientific databases. Twenty-three studies were identified according to our research topic, which demonstrated how countries such as Argentina, Australia, China, Denmark and South Korea have integrated Big Data solutions to improve the life quality of their citizens and their processes.
Based on the research identified, this study proposed a framework for Big Data integration in e-government decision-making, covering production, management and application. The goal of the proposed framework was to be a reference in South America to accelerate the progress of technology, which is exhibiting a delay compared to other regions. Finally, a case study was presented using open data obtained from the INEC. Although Ecuador already had several successful cases of the adoption of Big Data, these were for commercial purposes whereas this proposal focused on the sectors that sustain the Ecuadorean economy.
As a result, we found a clear need for a waste management policy targeted to energy-saving luminaires. A policy is needed due to the increasing trend of the adoption of these types of luminaires. If such a policy is not adopted, there might be negative effects in the environment.

