


 English (pdf)
 Article in xml format
 Article references
 Send this article by e-mail
 Cited by SciELO
  Cited by Google
  Similars in
SciELO
Similars in
SciELO  Similars in Google
 Permalink
1. Introduction
This study is part of a line of research which proposes that earthquake hypocentral parameters can be calculated by applying artificial intelligence methods, in order to develop an early warning system for the city of Bogotá. Almost a third of Colombia’s population live on the Bogotá savanna and surrounding areas, as it is the main economic center of the country producing almost 40% of the gross domestic product [1]. For this reason a seismic early warning system for Bogotá is very important, and geographic latitude and longitude are some of the main parameters for this system. The task of an early warning system is to estimate earthquake hypocentral parameters in a short period of time with the best possible accuracy [2]. Contrary to prediction, seismic early warning systems emit an alert a few seconds after the event initiates, and from few seconds to a few tens of seconds before the stronger shaking movement starts.
Many early warning systems employ dense seismological networks to determine magnitude and localization using at least three stations with a very good accuracy [3-7], however, the density of seismological stations around Bogota is not high enough and they are too far away to conform to the travel time requirement for seismic events localization. A solution to this problem is to use seismological data from previous events recorded at one single station to calculate the earthquake hypocentral parameters [8].
The common way to calculate hypocentral parameters consists of applying velocity models for different earth rock layers and processing travel time signals of P and S waves recorded by seismic stations [9]. In recent years, alternative approaches based on machine learning techniques have been developed, most of them using genetic algorithms (GA) and fuzzy logic (FL). The FL approaches allow for the efficient exploration of the search area [10], while the GA are mainly used to determine the X, Y, Z coordinates of earthquake hypocenters [11]. Automatic computation algorithms in a single broadband three-component station have principally been developed for P and S waves onset detection, estimating earthquake location and the apparent surface speed [12-14] or seismic moment estimation [2,4,5,15-17]. Supervised machine learning techniques based on kernel methods have become a powerful tool for mathematicians, scientists and engineers, providing solutions in areas such as signal processing and pattern recognition.
Their implementation is quite simple and can be performed by applying mathematical functions that combine input variables as combinations of themselves, obtaining a new, enhanced space with more dimensions that facilitates the separation of classes. The methodology proposed in this study consists of applying support vector machines (SVMs) along with kernel functions in order to determine geographic latitude and longitude with the minimal processing of data acquired at the station, similar to the methodology applied in the fast determination of earthquake magnitude [18], epicenter distance [19] and depth [20] using a single seismological station.
2. Data set used and methods applied
In this research, the data set was collected at El Rosal seismological station, located northwest of Bogotá as Fig. 1 shows. This station is part of the Colombian Seismic Network managed by Servicio Geológico Colombiano - SGC (Colombian Geological Service).

Source: The Authors.
Figure 1 Location of El Rosal seismological station and earthquake distribution around Bogotá. Coordinates Gauss Kruger - Bogotá Origin
The El Rosal station employs a Guralp CMG - T3E007 sensor in three components and a Nanometrics RD3-HRD24 digitizer, which provides simultaneous sampling of three channels with 24-bit resolution [21]. The data corresponds to three component raw waveforms recorded directly at this station and a seismic catalogue with 2164 selected events, from between January 1st 1998 and October 27th 2008; all of them located less than 120 kilometers from the station. The Colombian seismic network consists of 42 stations, with an average distance of 162 kilometers between them, which record and transmit seismic data in real time for the entire country.
2.1. Data pre-processing
Before starting to process the SVMs, waveform files from El Rosal station were converted to the American standard code for information interchange (ASCII) format, using a Seisan package tool; earthquakes with magnitudes lower than 2.0 ML were discarded and so the following processes were applied to the remaining 863 events. Since selected seismic records present varying levels of noise, it was necessary to filter it out with both high and low frequency filters. Low frequencies correspond to instrumental noise that can be easily eliminated using high-pass filters with a cut-off frequency of 0.075 Hz [22], while high frequencies were removed with low-pass filters with a cut-off frequency of 150 Hz.
The statistical distribution of geographic latitude and longitude is presented in Fig. 2, where the main distribution of the whole data set is observed. These histograms show bimodal patterns in both cases, suggesting different active seismogenic zones north-south and east-west of El Rosal station that produce the regular seismic behavior of the area.

2.2. Descriptor - Input data set of SVMs
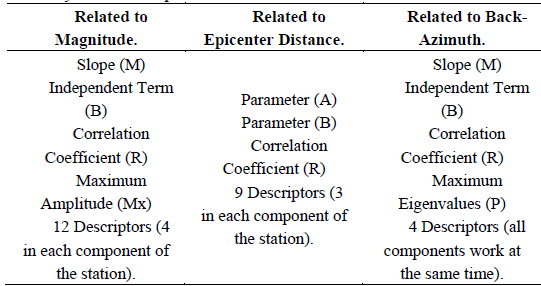
In the first stage, parameters that have been previously used by other authors for earthquake magnitude estimation were calculated and employed as input variables or descriptors for the SVMs in this study. In this sense, the relationship between maximum P wave amplitudes and local earthquake magnitudes was considered [23], where a linear regression was performed for each of the station’s three components. Three parameters were taken from these linear regressions which correspond to slope M, independent term B and correlation coefficient R. The maximum amplitude values Mx obtained for each time window were also used as descriptors; therefore, each event had 12 descriptors related to this concept.
Second, 9 descriptors employed for epicenter distance estimation were added and adjust a linear regression of an exponential function in time t by applying the expression “Bt exp (-At)”; this expression belongs to the envelope of the seismic record in logarithmic scale [2] which is also determined by a linear regression and its respective correlation coefficient R, for each component in the seismic station. The correlation coefficient R along with the parameters A and B were also calculated; where B represents the slope of the initial part of the P waves and A is a parameter related to amplitude variations in time.
Finally, parameters for the determination of back-azimuth were used to include information about the source location of seismic events in the model. Maximum eigenvalues of a two-dimensional covariance matrix were employed as input, calculated as described in [12] and [24]. A windowing scheme with one second time windows was performed to obtain consecutive values for which a linear regression was calculated, also determining the slope M, independent term B, regression correlation factor R, and arithmetic mean of eigenvalues PP.
This last process works with all components of the station at the same time, thus four descriptors were added to this process as input.
In sum, the SVMs of this study employ 25 time signal descriptors as input (Table 1); 12 of them related to works on magnitude calculation, 9 were associated with epicenter distance estimations and the last 4 were used for back-azimuth determination. These descriptors were calculated for 5, 10 and 15 second signals of the 863 selected events.
2.3. The SVM models
The SVMs are a group of supervised learning algorithms related to classification and regression problems. When a sample is used in training, it can be separated into classes and so train a SVM to predict the classes of a new sample; an SVM represents the points of a sample in a space, separating classes within these points into the widest possible spaces. When new samples are projected onto this model, they can be classified into any class in function of proximity of the points. The SVM models applied in this study are based on the complexity factor C and the selected kernel function. The complexity factor regulates the accuracy of the model; this factor can support the proper training of the model (generalization), or else, it can reach a point of overfitting. A proper generalization allows the model to accurately classify several samples that are different from those employed during the training stage; moreover, overfitting occurs when the model can only classify correctly the sample used in training.
The Kernel function projects a data set on a space of specific characteristics and uses algorithms related to linear algebra, geometry and statistics to identify linear patterns in the dataset. Any solution using kernel methods comprises two phases; the first phase consists of a module that maps the projected data; the second phase consists of an algorithm designed to detect linear patterns in the space where this data is projected [25]. The kernel function applied in this study was a polynomial type, using Equation 1.

Where E is a parameter representing the kernel exponent and K represents the kernel function depending on variables x and y. The kernel exponent E and the complexity factor C must be provided by the users in each model.
In this study, the models were trained with the refined data set for each time window using the Waikato Environment for Knowledge Analysis WEKA 3.6 and the 25 descriptors explained above (Descriptor - Input data set of SVMs). These algorithms have strong statistical support and can easily be implemented at the station by electronic processing cards. In order to choose the E and C parameters, correlation factors and minimum absolute error obtained by a 10-fold cross-validation process were compared for geographic latitude and longitude. These processes were carried out by testing multiple combinations of E and C for selected earthquake magnitudes and time signals. The correlation coefficient calculated for each partition corresponds to the Pearson’s Coefficient, which measures the linear relationship between two variables independently of their scales. This coefficient uses values between -1 and 1; a value of zero means that a linear relationship between two variables could not be found. A relationship with a positive value means that two variables change in a similar way, i.e., high values of one variable correspond to high values of the other and vice versa. The closer this value is to one, the greater certainty that two variables have a linear relationship.
3. Results
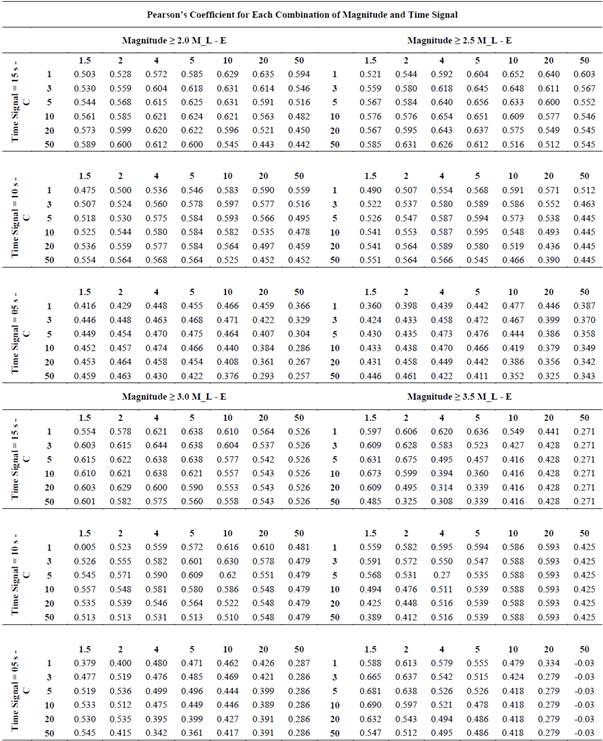
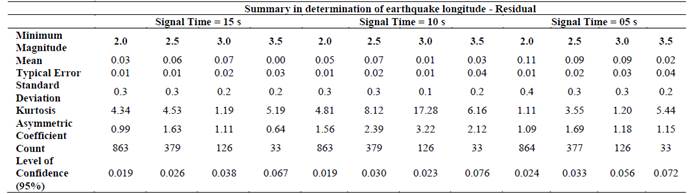
Using the 25 descriptors and earthquake magnitudes for each seismic event, a group of 24 datasets was evaluated (Tables 2A and 2 B). Each dataset corresponds to combinations of 4 minimum magnitude filters (2.0, 2.5, 3.0 and 3.5 ML) and 3 signal length filters (5, 10 and 15 seconds), evaluating combinations of 7 values for the kernel exponent (E = 1.5, 2, 4, 5, 10, 20 and 50) and 6 values for the complexity factor (C = 1, 3, 5, 10, 20 and 50); testing 1008 models of SVMs, which correspond to 504 models for latitude and 504 models for longitude in order to find the combination of parameters with the best correlation factor. Tables 3A and 3 B show a statistical summary for the best models of latitude and longitude in each combination of time signals and magnitudes.
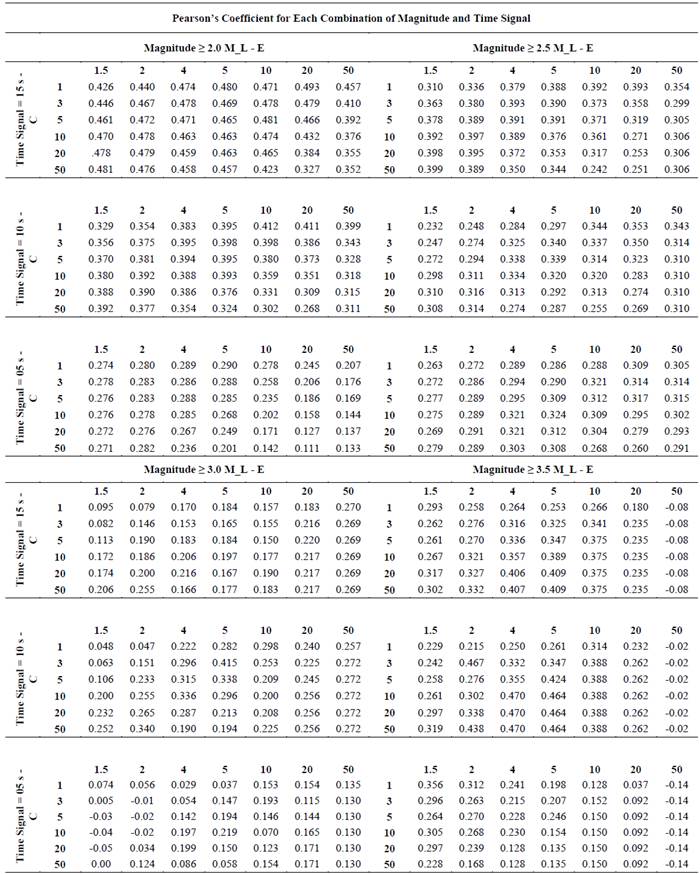
Table 2B. Cut-off Magnitude and Time Length combination (Geographic Longitude).
Source: The Authors.
Table 3B Summary for the best model of geographic longitude in each combination
Source: The Authors.
Table 3A. Summary for the best model of geographic latitude in each combination
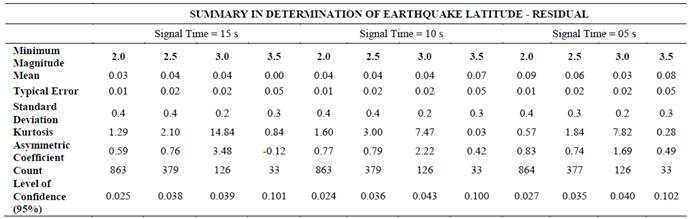
Source: The Authors.
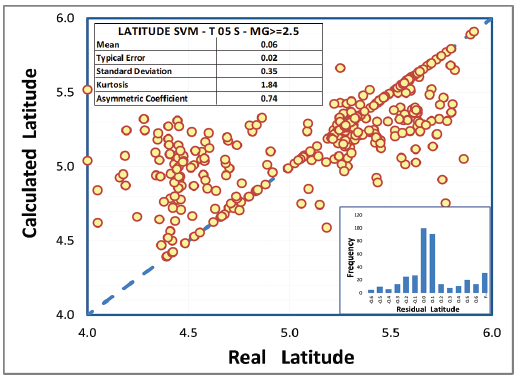
Tables 2A and 3A demonstrate that the best combinations of parameters for earthquake latitude determination are 10 for E and 2 for C using a cut-off magnitude of ≥ 2.5 ML and a time signal of 5 seconds; with these combinations, the best correlation factor is 0.32, reaching 0.36 degrees of standard deviation, which correspond to approximately 40 kilometers of error.
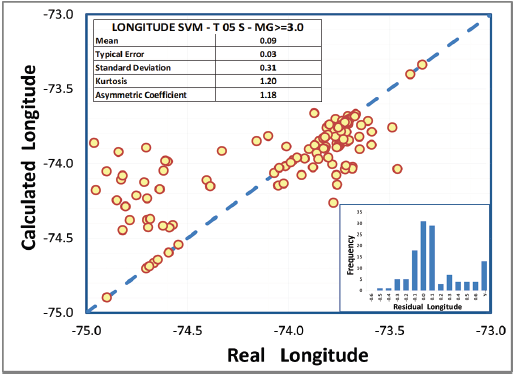
Fig. 3 shows the cross-plot with the relationship between real latitude (X axis) and latitude calculated by the model (Y axis), where a normal statistical pattern can be observed in the distribution of residual values (histogram). The dashed blue line represents the linear behavior of the predicted data, corresponding to the locus where the prediction is equal to real values; this plot also confirms a standard deviation of 0.35 degrees in latitude determination. Employing the same methodology for longitude estimation, the best combinations are 2 for E and 5 for C, using a cut-off magnitude of ≥ 3.0 ML and a time signal of 5 seconds (Tables 2 B and 3) B .
The standard deviation is 0.31 degrees, equivalent to approximately 30 kilometers, also confirmed in the cross-plot in Fig. 4.
4. Conclusions and recommendations
The SVMs used for this research provide part of the required information to develop an early warning system for seismicity that may affect the city of Bogotá. These algorithms showed an error of 40 and 30 kilometers in the determination of the latitude and longitude of earthquakes respectively.
The accuracies in this study were lower than those obtained by other authors [26-28], who achieved an accuracy of 7 kilometers on average. However, it is important to note that this study was carried out with information from a single seismological station and additional descriptors such as the predominant period. Fourier frequency spectra and wavelet transform coefficients should be considered in order to extract additional features allowing for better correlation and better estimation of the geographic coordinates where tremors occurred.
It is recommended that the models be complemented with earthquake data that was not considered in this research, particularly events since October 27th 2008 to the present, providing a greater data set and improving the accuracy of these SVMs.

