


 English (pdf)
 Article in xml format
 Article references
 Send this article by e-mail
 Cited by SciELO
  Cited by Google
  Similars in
SciELO
Similars in
SciELO  Similars in Google
 Permalink
1. Introduction
As global energy demand continues increasing and production of conventional oil declines, further development of heavy oil and bitumen recovery processes and technology is needed to provide for future demands [1-3]. The main technological challenge is to reduce the heavy oil viscosity in-situ [4]. As the oil viscosity is very sensitive to temperature, thermal recovery methods seem to be very useful and they have been researched and piloted [5,6], including cyclic steam stimulation (CSS), steam flooding, and combustion in-situ [7]. Another option is a shift in the heavy oil composition with gaseous and liquid solvents, such as carbon dioxide (CO2), methane (CH4), flue gases, naphtha, diesel, gasoil [8]. The solvents change the composition through mass transfer mechanisms (effective diffusion and convective dispersion processes) [9].
There are different ways to use solvents as enhance oil recovery method, including Vapor Extraction (VAPEX) and cyclic solvent injection (CSI) [10]. These are also employed to improve different steam process, for example, steam alternating solvent (SAS), Propane-SAGD, Expanding Solvent- SAGD (ES-SAGD), Solvent-Aided Process (SAP) and Liquid Addition to Steam to Enhance Recovery (LASER) [11].
CSI process has demonstrated substantial potential in enhancing heavy oil recovery. Consequently, it has been a research topic for years as an alternative technology to non-thermal recovery methods for heavy oil resources in thin or deep reservoirs, or heterogeneous oil sands [12-14]. Each cycle during a CSI process needs the development of three stages: injection, soaking and production [13]. In this kind of processes, the main recovery mechanisms are to reduce the viscosity and interfacial tension by creating a mixture zone between heavy oil and solvent during injection and soaking time, through mass transfer processes.
In the injection stage, the solvent is injected into the porous medium until reaching a defined pressure. In this stage; the heavy oil composition is changed by the effective diffusion and convective dispersion mechanisms. In the soaking stage, the reservoir is closed to allow the additional mass transfer by effective diffusion. The production stage of each cycle involves bringing the system from its soaking pressure down to some baseline value (e.g. 29 psi). In this last stage, the mixture (heavy oil and solvent) previously created is recovered [13].
CSI process has been studied mainly using gaseous solvents, however its evaluation with liquid solvents in the laboratory has been limited due to the increase of the system pressure by the injection of a liquid of low compressibility in a cyclic way, consequently there is not sufficient information of the evaluation and optimization of the design parameters of this technique.
This paper shows the way to develop a cyclic solvent liquid injection in the laboratory through Computed Tomography (CT). CSI experiment consisted of primary production and four liquid solvents (naphtha) injection cycles in a porous medium with Colombian heavy oil.
Oil recovery after primary production and four solvent cycles was 36.45 %. The results were acquired after the CT scanners allowed to analyze the behavior of density profiles during each stage and the change of oil saturation distributions along to porous medium by solvent effect after the production stage. The averages of these distributions were compared with the values obtained through mass balance, and the percentage of error was less than 2%.
2. Experimental section
2.1. Experimental setup
The CT scanner was a third generation GE CT 9800, operated at 120 Kev and current of 80 mA. Fine resolution (0.375 mm x 0.375 mm) CT cross-sectional images are acquired at a spacing of 0.5 cm along the core (thus giving rise to a total of images 30 images), and processed using Image J software [15]. The output density maps are used to image and quantify solvent and oil content in the core as a function of length after each CSI cycle.
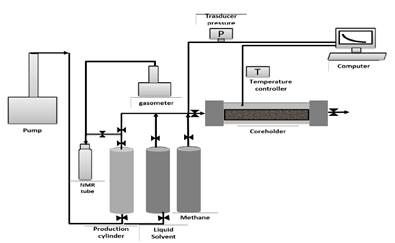
The experimental set up is shown in Fig. 1, which comprised an alumina coreholder, an oil injection system, a gas injection system, an effluent gas meter, liquid solvent injection unit, cyclic production system, pressure transducers, controller temperature system, oil collection system, a back pressure regulator (BPR), digital balance and the CT scanner.
Source: The Authors.
Figure 1. The experimental set up to saturate the porous medium with brine, heavy oil and gas and to develop CSI process with naphtha as liquid solvent.
The oil injection system included a cylinder, which contained the heavy oil. The heavy oil cylinder, flows lines and the coreholder with the porous medium were continuously heated using heating tapes during the saturation process. A 260D high-pressure syringe pump was used to inject the warmed crude oil into the coreholder for desaturing the brine. The injection flow rate was between 0.16 cm3/min and 8.3*10-3 cm3/min.
The injection system during the CSI involved a naphtha solvent cylinder to be injected, connection lines, a set of valves, and a transducer to monitor the pressure during each stage.
The cyclic production system has an empty cylinder connected to a pump in order to do a controlled depletion and to stock the recovered fluids, gas meter and NMR tubes where the fluids were transferred from storage cylinder.
2.2. Procedures
First of all, the dry core was scanned, then, vacuum was applied to de-aerate the rock. Brine (1% NaCl) was then injected until filling the total pore volume, in this stage; the core holder was scanned again to determine porosity profile. After that, the system temperature was increased until 84°C (reservoir temperature) and warm crude oil was injected into the sample to displace the brine. In this point, another scan was taken to analyze the heavy oil saturation profile. The heavy oil and brine were collected at the outlet and they were taken to the Nuclear Magnetic Resonance (NMR) equipment to determine the amount of water and heavy oil to carry out the mass balance and to define the initial oil and connate water.
Afterwards, methane was injected into the porous media, while all of the valves connected to the core holder were closed, except for the injection valve. This stage was developed to simulate primary production, to obtain a compressible system and to have some void space for the liquid solvent to contact oil. After termination of the gas injection, the injection valve was closed and the core was left to soak. Once the system reached a steady-stable pressure, the valve was opened to start the production and to mimic a single-well, through a controlled depletion process (using the pump). The system pressure was recorded continuously during the different stages (injection, soaking, and production). In this part, the heavy oil and methane were recovered and the core was scanned to define the new heavy oil saturation profile at the end of the depletion cycle.
The above process was repeated for each cycle using naphtha as a liquid solvent. The system was left to soak for 24 hours and the coreholder was scanned during the different stages to analyze the solvent-heavy oil interaction.
The amount of heavy oil produced in each cycle was determined through a calibration curve in eq. (1) and fig. It was built with NMR using naphtha and heavy oil blends [16].
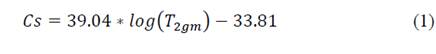
Where Cs is liquid solvent concentration and T 2gm is the mean relaxation time of the solvent-oil mixture. To develop this calibration curve, eight data points of mixtures of heavy oil and naphtha were taken and a regression with the least squares method by Microsoft Excel 2013 tool was employed. That process was repeated two times. The results indicates a Standard Deviation of the Mean equal to 0.97.
On the other hand, the statistics of the regression showed a confidence interval value of 95%, a determination coefficient of 0.997 and a typical error value of 2.04%.
The statistical analysis showed an uncertainty value for the slope and intercept in the NMR calibration curve of 2.31 and 5.89, i.e. (3.90±0.23) 101u and (3.38±0.59) 101u,, respectively. Those values were attributed to the mass measurement, dilution and calibration of the NMR equipment.
profiles by CT analysis
Many methods have been used for determining fluid saturation, during core fluid displacements, e.g., transparent models, resistivity, microwave absorption, NMR, X-ray and gamma ray attenuation and neutron radiography, however, most of these methods only provided areal average values for saturation [17,18].
Computerized Tomography (CT) has many advantages compared to the above methods, because this is a very fast and accurate method, that it allows generating dynamic three-dimensional images of three phases saturation during displacement process at reservoir pressure and temperature, with few experimental restrictions and fine spatial resolution [19]. Several researchers used CT scanning to study variety of EOR techniques including different miscible processes [20-22]. With the aid of CT scan, researchers monitor interaction between fluids, quantify saturation distribution and changes inside the cores during fluid flow [23].
CT is a non-destructive imaging technique that uses X-ray technology and mathematical reconstruction algorithms to view cross-sectional slices of an object. In the petroleum industry, CT scan technology is mainly used in two areas: fluid flow characterization and core description [24].
The basic quantity measured in CT is the linear attenuation coefficient (µ), which is defined by Beer’s law in eq. 2 [25]:
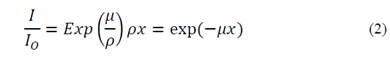
Where I
o
is the incident x-ray intensity, I is the intensity remaining after passing through a thickness x of material,
 is the mass attenuation coefficient, ρ is the electron density. The linear attenuation coefficient (µ) Depends on both electron density and atomic number (Z) as shown in eq. 3, where α and ( are related to acquisition parameters [26].
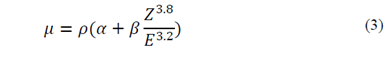
However, if the energy (E) is above 100 kV, µ will depend mostly on the electron density related to the bulk density. In practice, µ is converted into a new scale based in an international standard unit of Housefield called the CT number and it is defined in eq.4. On this scale, water has a value of zero and air has a value -1000 [27].
After analyzing eq.3 and eq.4, it is possible to predict that the relation between number CT and bulk density is lineal, if the energy is above 100 Kv, as shown in eq. 5
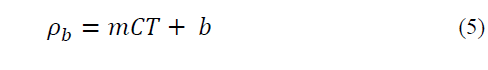
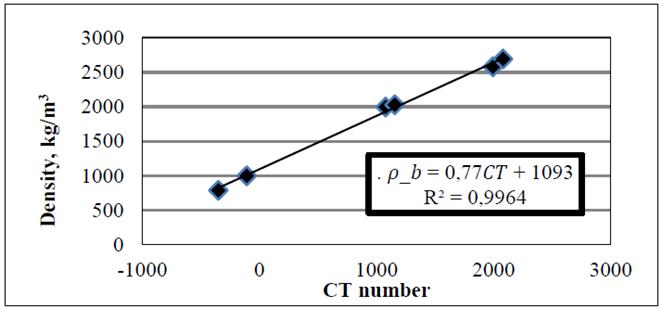
To obtain the value of the constant b and m of eq.5, it is necessary to scan different materials with known bulk density and similar dimensions (diameter) as the core, an in the same environment (energy and current). The following materials were taken as standards for this experiment: water, acetone, alumina and three kinds of sandstones with different densities. After scanning, the material standard number CT and densities are plotted to obtain the lineal correlation [28], as shown in the Fig. 2.
Source: The Authors.
Figure 2. Calibration of CT scanner using real density to convert the CT numbers to bulk density values. 𝜌_𝑏 = 0.77𝐶𝑇 + 1093.
This lineal correlation was obtained through a regression with the least squares method by Microsoft Excel 2013 tool. The statistics of the regression showed a confidence interval value of 95% and a coefficient of determination of 0.9964. The statistical analysis showed an uncertainty value for the slope and intercept in the CT calibration curve of 0.06 and 87.02, i.e. (0.77±0.06)u and (10.93±0.87) 102u, respectively.
That correlation allows to convert the CT numbers of each voxel to bulk density value. With these values of bulk density is possible to estimate the porosity and fluid saturation distribution in the porous medium with water, oil and gas, solving the following equations (6-9).


In this experiment, CT dry scan , CT brine scan , CT oil scan were measured by scanning the fully air-saturated and brine water saturated core and in every stage during the saturation process with heavy oil and gas (methane), and these changed to density values with the above showed lineal correlation. Furthermore, during CSI experiment, the porous media was scanned and the CT numbers were collected to analyze the solvent liquid-heavy oil interaction.
When all scans were collected and the experiment was completed, analysis of results provided porosity and saturation profiles. Based on “dry scan” and “brine scan” CT numbers, bulk density of grain, water and air ρ b_a, ρbr and ρb_w and solving the equations (6) and (7), it was possible to determine air porosity and water porosity respectively. For oil saturation calculation, the connate water saturation (S w ) was considered constant after oil flooding process as no further water was produced from the core. Thus, solving equations (8) and (9), the oil saturation (S o ) was calculated after, oil flooding, gasflooding, and CSI experiment.
3.1. Conventional analysis
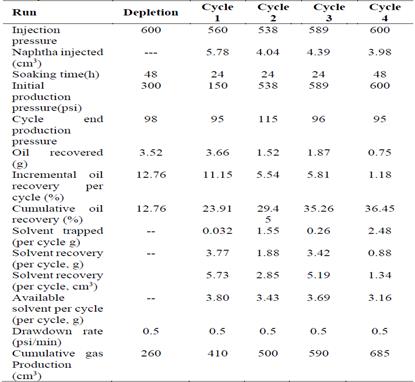
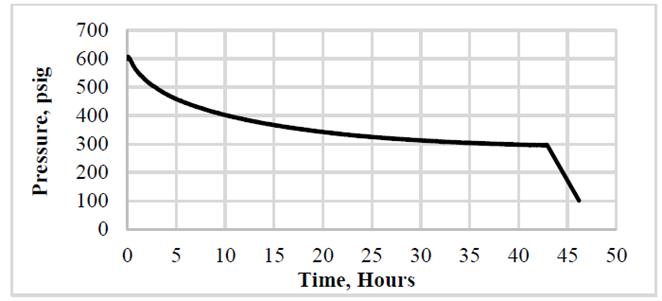
Table 1 summarizes the experimental conditions and results for the primary depletion test and the four cycles using liquid solvent. For the primary depletion and the other four cycles, the producer and injector were chosen to be placed at the same single point. To simulate the performance of the primary depletion, the porous media was pressurized to 600 psi using methane. To promote the methane diffusion and swelling into heavy oil, the system was closed until to reach the equilibrium in the system pressure. For this case, the equilibrium pressure was around 300 psi, thus, this value was assumed as bubble pressure for this experiment at 84°C, and it was reached after 48 hours of soaking time. The system was depleted until to reach 100 psi, applying a pressure decline rate of 0.5 psi/min. During this depletion was produced 3.52 g of heavy oil (12.75 % original-oil-in-place (OOIP)). The behavior of the system pressure is shown in Fig.3.
Table 1. Summary of experimental conditions and results of depletion process and each cycle of the CSI test.
Source: The Authors.
Source: The Authors.
Figure 3. System pressure during the soaking time and primary depletion with methane.
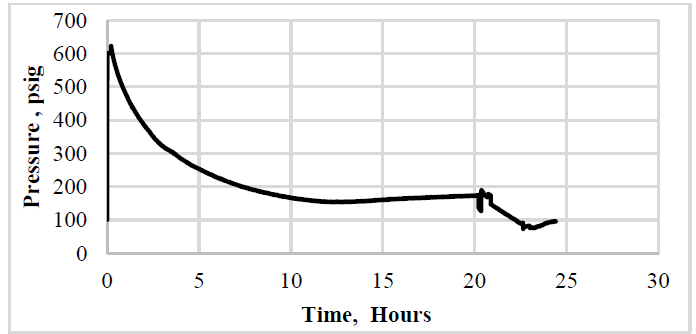
To improve the cyclic solvent injection process, the system had to be pressurized by injecting the naphtha at a pressure above the bubble pressure to achieve better solubilization of the methane into the oil. For this investigation, each cycle naphtha was injected until to reach a pressure in the porous medium of 600 psi. Later, the system was closed to allow the mass transfer. During the production stage was developed a controlled depletion until to reach a baseline value of pressure.
Fig. 4 shows the pressure behavior of the first cycle, where the pressure of system change in the soaking time. This stage lasted until the pressure stabilized, which was achieved after 22 hours and finally, the depletion was made at 0.5 psi/min.
Source: The Authors.
Figure 4. The behavior of the system pressure for the first cycle with naphtha, where the pressure of system change in the soaking time
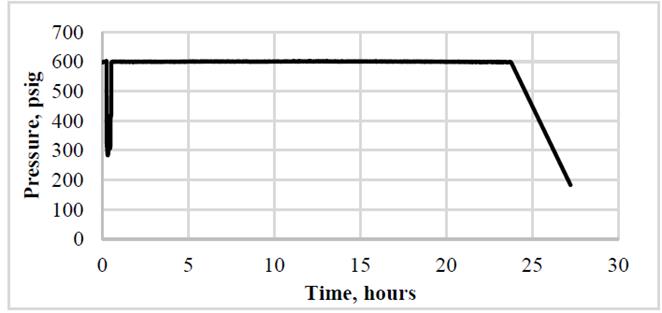
For the following naphtha cycles, it was decided to keep the pressure constant during the soaking stage and to close the system for 24 hours for the second and third cycle, and 48 hours for the fourth cycle in order to analyze the effect of soak time on late stages of the process. After the soaking step in these cycles, the system opened and depleted to 0.5 psi/min as can be seen in Fig. 5, where the behavior of the second cycle pressure is shown.
Source: The Authors.
Figure 5. The behavior of the system pressure for the second cycle with naphtha, where the pressure is constant during soaking time.
The determination of naphtha and heavy oil produced was made by the correlation obtained with NMR (equation 1). The results acquired from this correlation indicates that almost 36.45 % of the OOIP was produced after primary depletion test and four CSI cycle with naphtha. The heavy oil recovery through four CSI cycles was 23.69 % of OOIP.
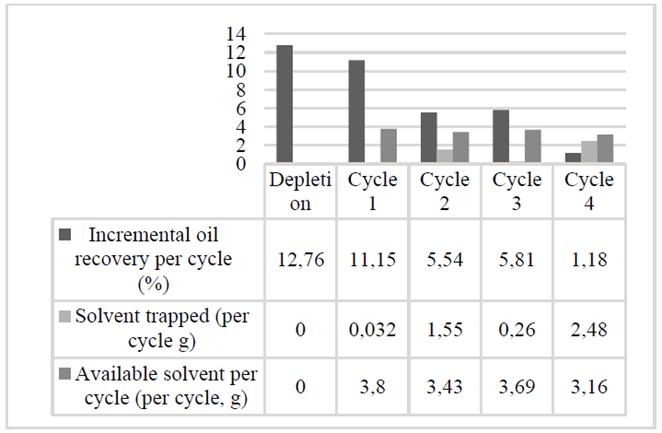
During CSI process, the recovery factor increases from one cycle to another and then decreases. This fluctuation of CSI cycle is due to the competing effect of reduction in available cycle initial oil saturation and the increase in the amount of liquid solvent trapped in porous media, as it will be explained in the following.
In the first cycle, the maximum oil production was obtained with 11.15 % of OOIP recovered, because high oil saturation was found near the injection / production zone.
A noticeable decrease in production was obtained in the second cycle with 5.54 % of OOIP recovered by oil saturation reduction. Additionally, in this cycle, a considerable amount of solvent got trapped in porous medium after the production stage (Fig 6).
Source: The Authors.
Figure 6. Factor of oil recovery per cycle, amount of solvent trapped and the mass of naphtha available after each cycle.
In the third cycle, a higher oil production was obtained with respect to the second, with 5.81 % of OOIP recovered, as for this cycle there was more solvent available, which was trapped from first and second cycle in the porous medium, and this continued contributing to the reduction of viscosity and improved mobility of extra heavy crude. Finally, the last cycle had the lowest oil recovery (Fig 6).
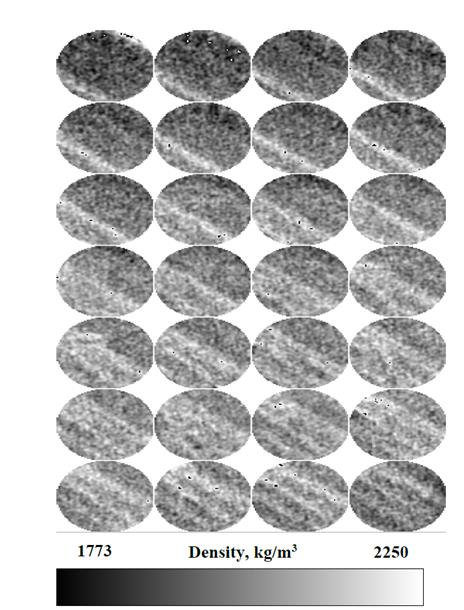
3.2. CT images qualitative analysis
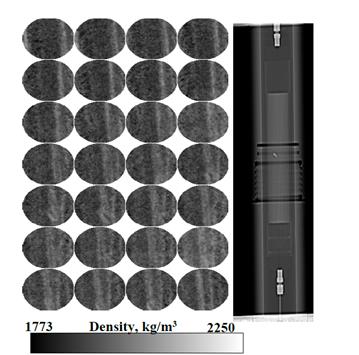
In this section a qualitative analysis will be carried out from the density maps obtained with CT of each stage, it shown in Figs.7-11. In all these figures, during saturation process, the top left slice corresponds to the injection site and the production side is in the bottom right. The images along the length of the core are read like a book (i.e. along each row and then down to the next row). In injection methane and CSI process, the top left image corresponds to both the injector and producer sides.
The left row of Fig 7 shows the axial slices of the dry porous medium with a range of bulk density between 1800 and 1930 kg/m3. A transversal scan of the porous sample is presented on the right, where it is possible to identify the core assembled into core holder and the production and injection lines. In this figure, the axial slices of the porous medium allow to visualize the density distribution at initial conditions, when this was saturated 100% of air.
Source: The Authors.
Figure 7. Dry sample, CT scan result of porous medium saturated 100% with air. On the left the axial slices of the dry sample. On the right a transversal scan of the porous sample.
After the water flooding, the bulk density increased because the air that occupied the porous medium was replaced by the injected brine as shown in Fig.8.
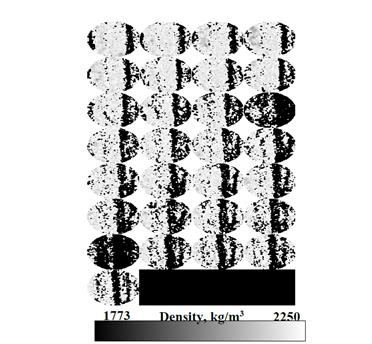
Fig. 9 presents the density map of the core after oil flooding process. The density map shows that the heavy oil did not homogeneously saturate the porous medium, since the first slices have lower bulk density than the rest of the porous media slices. This indicates that the major amount of oil was near the injection site.
Source: The Authors.
Figure 9 After oil flooding sample, CT scan result after injection of 10 VP of heavy oil.
According to the map, the bulk density began to increase as it approached the production side, because near to this side there was more water that could not be displaced by the oil, due to a preferential flow pathway was created and it avoided that the brine in some porous was contacted by the injected oil.
The density distribution images after the methane injection and respective depletion process are shown in Fig 10. It can be analyzed in this figure that after the injection of methane was reached a better distribution of the oil in the porous medium because the CT images results did not show a large variation in density distribution.
Source: The Authors.
Figure 10. After gas flooding sample, CT scan result after injection of methane.
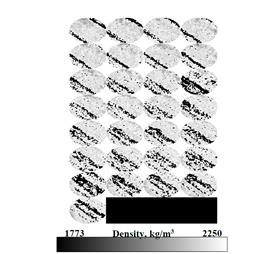
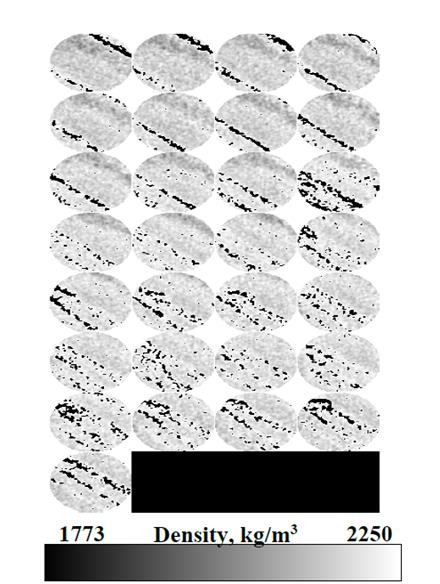
Initially, it was expected to recognize the naphtha and Colombian heavy oil in the CT images, after injection stages, because of the density difference between the fluids. However, it was difficult since during the liquid solvent injection, the fluids mixed due to the effect of mechanical dispersion caused by the movement of naphtha in the porous medium and the effective diffusion caused by the movement of the molecules from the point of major concentration to the point of low concentration. For this reason, the density difference was very small and it was hard to identify each fluid qualitatively (Fig 11).
3.3.1. Porosity profile
Conventional methods based on balance mass calculation only provide the average porosity value for a core, however, through CT scanning, heterogeneity and distributions in porosity can be detected by means of a porous media.
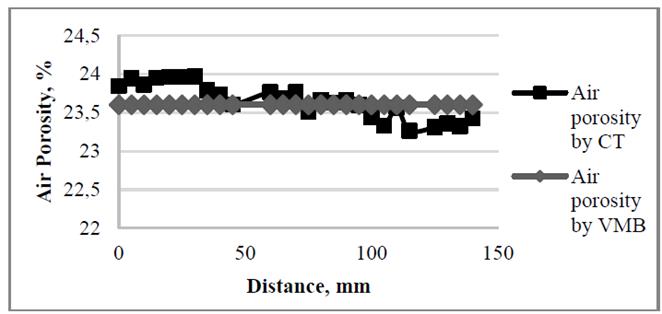
Estimation of the distribution of air porosities along the core was made from the density profile of dry porous medium and equation 6 (Fig.12). The average of these porosities was compared with the value obtained by volumetric mass balance (VMB). The results show that the porosity values at a different location were dissimilar. However, the average value of porosity from the CT slices matched very well with the results obtained with the VMB method, with an error about 4.34 % (Fig. 12 and Table 2).

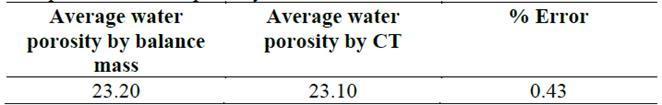
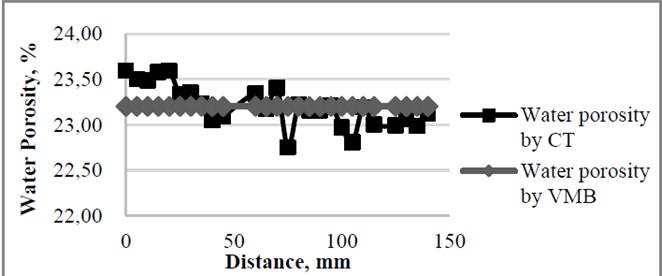
The values of the bulk density after brine injection allowed to calculate the water porosity along the porous medium throughout equation 7 (Fig. 8). The average of these porosities was compared with the value obtained through VMB method and the error was about 0.43 % (Table 3).
3.3.2. Density Profiles
In contrast to the density maps, the profiles allow to analyze quantitatively the behavior of system after each stage of CSI naphtha, as explained below.
During the CSI process, the liquid solvent (naphtha) fills one volume that was initially occupied by oil. Due to the solvent density is lower than heavy oil density; the average bulk density close to injector side in the saturated system will decrease after the injection stage (Fig 14). As is shown in Fig.14 during this stage a mixture zone is created with an increasing density profile because the concentration of naphtha decreases progressively due to the effects of effective diffusion and mechanical dispersion.
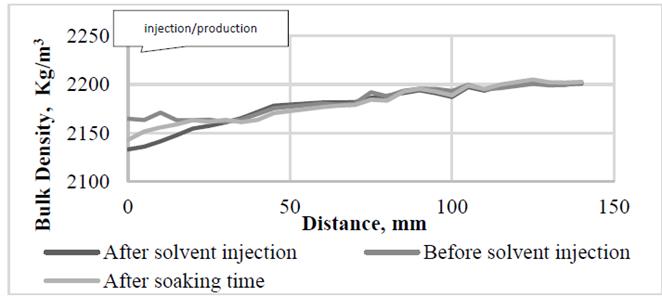
Afterward, during soaking time, the mixture zone was expanded. It caused that the bulk density in the first slices (until 20 mm) increased because the heavy oil molecules moved and enriched the mixing zone. Moreover, it is shown that from 25 mm to approximately 60 mm, the bulk density was reduced, it related to the movement of naphtha molecules to the crude caused by the mechanism of effective diffusion.
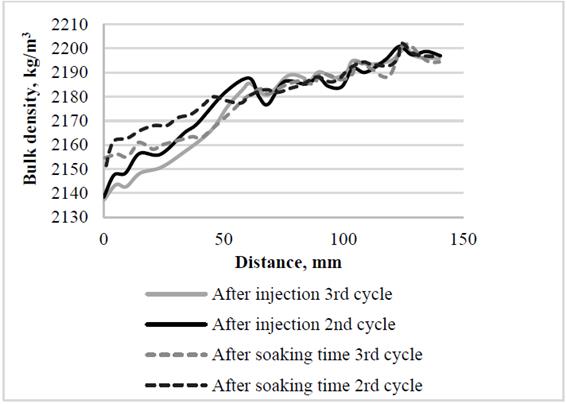
The behavior tendency of all cycles was the same; after the injection stage, the density decreased in the first 20 mm and after soaking time the bulk density increased by the mass transfer. The main difference among cycles was the values of bulk density, as seen in the figure below (Fig. 15) which shows the second and the third cycle after injection and soaking time. The 3rd cycle had less bulk density due to the trapped solvent from previous cycles (1st and 2nd), as shown above.
Source: The Authors.
Figure 15. Third and second cycle density profile after injection and soaking stage.
Source: The Authors.
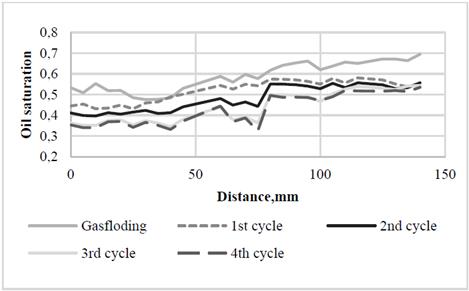
Figure 16. Distribution of oil saturation after gas flooding and the CSI process.
3.3.3. Saturation profiles
Fig. 13 shows the oil saturation profile after oil flooding, gasfloding, and each naphtha cycle process. Here the oil saturation refers to the amount of heavy oil remaining in each slice in the different stages. It is possible to analyze in this figure the solvent effect on the reduction of oil saturation in the different sections of porous medium.
Additionally, it is possible to observe in Fig. 13 that the oil saturation was reduced along the porous medium. This occurred because during the injection stage, the solvent pushed the heavy oil to the end of the porous medium and during the production stage (puff stage) the fluids in the porous medium tried to fill the empty spaces in the first distances due to the pressure gradient. Therefore, there was a redistribution and reduction of oil saturation throughout of all the porous medium (Fig 15). This redistribution of heavy oil caused that there was a certain amount of heavy oil in the first distance that avoided further penetration of the solvent.
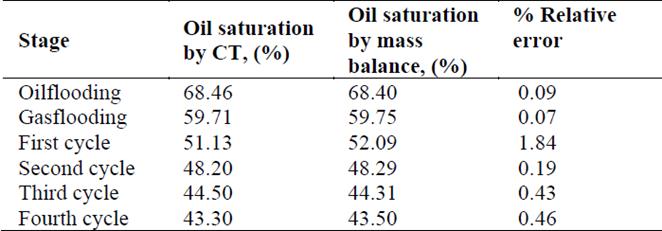
The average of oil saturation determined with CT was compared with the one obtained by the mass balance in Table 4. The average value of CT slices matched the balance mass very well with an absolute error percentage of less than 2%.
In this table, it is also possible to analyze that the major reduction of saturation of the heavy oil occurred in the first cycle, in which it was reduced 8.75 % of the oil in the porous medium due to high oil saturation and in the third cycle was reduced 3.70 % of oil saturation, in view of the fact that in this cycle there was a considerable amount of solvent trapped from the second cycle (see Table 1).
A comparison of CSI cycle 1 and 2 indicates the significance of initial oil saturation in the vicinity of the injection side.
In cycle 3, although the oil saturation continues decreasing (see Table 4), the factor recovery increases. This increase is related to the increase in the amount of solvent available for each cycle, since a certain amount of naphtha was trapped in the porous medium, as it can be analyzed in Table 1, and it continues contributing to the reduction of viscosity and improved mobility of extra heavy crude.
4. Conclusions
About 36.45 % of the OOIP was produced after primary depletion test and four CSI cycles with naphtha. The combined heavy oil recovery through four CSI cycles was 23.69 % of OOIP. The peak of oil production for naphtha occurred at the first cycle due to the high oil saturation available near production side in this stage and at the third because liquid solvent was trapped in the porous media from other cycles and it continues to contribute with the reduction of viscosity and improved mobility of extra heavy crude.
In this research, the computed tomography allowed to observe quantitatively the decrease of the bulk density of the system and the change in the profile of solvent concentration developed after the injection and soaking stage, due to the mass transfer processes. However, the qualitative analysis of the interactions between naphtha and heavy oil was complicated through bulk density maps, since it was difficult to discriminate the fluids after the injection and soaking stages due to the density in the created mixing zone, similar to that of heavy crude oil.
Computerized tomography was used to perform an analysis of the behavior of the oil saturation profile along the porous medium after each stage. This allowed to conclude that the decrease in oil saturation after a solvent cycle occurred in all of the porous medium and not only in the vicinity of the injector side as expected. This due to the fact that during the solvent injection stage, a certain amount of crude oil was displaced to the final part of the porous medium. Then, when starting the production stage, , the displaced crude oil moved towards the area previously swept by the solvent due to the pressure differential, causing a redistribution and reduction of the oil throughout the entire core.

