


 English (pdf)
 Article in xml format
 Article references
 Send this article by e-mail
 Cited by SciELO
  Cited by Google
  Similars in
SciELO
Similars in
SciELO  Similars in Google
 Permalink
1. Introduction
In regions where irrigation is intensive, fertirrigation is a widely used practice as an alternative to conventional fertilization, aiming at increasing crop productivity. The technique aims at simultaneously meeting the water demand by the crop and supplying nutrients via irrigation water, leaving the nutrients in soluble form and therefore, more quickly available. However, excessive application of fertilizers via fertirrigation may increase the risk of soil salinization [1].
The increase in soil salinity is usually related to the excessive use of fertilizers applied via irrigation water or the use of irrigation water from saline sources. In semiarid regions, in order to minimize these problems, farmers often use the practice of leaching salts to deeper soil layers. However, in many cases the leaching water depths used are not sufficient to prevent the increase of the salt content in the crop root zone. In these situations, it is necessary to reduce the soil salinity to a level tolerated by the crop, by means of a reclamation leaching [2]. According to Hoffman [3], when the water is not strongly saline, so that during the crop cycle the soil salinity does not exceed its threshold, it is not necessary to carry out constant leaching. In this case, only maintenance flushing needs to be performed, at the end of the crop cycle.
According to the FAO, annual crop losses caused by extreme events due to water loss, erosion and salinization are estimated at 0.3%. If this problem increases at the current pace, a total reduction of more than 10% is expected by 2050 [4].
The volume of water required for reclamation leaching of a soil profile is calculated as a function of the initial soil salinity, the desired final salinity level, the type and depth of the soil to be reclaimed, the method of water application, and the salt concentration of the washing water [5].
Although many studies have been published with mathematical models to simulate the reclamation of saline soils, the amount of water used in the washing necessary for the reclamation of these soils is generally calculated using empirical relationships [6].
Due to the doubts still existing regarding the control of soil salinity and management, and the diverse models and formulas used to calculate leaching water depth, there is great variation in the amount of water recommended. In this context, this work examines the reclamation of soils salinized by excess fertilizers and the different leaching systems and equations to determine the corresponding parameters.
2. Material and methods
2.1. Location and preparation of the experiment
The field experiment was carried out at the Department of Biosystems Engineering of the "Luiz de Queiroz" School of Agriculture of the University of São Paulo (ESALQ/USP), located in Piracicaba, SP (22° 42' S, 47° 37' W and 540 m a.m.s.l), using tubular lysimeters made of concrete, waterproofed inside and with a top surface protected with plastic. Their dimensions were 1.2 m in height and 0.5 m in diameter, totaling 0.20 m2 of cross-sectional surface area and 240 liters of useful volume.
According to the classification of Koppen, the climate of the region is type CWa, meaning tropical humid, with three dry months (from June to August) and occurrences of summer rains and winter droughts. The average temperature of the warmer month is higher than 22 °C, and in the coldest month it is below 18 ° C.
The study consisted of three steps: 1) salinization of soils contained in the lysimeters; 2) reclamation of salinized soils; and 3) measurement of salt concentrations in the soils after the desalination procedure. For this task, we considered intermittent and continuous reclamation systems and compared these concentrations with those calculated by the empirical formulas.
The first step was based on the use of artificial salinization curves for "Sertãozinho" Yellow Red Latosol, obtained in a previous experiment carried out in 8 liter pots. In the second step, we applied percolation water depths for the washing and reclamation of the salinized soils contained in the tubular lysimeters. In the last step, we applied empirical equations, obtained from technical and scientific publications, to estimate the concentrations of salts remaining in the soil solution after the application of the leaching depths in the intermittent and continuous systems. The concentrations predicted by the equations were compared to the actual concentrations measured in the soil in the lysimeters.
experiment)
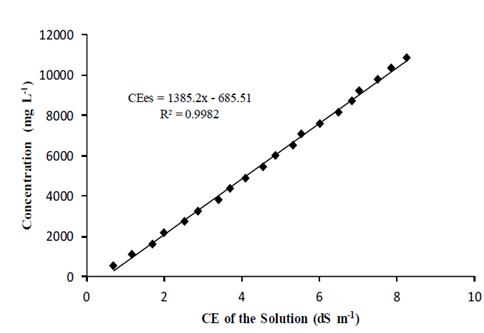
To find the relationship between the electrical conductivity of the solution (ECs) after the salinization and the total of salts to be applied, the desired proportions of salts were dissolved, initially taking as reference the equation proposed by Richards [7], eq. (1).

Where:
C - concentration of fertilizing salts, mg L-1; and
ECs - electrical conductivity of the solution, dS m-1.
Different concentrations were prepared based on eq. (1), corresponding to a salinity called "theoretical salinity". Thereafter, the actual electrical conductivity of the solutions was determined using a benchtop conductivity meter. A curve was adjusted correlating the concentration of the fertilizer solution with the electrical conductivity of these solutions, by means of a dispersion diagram. Subsequently, samples of 10 kg of the soil to be used in the main experiment were collected, which were air dried, sieved and placed in 8 L pots. The pots containing a 20 cm soil layer had perforated bases and a 2 cm layer of gravel was placed in the bottom and covered by a geotextile blanket (Bidim OP-30).
The soil was collected at the ESALQ campus, where it is called "Sertãozinho Series", at a depth of up to 0.50 m, considered the arable layer for this profile. The soil was classified as Yellow Red Latosol, sandy phase [8].
The soil moisture in the pots was increased from air dried to maximum retention capacity. This was done by applying the previously studied dilute solutions, with the objective of obtaining nine levels of electrical conductivity already corrected for the saturated soil extract paste (EC from 1.0 to 9.0 dS m-1, with variation of 1.0 dS m-1), with three replicates. For salinization, the values of the final concentration of fertilizers in the water (Cf) applied to the soil were those necessary to obtain the EC levels to be reached in the field stage of the experiment, already considering the dilution to the moisture of the saturated soil extract paste and the adsorption.
The proportion of nutrients from the solutions adopted for salinization was based on the Hoagland nutrient solution, described by Furlani [9] (Table 1).
Table 1. Nutrient concentration of the nutrient solution whose proportions were used for salinization.

Source: Hoagland, according to Furlani (1999).
The result of the pre-test to ascertain the concentration of fertilizer solution applied to obtain the desired EC in the saturated soil extract paste is shown in Fig. 1.
2.3. Implementation of treatments
The experiment was conducted in a randomized block design, arranged in a 2 x 5 factorial scheme, with 6 replicates. The treatments were obtained by combining two forms of soil reclamation (R1 = continuous, and R2 = intermittent) and five salinity levels of the saturated soil extract paste (S1 = 2.0, S2 = 4.0, S3 = 6.0, S4 = 8.0, and S5 = 10.0 dS m-1).
In the experimental area, 60 lysimeters were placed in 4 rows of 15 lysimeters, so that each of these containers represented an experimental plot. In each of the 6 blocks there were 10 experimental plots, corresponding to 2 systems and 5 salinity levels.
The drainage system of the tubular lysimeters was composed of holes located near the base of each lysimeter, where 19 mm diameter PVC pipes were inserted and sealed with epoxy and sealing material. The PVC pipes had length of 0.60 m and holes with 5 mm diameter around their circumference spaced 0.05 m apart. In order to facilitate drainage and prevent soil transportation, a synthetic blanket (BIDIM OP - 20) was used as a filter on a 0.10 m layer of washed gravel.
In order to obtain the five proposed levels of salinity, the electrical conductivity of the saturated soil extract paste was raised to the following levels: S1 = 2.0, S2 = 4.0, S3 = 6.0, S4 = 8.0, and S5 = 10.0 dS m-1) by the addition of nutritive saline solutions dissolved in water from the ESALQ supply system. The amount of salt used to prepare each solution was calculated based on the artificial salinization curve (Fig. 1) obtained in the previous experiment.
The composition of the solution used for salinization was the same as that indicated in the previous salinization curve, based on the proportions of Hoagland nutrient solution described by Furlani [9] (Table 1).
The saline solution was applied by a drip irrigation system at a flow rate of 8 L h-1. The system was composed of pressure compensating button drippers. Each dripper was connected to a two-split divider in order to obtain uniform distribution of the solution at the soil surface. At the end of the applications, the electrical conductivity levels of the soil solution were measured by analyzing the solutions extracted from the soil 48 hours after salinization. The lysimeters were then covered with polyethylene plastic to avoid evaporation, thus enabling the soil inside to reach moisture close to field capacity.
Soil samples were collected from the lysimeters for physical and hydric analysis. The physical properties of the soil were analyzed based on the method described by Embrapa [10]. The soil textural fractions were determined by measuring the proportions of coarse sand, fine sand, silt, and clay by the pipette method, and were expressed as percentage. The soil particle density (Dp) was determined by the volumetric flask method, and the soil density (Ds) was determined by the test tube method, for deformed samples, both expressed in g cm-3 (Table 2).
Table 2. Physical-hydric characterization of the soil used in the experiment.

FC - moisture at soil field capacity; PWP - moisture at the permanent wilting point, determined at tensions of 6.0 and 1500 kPa, respectively; AW - soil available water; DS - soil density; Dp - soil particle density; MP - soil macroporosity; TP - soil total porosity.
Source: The Authors.
Prior to salinization, soil samples were collected at depths of 0.00-0.20, 0.20-0.40 and 0.40-0.60 m for chemical characterization of soluble ions (Table 3). The solutions were prepared from a paste with saturation moisture and were extracted by means of suction, according to the method proposed by Richards [7].
Table 3. Chemical characterization of the soluble ions of the soil before the salinization process, carried out in saturated soil extract paste.

Source: The Authors.
Soil samples were also collected for chemical characterization before salinization. The concentrations of phosphorus (P) and potassium (K) were determined by the cation exchange resin method, expressed as mg dm-3. Exchangeable calcium (Ca2+), magnesium (Mg2+) and H + Al (to measure potential acidity) were extracted from the soil by a 1 mol L-1 ammonium acetate solution and quantified by atomic absorption spectrophotometry [10] (expressed in cmolc dm-3). From these contents we determined the cation exchange capacity (CEC at pH 7.00) and the sum of bases (SB), expressed in cmolc dm-3. Base saturation (V) was expressed as percentage (Table 4).

depths for leaching
The process of reclamation of the salinized soils consisted of the application of water at various depths for the leaching of fertilizer salts and reduction of the electrical conductivity. This was based on empirical considerations of the solute dynamics that recommends application of a water depth corresponding to twice the volume of pores, for fast calculation of the reclamation water depth for saline soils [11]. In a first step, an initial water depth was applied to raise the lysimeter soil to field capacity and only then were the reclamation washing depths applied. In both systems, continuous and intermittent, a volume of 176 L of water per lysimeter was applied, and in the intermittent system this volume was divided in two applications, with an interval of six days between applications. Soon after the applications, black polyethylene plastic sheets were placed over the lysimeters to prevent water evaporation. The water used came from the supply system of the ESALQ campus, which was the water source at the test site.
2.5. Measurement of soil salinity after washing
The changes in soil chemical characteristics in response to the application of the washing water at the various depths were evaluated by measuring the electrical conductivity and concentration of the remaining ions in the soil solution of each lysimeter. For this, the solution of the soil was obtained with the use of extractors and later the concentration was corrected to saturation moisture.
For this purpose, three ceramic capsule extractors were installed in the soil of each lysimeter, totaling 180 units. Each was composed of a PVC tube with a porous capsule at the lower end. The capsules were positioned at three depths in the soil profile (20, 40 and 60 cm).
To obtain the soil solution, tension of 80 kPa was applied in the chamber of each extractor, using a vacuum pump 48 hours after the end of the applying the water. The solutions were withdrawn from the extractors by a hospital syringe after 24 hours, time necessary for redistribution of the solution that was in equilibrium between the capsule and the soil. The samples were stored in acrylic tubes and then taken for analysis in a laboratory of the Department of Biosystems Engineering of ESALQ/USP.
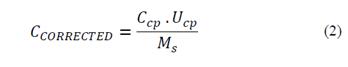
In the laboratory the electrical conductivity of each solution extracted by the porous capsules and the concentration of the main ions were determined, which were corrected for the saturation moisture using eq. (2):
where:
CCORRECTED - electrical conductivity or concentration of ions in the saturated soil extract paste, estimated from the values determined in the soil solution, in dS m-1 or mmoc L-1;
Ccp - electrical conductivity or ion concentration in the soil solution, obtained with the porous capsule extractor, in dS m-1 or mmolc L-1;
Mcp - soil moisture during application of tension in the extractor capsule, in g g-1; and MS - soil saturation moisture (saturated paste), in g g-1.
equations
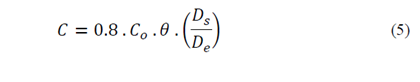
After the field experiment tests, five empirical equations found in the literature were used to estimate the EC of the soil solution after the application of the washing water as different depths: Volobuyev, according to Palácios [12]; Cordeiro [13]; Jury [14]; Hoffman [15]; and Reeve [16]. For the purposes of comparison, we used in the calculation the same leaching depths applied in the actual tests as well as the same initial chemical conditions measured in the soils contained in the lysimeters.
Thus, EC values were calculated using the equations of Volobuyev, Cordeiro, Jury, Hoffman and Reeve, equations 3 to 7, respectively. It is important to note that some equations present the results in electrical conductivity while others present them in ion concentration. In this case, the results in EC were converted into concentration using a correlation between them obtained in the initial phase of the experiment.

where:
ECf - final electrical conductivity in the saturated soil extract, in dS m-1;
ECi - initial electrical conductivity in the saturated soil extract, in dS m-1;
L - water depth to be applied to the soil for salt leaching, in mm; and
α- coefficient, which depends on the content of chloride and soil texture.
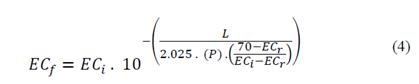
where:
p - depth of soil to be reclaimed, in cm; and
ECr - electrical conductivity of washing water, in dS cm-1.
where:
C - concentration of salts in the soil solution after reclamation, in mg L-1;
Co - concentration of salts in the soil solution before reclamation, in mg L-1;
θ - volumetric soil moisture, in cm3 cm-3;
DS - depth of soil to be reclaimed, in cm; and
De - water depth to be applied in the soil for washing the salts, in cm.

where:
K - constant, varying with the type of soil and the method of water application.
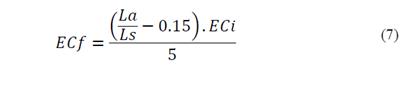
where:
La - water depth to be leached, in cm; and Ls - soil thickness to be reclaimed, in cm.
The performance of the equations was evaluated by comparing the final EC obtained with the use of these equations and the experimental results measured in the lysimeters installed in the experimental area.
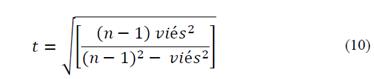
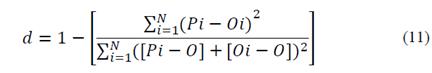
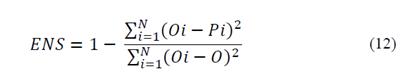
For this, we used the mean absolute error (MAE), root mean square error (RMSE); paired t-test at significance of 5%, Willmott concordance test [17], Nash-Sutcliffe efficiency index (ENS), Pearson linear correlation, and Camargo-Sentelhas performance index [18], which is the result of the product of the Pearson correlation coefficient (r) and the Willmott accuracy index (d). The values were obtained respectively by:


The data were also submitted to analysis of variance. When there was significance by the F-test, the means were compared by the Tukey test at probability of 5%. The data analyses were performed with R [19].
3. Results and discussion
3.1. Evaluation of the performance of empirical equations
According to the analysis of variance, there was a significant interaction (p <0.01) between the factors reclamation system (continuous or intermittent) and salinity levels only for the washing volume pores in the experiment. An isolated effect of salinity was found for both the experiment and all the equations studied (Table 5).
Table 5. Summary of analysis of variance (F-test) and statistical significance for the variables EC estimated and EC measured in reclamation systems.
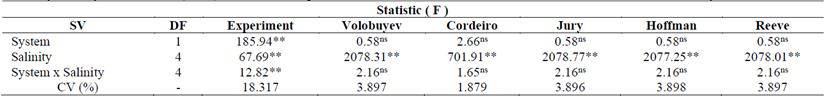
**significant at 5% probability; ns non-significant; SV - source of variation; DF - degrees of freedom.
Source: The Authors.
There was no significant effect of the reclamation systems on the different equations. These results show that the reclamation systems have no effect on the studied equations, since most of them do not reach the refinement of indicating which system will be used to reclaim the soil, that is, whether intermittent or continuous.
Comparison of the systems at each salinity level revealed that for all levels of salinity the systems did not differ statistically. In general, for all the systems studied a gradual concentration effect on salinity levels was observed (Table 6).
Table 6. Mean values of salinity in the experiment with the reclamation systems.

Values followed by the same letter in the column do not differ according to the Tukey test at 5% probability.
Source: The Authors.
This interaction of salinity influenced the results possibly due to the medium soil texture. The observed increase is consistent with that expected and proposed, for example, by Van der Sloot [20], who studied the influence of particle size in leaching tests.
The author verified that larger soil specific surface areas per unit mass or volume may allow rapid dissolution at the surface.
prediction in the intermittent system
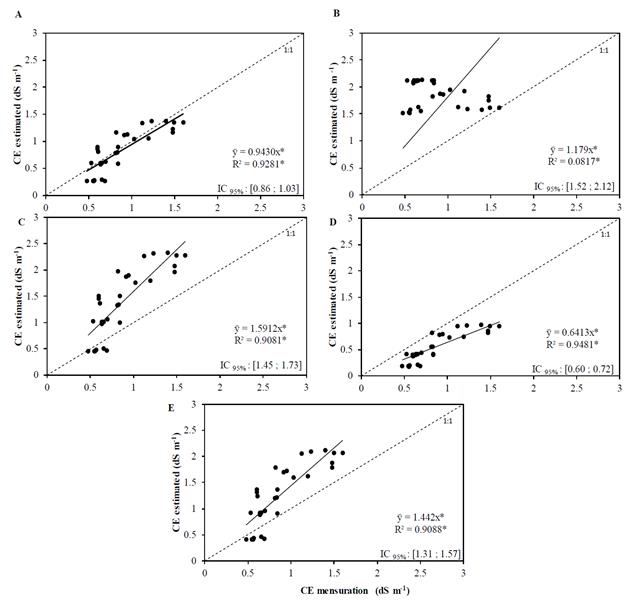
The electrical conductivity values measured in the soil solution collected by the porous capsule extractors, and that simulated by the equations studied along the 1:1 line, as well as the regressions with the five washing equations in the intermittent reclamation system, are presented in Fig. 3.
Source: The Authors.
Figure 3. Relationship between the electrical conductivity values of the saturated soil extract estimated by the equations and the empirical electrical conductivity values of the soil solution obtained with porous capsule extractors for continuous reclamation (A - Volubuyev; B - Cordeiro; C-Jury. D-Hoffman and E-Reeve).
High determination coefficient values (R2 a) for the relations between the electrical conductivity values measured in the saturation extract (estimated from the electrical conductivity of the solution) and the values calculated by the different equations were observed (Fig. 2). These values were 0.9281 for Volubuyev, 0.9081 for Jury, 0.9481 for Hoffman and 0.9088 for Reeve. The exception was the value of 0.0817 for Cordeiro.
Source: The Authors.
Figure 2. Relationship between the electrical conductivity values of the saturated soil extract estimated with the equations and values measured from the electrical conductivity of the soil solution obtained with porous capsule extractors for intermittent reclamation (A - Volubuyev; B - Cordeiro; C - Jury; D - Hoffman and E - Reeve)
However, obtaining high determination coefficients alone is not sufficient to evaluate the fit between the measured and simulated data. In this sense, for some equations used there was no proximity to the 1:1 line and, even so, the values of R2 a were very high. Legates and Davis [21] showed that the use of methods based on correlation indexes (such as the coefficient of determination) to quantify model performance can be inadequate.
When the Volobuyev reclamation equation was used, the estimated electric conductivity approached the measured values, and the trend line almost overlapped the 1:1 line (Fig. 2 a). These results show that the Volubuyev equation is able to estimate the washing with good precision and presents reliability for the estimation of EC in the intermittent reclamation system. On the other hand, the values estimated by the Cordeiro, Jury, Hoffman and Reeve equations (Figs. 2b, 2C, 2D and 2E) performed poorly. The values found by the Hoffman equation underestimated the measured values of the electrical conductivity of the saturation extract, while the other three equations overestimated the electrical conductivity values for the intermittent method.
In general, the equations tended to overestimate the measured values, mainly for the higher values. Among them, the equation of Cordeiro presented the greatest discrepancies. This performance is possibly due to the fact that this equation is very sensitive to the initial levels of soil salinity.
Table 7 presents the values of the Pearson linear correlation, Willmott concordance index, Camargo-Sentelhas performance index, mean absolute error, mean square error, and Nash-Sutcliffe efficiency coefficient, which were obtained in the comparisons between the EC values estimated and measured in the intermittent reclamation system.
Table 7 Pearson's correlation coefficient (r), Willmott's concordance index (d), Camargo-Sentelhas performance index (c), mean absolute error (MAE), root mean square error (RMSE), and efficiency coefficient of Nash-Sutcliffe (ENS) obtained in the comparisons between the EC values estimated and measured in the intermittent reclamation system
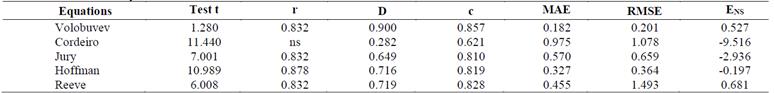
Source: The Authors.
When considering the linear correlation of Pearson, only the Cordeiro equation did not present acceptable significance, while the others were significant at 5%. This is due to the fact that the grouping of the estimated EC values in relation to the measured ones tends to improve the EC estimates. In relation to the Willmott coefficient, the equations presented high values, except for the Cordeiro equation, while the Volobuyev equation obtained a value of this index closest to the empirical value. The Volobuyev equation also showed a better result for the Camargo- Sentelhas performance index, as well as lower values of MAE and RMSE, making it the best equation for the intermittent reclamation system.
In relation to the ENS values, the equations that had the best performance (values closer to 1) were the equations of Volobuyev (0.527) and Reeve (0.681). The other equations obtained negative values of this indicator, showing lower precision of their estimates. ENS is an indicator widely used to evaluate models and equations. Its use in hydrology is due to the flexibility of application to several types of models and mathematical equations [22, 23]. In the literature, there is a greater indication of the ENS parameter for the evaluation of model adjustments than the coefficient of determination, which is considered insensitive to the additive and proportional differences between model simulations.
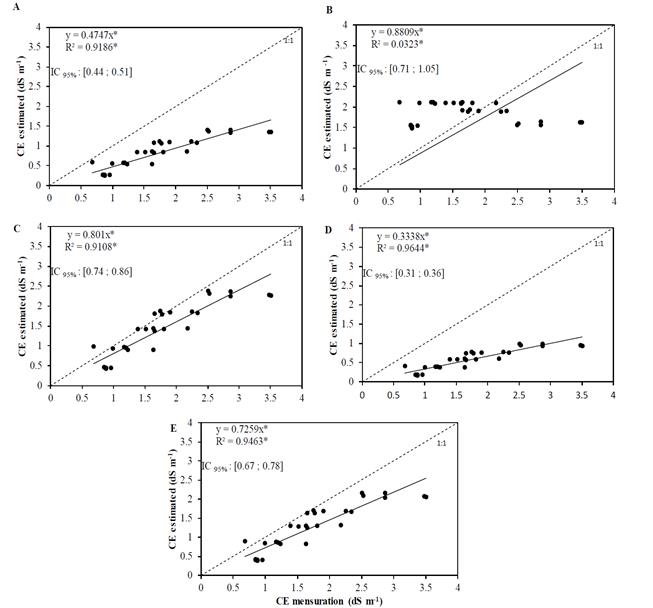
prediction in the continuous system
The values of the coefficients of determination of the relations between the electric conductivity of the saturated soil extract and the values estimated by the different equations in the continuous system are presented in Fig. 3. The solutions were obtained with porous capsule extractors and the EC values were corrected as a function of moisture. The R2 a estimated by the equations of Volobuyev, Cordeiro, Jury, Hoffman, and Reeve were respectively 0.9186, 0.0323, 0.9108, 0.9644, and 0.9463. In the continuous reclamation system, all the equations studied produced estimates that were lower than the measured values. The Cordeiro equation provided the best regression line in relation to the 1:1 line, but with very different values compared to the other equations. Since these dispersions are characterized by mathematical approximations that evaluate the accuracy, dispersion and distance of the simulated values in relation to the calculated ones, it can be affirmed that the prediction equations are not very efficient for the continuous system, that is, the values in the intermittent system are best described by empirical equations.
Analyzing specifically Fig. 3 b, which represents the estimation by the Cordeiro equation, shows there is great dispersion of the points along the regression line. This behavior is different from that observed with the other equations, for which the estimated points are closer to the 1:1 line, showing good correlation between the measured and calculated values.
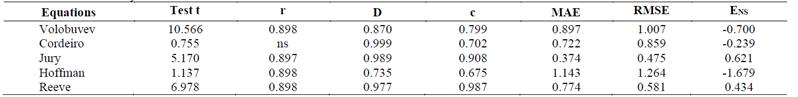
Considering the Pearson linear correlation, only the Cordeiro equation showed no significance at probability of 5% (Table 8). The equations of Cordeiro, Jury, and Reeve presented the best values for the Willmott coefficient. The Cordeiro equation provided the values closest to 1, which indicates perfect concordance. The MAE values were lower for the Jury equation (0.374), followed by Cordeiro (0.722), Reeve (0.774), and Volobuyev (0.897). The Hoffman equation presented the highest value (1.143). For the RMSE, the Jury equation provided the lowest value (0.475), followed by Reeve (0.581), while the Hoffman equation presented the highest value (1.264). Considering the ENS, the Reeve equation had the best performance (0.434), followed by Jury (0.621). For the other equations, this indicator showed negative values, indicating lower precision for estimation in the continuous reclamation system.
The results found in this study are different from the values obtained by Franco [24], who used the equations of Volobuvev, Cordeiro, Jury, Hoffman, and Reeve in a study with the same soil and two levels of salinity. The author suggested that the best equation was that of Cordeiro for calculation of the salt leaching depth in soils salinized with sodium chloride.
Franco [24] also pointed out that his results differ from some papers reviewed by him, which were highly variable due to the soil diversity and the conditions under which the studies were carried out. Thus, the results obtained by the reclamation equations may depend on soil physical-chemical factors, on the chemical composition of the washing water or on factors inherent to the method used. The lack of this information prevents obtaining consistent results under varying experimental conditions.
The values of the Pearson linear correlation, Willmott concordance index, Camargo-Sentelhas performance index, mean absolute error, root mean square error, and Nash-Sutcliffe efficiency coefficient are reported in Table 8.
Table 8. Pearson's correlation coefficient (r), Willmott concordance index (d), Camargo-Sentelhas performance index (c), mean absolute error (MAE), root mean square error (RMSE), and Nash-Sutcliffe efficiency coefficient (ENS) obtained in the comparisons between the estimated and measured EC values in the continuous reclamation system
Source: The Authors.
4. Conclusions
The reclamation leaching of salinized soils is possible for irrigation management and presents satisfactory results.
Among the leaching equations evaluated, that of Volobuyev represented the best the salinized soil remediation estimates in relation to the results obtained experimentally.
In general, the equations evaluated were more efficient in estimating for the intermittent reclamation system and the calculated values were underestimated when compared with experimental values.

