


 Inglês (pdf)
 Artigo em XML
 Referências do artigo
 Enviar este artigo por email
 Citado por SciELO
  Citado por Google
  Similares em
SciELO
Similares em
SciELO  Similares em Google
 Permalink
1. Introduction
Soybean in Colombia has a growing internal demand, generated by the poultry, fish and livestock agroindustries, which are supplied with the internal production (5%) and requires imports that reach the 358,066 tons of soybean and 833,083 tons of soybean meal per year on average for the last 10 years [1]. Therefore, the national government added policies to increase the area planted within the 2010-2018 period, to encourage sowing that compensates the dependence on imports.
The Colombian Orinoquia is the region with the greatest growth potential of the crop, which currently concentrates 79% of the production [2]. In this region, genetic improvement has focused on disease resistance [3] and increased yield through fertilization, while the grain yield could move from 2 to 4 t/ha, with the use of traditional varieties and application of complementary irrigation [4].
Soybean irrigation is not a common practice in the country, due to the lack of infrastructure, high costs, and climatic factors. In the Orinoquia, the rainfall is maintained during the vegetative and part of the reproductive stage in both semesters of production [5,6]. However, it is necessary to determine the soil water supply, since drought is an important limiting factor, which substantially hampers annual production throughout the world [7].
The soil water content, as an indicator of plant water supply [8], is measured with different methods that vary in cost, accuracy, spatial scale and response time [9]. A real-time diagnosis technique is required at spatial and temporal fine scales [10].
Remote sensing meets the above conditions, and although it was considered an expensive and low precision technique [9], these limitations were overcome in the last decade by reducing the cost of optical sensors and measuring the canopies of plants through proximal sensing. The signals emitted by the optical sensors, that is, the reflectance spectra, depend on the biochemical composition of the leaves in the plants, and with the help of multivariate statistical algorithms, it was possible to associate them to plant water stress [11-14].
The relationship of plant water deficiency is identified with reflectance spectra through mathematical models, known as hyperspectral analysis [15]. These models aim to search regions of the reflectance spectrum that can explain the biochemical composition and physiology of the plant and its change due to the soil water availability [16].
The accuracy of the prediction models depends on the calibration, since the samples to predict must have characteristics in common with those that were used to build the model. The variation due to the plant phenological stages, change of genotype or species is clear when using equipment with an extensive atmospheric window and thousands of wavelengths (350-2500 nm) [11]. For this reason, for a specific application, the ideal is to calibrate the model with the appropriate samples of diagnosis in each case.
In addition to the calibrations, the dispersion caused by the same measuring instrument must be considered, since the higher the spectral resolution, the higher the relationship between the signal and the noise. Therefore, when using hyperspectral sensors, noise also increases [17].
To reduce the amount of noise and dispersion due to the equipment or measurement setting, the spectra are standardized to mathematically correct trends unrelated to water deficits. The objective of standardization is to decrease the atypical variation at each point in each wavelength through corrections to the slope and the trend of the spectral curves [18].The objective of this study was to evaluate the potential of the spectroscopy of Visible Regions (VIS), Near Infrared (NIR) and Short-Wave Infrared (SWIR), for the detection of water stress in soybean plants subject to soil water contents deficit, by means of the construction of a classification model of spectral reflectance measurements in the leaves.
Likewise, the aim is to build a predictive model capable of classifying according to the water treatment applied to the soil, with the use of selected wavelengths according to the differentiation capacity among the three treatments.
2. Materials and methods
2.1. Plant material and location
The test was in the municipality of Villavicencio, in La Reforma village 4°3'40.62"N, 73°27'41.21"W, 326 m.a.s.l., with an annual rainfall of 2933 mm, a median temperature of 26°C, a relative humidity of 85% in the rainy season and 65% in the dry season. Three soybean varieties, Achagua 8, Guayuriba 9 and Iracá 10, were evaluated. In January 2016, two plants per soybean material were planted as experimental unit in 22 cm diameter pots, protected in a house with plastic cover and without walls.
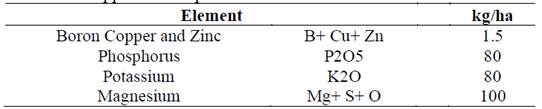
The soil used was disturbed before being poured into the pots and corresponds to an upper terrace Oxisol characterized by the low content of essential nutrients for plants growth. Crop fertilization was dissolved in water according to Table 1, and for nitrogen, soybean seeds were inoculated with Rhizobium bacteria.
2.2. Experimental design
The experimental design was a split plot, where the main plot had three water treatments and the three soybean varieties were randomized. Each experimental unit was replicated seven times, with a total of 62 units, and one plant was discarded within the process. Soil water content was monitored by measuring the volumetric water content every two days. The water layer applied to each plot was variable according to the requirements in each phenological stage.
The water treatments were defined according to the soil water content. The first one was close to the Field Capacity (FC) (volumetric water content above 25%), the second one between 15.1 and 25% of water content, and the third one close to the Permanent Wilting Point (PWP) (<15% water content). The treatments were named as 1, 2 and 3, respectively. The water content in FC and in PWP was determined in the laboratory first by water retention curves, and then the point of FC was verified in a plot, by saturating the soil and allowing drain for 24 hours.
2.3. Equipment and data collection
On a weekly basis, the spectral record was captured in one of the plot plants, from the vegetative state with 5 developed nodes (V5) up to physiological maturity (R6), in the last fully expanded trifoliate leaves, as a growth indicator with respect to time. The equipment used was a portable spectroradiometer (FieldSpec3, ASD, Analytical Spectral Devices Boulder, Colorado, USA) with own light source. The equipment records the relative radiation between the wavelengths of 350 to 2500 nm Vis/NIR/SWIR, using an optical fiber of 25º FOV with a spectral resolution of 3 nm up to 700 nm, and 10 nm up to 2100 nm.
Grain yield data were taken from one plant, since the experimental unit consisted of two plants. The number of full and empty pods were recorded; the full ones were classified by the number and weight of the grains.
2.4. Preprocessing of spectral data
The reflectance values were converted to absorbance values, because the regions of spectral reflectance associated with water content in the leaves are observed as energy absorption in the ranges of a spectral centered band at 1450, 1940 and 2500 nm, with significant secondary absorptions at 980 nm and 1240 nm [19].
Then, data was normalized with the SNV pretreatment (Standard Normal Variate), to decrease scattering in the NIR. For the spectral curve classification associated with the soil water content level, a mathematical model was used through the linear Discriminant Analysis method, and a variables reduction by Partial Least Squares (DA-PLS).
3. Results and discussion
3.1. Differential water treatment for soybean varieties
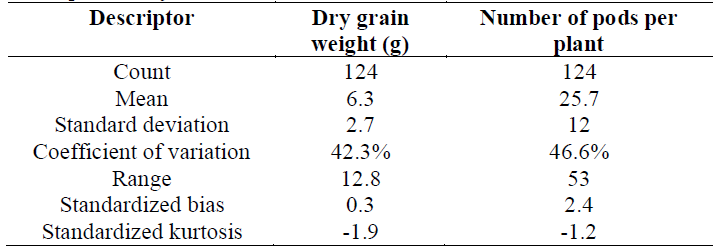
The dry grain weight in each plot was the variable to evaluate the effect of the treatments, where 2 plants were harvested in each plot, that is, 124 samples in total.
The descriptive analysis is showed in the Table 2. The variation greater than 40% with respect to its mean for dry weight, the bias value and standardized kurtosis are within the expected range for data from a normal distribution. Meanwhile, for the number of pods, the bias is out of range, although the normal distribution is assumed by the amount of data indicated in the central limit theorem.
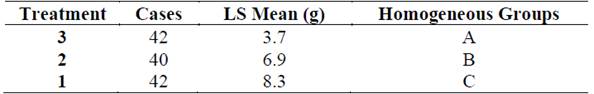
Significant treatments differences were found in the dry grain per plant due to soil water content. The mean dry grain production decreased when the level of soil water deficiency increased; the treatments were different from each other (P-value<0.01). The comparison among the means of the 3 possible combinations of water treatments, showed significant differences, for contiguous treatment.
In other words, for each degree range of difference, between treatment 1-2, there was a dry weight loss of dry grain per plant of 17%, and between 1 and 3 of 56% (Table 3). These results are similar to other studies [20], where the dry grain losses per plant were 12% and 49%, when it was only irrigated with 80% and 60% of the total evapotranspiration, respectively.
Table 3. Difference of means for grain weight, for the three soil water contents, Method: 95 percent Bonferroni, sigma LS 0.3.
Source: The Authors.
In general, the production of total dry grain, among soybean varieties, did not showed significant differences, thus it was assumed that water deficit affects uniformly the production of the three varieties.
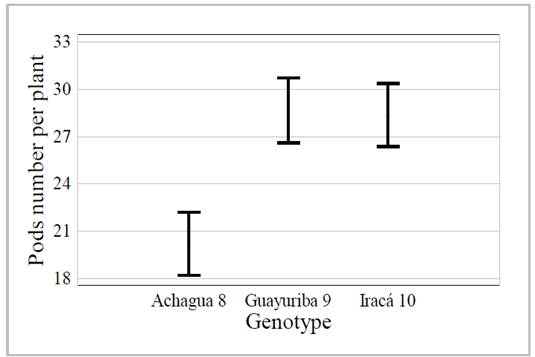
Another indicator of plant stress was the total number of pods per plant, in which the three groups are separated, without interaction between the genotype and the water treatment, although both factors had significant differences. The number of pods for Achagua 8 was significantly lower, compared to the Guayuriba 9 and Iracá 10. This could be due to the fact that it is not the recommended genotype with adaptation to the area of the Piedmont plains. In the description, its strength lies more in the production of pods with a greater number of grains [21] than in generating more pods [22], as shown in Fig. 1.
Source: The Authors.
Figure 1. 95% Confidence intervals, Bonferroni comparator for each of the means
Similar to the dry weight, the three water treatments significantly affect the number of pods, and the range of the soil water content is proportional to the number of pods per plant. The driest treatment had the less pods. For each level of water decrease in the soil, pods decreased 26% for the intermediate treatment and 56% for the treatment close to PWP (Table 4). These results are compared with other studies [23], in which the number of pods per plant decreased in 5, 20 and 32% when an irrigation layer was reduced in 60, 40 and 20% with respect to the reference.
3.2. Spectral information analysis
Although measurements were weekly, only data taken at flowering and at the beginning of pod formation (R1, R2 and R3 stages) were used. The reason is that at the vegetative phenological stage and at the seed formation it was not possible to obtain efficient classification models with the described methodology.
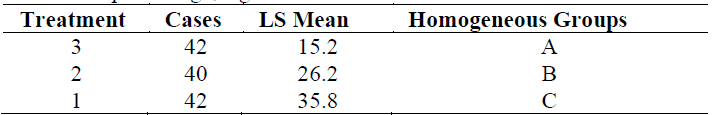
The DA-PLS classification model had an accuracy of 82.5%. Table 5 shows the confusion matrix for the model evaluated by cross-validation.
The precision of the model is affected by the range separation of the water content maintained in the soil. In other words, the classification loses efficiency, since treatment 2 is intermediate among the three, which makes it predictable as a sample of treatment 1 or treatment 3.
When the measurement of samples with water content still available but lower than the FC were omitted, the model showed an accuracy of 92.9%. The proposed model could be used when a fixed irrigation layer is available, and the decision would depend on the soil water content lower than the FC. When using the three water treatments, it is possible to decide how much water to apply by using variable layers, according to the classification. This could reduce the amount of water and optimize resources and economic cost.
The values of specificity and sensitivity for each group were calculated based on the values predicted by the model. The critical diagnosis situation is that when the plants belong to groups 2 or 3 (soil water content lower than the FC), they are classified by the model within group 1, in which additional water would not be required, thus the results would lead to low production. This means that group 1 must have high specificity to avoid false positives, that is, pods with a need for low water content predicted as if they were in FC. Groups 2 and 3 should have a high sensitivity to avoid false negatives, or pods that have a water content below FC and are predicted in the wrong group (Table 6).

In the development stages used (R1, R2 and R3), there were 63 individuals, 21 of each treatment, while, for the construction of the classification model, there were up to 2151 variables, delivered by high definition or precision in the range of measured wavelengths, from 355 to 2494 nm. Therefore, it was necessary to reduce the variables to 5 factors, found by principal components.
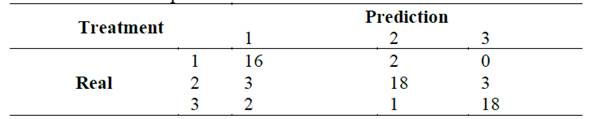
The linear regression coefficient between all the combinations of wavelengths was calculated to explore the correlation and redundant variables. It was observed that with the NIR and SWIR, the consecutive wavelengths were wider than those of the Vis (Fig. 2).
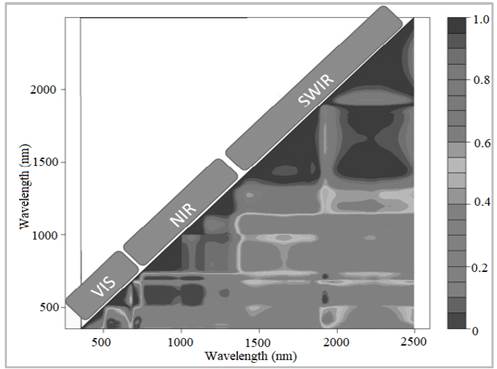
The continuous wavelengths have a high collinearity with each other, whereby the weights of the variables in the factors are related to areas of the spectrum with broadband steps, which are in turn related to the hydric state in the leaves. Fig. 3 shows that the NIR near-infrared region (780-1310 nm) is not significant, while the region that most influences the model is the one visible in blue, green and red borders, with a much thinner band step than the previous two.
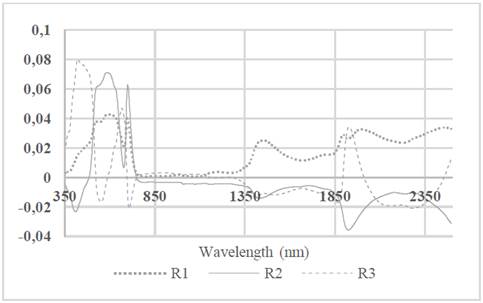
The second most important region in the SWIR shortwave infrared comprises the wavelengths between 1850 and 2000 nm that have a change of slope in the characteristic spectral curve related to the water content in the leaf [11]. This author found that the wavelengths with the highest sensitivity to relative water content (RWC), using the relationship between dry weight and moist weight in the leaves, are close to 1450, 1940, and 2500 nm.
In factor 1, greater weight is given to the regions from 1430 to 1470 nm and 2100 to 2270 nm (Fig. 3). The reason is related to the general areas for the first harmonic of the O-H stretch, the combination band of the O-H stretch and the O-H deformation, and the combination band of the O-H stretch and the F-C deformation for cellulose, respectively [24].
However, factors 2, 3, 4 and 5 do not show high correlation in these regions, since they are more detailed and specific to the variation due to water stress. Thus, they are less affected by chemical differences in H-bonds and other subtle interactions play a role in NIR measurement. For example, in the range of 1300 to 1500 nm, water has a high absorption of radiation, which limits the application of these wavelengths, since reflectance becomes saturated even when there is low water availability [25].
Stepwise linear discrimination methods found that the regions of blue, green, red and red edge are the most important in the classification [26]. However, in the same study, results were found in the NIR region at 820.7, 835.5, 852.2, 870.3 nm for the maize species. This last region was not relevant for our case study, according to the weight that each factor had.
Studies with complete spectrum analysis in soybean with water stress measured in the leaves are not frequent in the literature. However, differences have been found between the spectral curves of fresh leaves and dry leaves, in which the latter group shows an increase in reflectance. This could be attributed to leaf structure parameters, where the cell walls of the leaf mesophyll cells limit cell volume at maximum turgor pressure [14]. As a leaf becomes dehydrated, water loss decreases cell volume by 10-20% until the turgor pressure is zero [27]. With the decrease in cell volume, mesophilic cells can be separated from each other by exposing more cell walls to the intercellular airspace, therefore, each species shows differently the dehydration process in the spectrum.
4. Conclusions
The prediction of water states in soybean through spectral measurements in the leaves was only possible in the reproductive stages, because the vegetative plants of the soybean materials used were resistant to low contents of water in the soil, as could be seen in the field during periods of low rainfall. At the beginning of pods filling, the plant expresses stress due to water deficit and it is possible to differentiate this condition by the reflectance technique evaluated.
The methodology of spectroscopy used to diagnose stress by low water content of soil under plastic cover conditions, allowed to differentiate plants with water deficit in states R1, R2 and R3, by linear discriminant analysis with an accuracy of 82.5% with five regression factors, where the most important regions of the spectrum were visible, followed by the middle infrared. Near infrared is not a region that influences the factors that build the classification model.
In addition to the treatment of permanent differential water content during the stages of development of the soybean crop, it is necessary to make specific deficit diagnoses for each vegetative state. This allows evaluating the capacity of recovery of the plants and the production affectation, in order to complement the present study with fast and efficient diagnostic tools used in the field and in great extensions.

