


 English (pdf)
 Article in xml format
 Article references
 Send this article by e-mail
 Cited by SciELO
  Cited by Google
  Similars in
SciELO
Similars in
SciELO  Similars in Google
 Permalink
1. Introduction
The apple tree crop is spread throughout numerous regions of the world due to its easy adaptation to different climatic conditions, soil types and production systems. However, the great demand by the world fruit market, competition from producer countries with lower production costs, together with the serious price crisis that the Spanish fruit sector has suffered in recent years, have hindered the return of high investments and maintenance costs of crops. Some alternatives to maintain the profitability of the fruit sector include reducing the production costs and ensuring an excellent quality product that can compete with an advantage in increasingly demanding markets. Both can be achieved with an appropriate degree of mechanization and automation in some production phases, such as harvest [1,2] or quality control and selection.
Fruit-making companies currently execute quality inspection manually, employing trained operators who sit on selection tables and visually inspect fruits individually. However, the absence of clear criteria when determining the quality of a fruit and the burden of carrying out such a repetitive task have a negative impact on the homogeneity of this selection, as well as in maintaining an stable and objective quality criteria. Additionally, some impact injuries occur due to handling during the post-harvest life of the fruit.
The main problem is that the damage is perceptible days after it occurs, sometimes when the fruit is already on the market, manifesting physical changes in the tissue texture and eventually in chemical alterations that lead to changes in color and flavor, which causes the consumer rejection [3], [4]. For this reason, it is important to research and advance in techniques capable of detecting these damages before the symptoms are visible to the human eye [5], in order to identify mechanical damage before the fruits reach consumers, avoiding a loss of the commercial value of the product. Studies carried out by [6] show that 37% of the apples that reach retailers in the city of Madrid exhibit bruises and 41% exhibit other defects. To avoid these situations, image analysis is presented as an efficient technique for estimating the quality of horticultural products [7], while hyperspectral systems can be used to detect fruit properties and internal damage [8].
2. Materials and methods
2.1. Plant material and location
Apples from the 'Fuji' cultivar harvested in the Huesca region (Spain), Osso de Cinca, were used for this study. Fruits harvested eight days earlier and with a state of mature ripeness were selected, with a reddish-green skin color, white pulp color, a pleasant aroma and slightly sweet-sour taste.
2.2. Sample preparation
We used 1050 apples that were marked and hit only once in the equatorial zone of the fruit with a mechanical pendulum, graduated at 90 degrees to control the place of the blow and the impact force according to the methodology described by [9]. The force used for the blow was 1.5 N.
The bruised apples were stored at two temperatures: at 4 ° C in cold room, reflecting storage conditions for long periods and at room temperature of 20 ° C reflecting the conditions that the apple may have at the time of packaging, transport or marketing.
Three experiments were carried out with these two temperatures and different imaging times. This part of the experiment was called phase one. The tests were repeated three days after the completion of the first phase (phase two). The experiments had the following conditions:
Experiment A: 100 kg of fruit (350 fruits) were stored at 4 ° C. Hyperspectral images were taken every hour from the moment of the blow until six hours later.
Experiment B: 100 kg of fruit (350 fruits) were stored at 4 ° C. Hyperspectral images were taken daily for seven consecutive days to follow the evolution of the blow.
Experiment C: 100 kg of fruit (350 fruits) were strored at 100 ° C. Hyperspectral images were taken daily for seven consecutive days to follow the evolution of the damage caused by the blow.
2.3. Image acquisition
Images were taken with two types of spectral systems: the first covers the near infrared (NIR) and the second covers the visible and part of the infrared (VIS-NIR). The equipment description is detailed below.
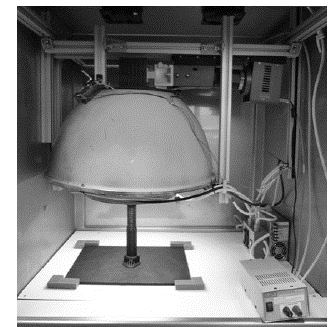
NIR images: A total of 220 hyperspectral images in the range between 900 nm and 1700 nm were taken, using an image spectrometer (ImSpector N17E, Specim, Finland) coupled to a sensitive camera in the infrared (Xenics XEVA-USB 2.0; XenicsVision, Leuven, Belgium). Lighting was controlled by a hood with a hemispherical diffuser and 12 halogen lamps (USHIO, Eurostar IR 12 V - 37 W) (Fig. 1).
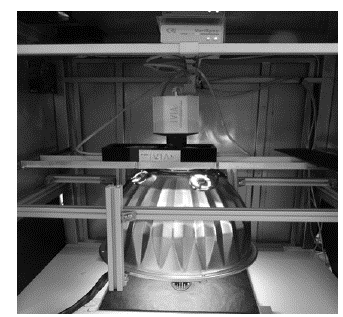
VIS-NIR Images: A total of 110 spectral images (hypercubes) were taken using two liquid crystal tunable filters (LCTF): one sensitive in the visible (Varispec VIS-07, CRI, Canada) with a spectral range between 400 nm and 720 nm and a resolution of 7 nm and a sensitive one in the near infrared (Varispec NIR-07, CRI, Canada) with a spectral range from 650 nm to 1100 nm with a spectral resolution of 7 nm. Both filters were coupled to a monochromatic camera (CoolSnap ES, Photometrics ©, Tucson, USA), with optics (Xenoplan 1.4 / 17 mm C-Mount, Schneider, Germany) that allows to maintain the focus at all wavelengths. Lighting was controlled by a hood with hemispherical diffuser and 12 halogen lights (Philips A6, Brilliantline 12 V - 20 W) (Fig. 2). To control the parameters of image acquisition, it was necessary to automatically synchronize the filters with the camera using a software program developed for this work.
2.4. Processing of hyperspectral images
First, images pre-processing consisted in a white and black correction reference following the methodology of [10]. For this purpose, a flat white reference with a calibrated reflectance of 99% was used (CSRT-99-050, Labsphere Inc, USA). This procedure corrects spatial and spectral variations due to the equipment and the lighting intensity on the scene in all the hypercube bands.
The corrected image was obtained from the spectral image of the apple and the reference black and white images, dividing the absolute radiance of the apple into the absolute radiance of the white reference, according to Eq. (1):
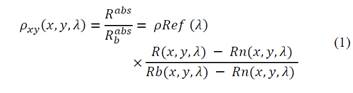
where:
ρRef (λ): Average reflectance of the white reference (99%) percentage.
R(x, y, λ): Apple reference (8-bits resolution, a value of 255 equals 100%).
Rb(x, y, λ): Radiance of the white reference (8-bits resolution, a value of 255 is equivalent to 100%).
Rn(x, y, λ): Radiance of the black reference (8-bits resolution 8 bits, a value of 255 equals 100%).
2.5. Creation of the tagged data set
A tagged set of data was created with information of the two classes involved (healthy and bruised). A specific software was developed that allows the researcher to open a hyperspectral image, placing itself in the band with the greatest contrast between the damage and the healthy skin. This is made by manually changing the spectrum band in the program until finding the image with greatest contrast where the classes involved are distinguished, and selecting the healthy and bruised regions using a computer mouse. As a result, a database was obtained for each of the acquisition systems studied, including the reflectance values of each pixel, the class to which it belongs (healthy and bruised) and its position (x, y) in the image, corresponding to each of the wavelengths acquired in the spectral ranges used (NIR, VIS-NIR).
Least Squares Discriminant Analysis (PLS-DA)
To reduce the dimension of the data, a PLS-DA is applied. The PLS that seeks to obtain a smaller space that maximizes covariance between the data and the dependencies of the model, while the DA seeks to reduce the dimensionality in terms of maximizing the distance between various classes and minimizing the distance between the data of the class itself. From this model, the components for the data obtained with the two acquisition systems were identified, in order to study which of them offers greater predictive power. Likewise, the VIP values (Variable Importance in Projection) were obtained for the wavelengths of the systems used, which indicates the total contribution of the wavelength to the PLS-DA model.
2.7. Classification of data into mutually exclusive groups
After classifying the data into the two classes, a confusion matrix was used to evaluate the degree of consistency between the classes assigned by the classifier and their correct locations according to the tagged data. In this step, the selection quality of the training classes were extracted from the classification representing it in a 2x2 matrix, where the columns correspond to the labeling data and the rows to the classifier assignments. The percentages of the classes that were correctly and erroneously classified are obtained from the data of the matrix, that is, the percentage of pixels that were classified as healthy, being struck (false positives), and the percentage of struck pixels that were classified as healthy.
2.8. Ranking of the most significant wavelengths
For each experiment, a ranking was organized with the VIP values of the different wavelengths, ordered from highest to lowest, where the VIPs with the highest value correspond to the wavelengths that contribute the most to the classification model. Additionally, a joint ranking of VIP values was obtained for the three experiments A, B and C. For this reason, the mean of the VIP value was calculated for each wavelength of each experiment and a ranking of the five most important wavelengths was established, in order to detect the bruised and healthy areas of the apples.
3. Results and discussion
3.1. Dimensionality reduction and spectral range selection
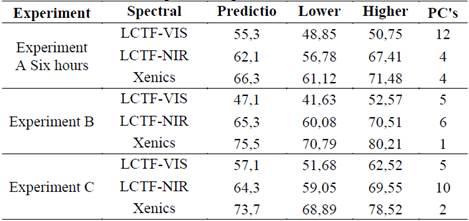
Results are shown in Table 1, where the prediction values of each spectral range (NIR, VIS-NIR) and each experiment are indicated.
Since damage was generated during its evolution, the NIR spectrum in the three experiments was better in power of description. In experiment A, the NIR spectrum obtained a predictive power of 66.3% with a confidence interval of 61.1% and 71.5% calculated with Eq. (2).
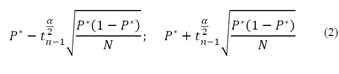
where:
P *: Oredictive power percentages.
N: Sample size.
In experiment B, a predictive power of 77.5% was obtained with a confidence interval of 70.8% and 80.2%. For experiment C, predictive power was of 73.7% with a confidence interval of 68.9% and 78.5%. In all three experiments, the NIR spectrum was higher in the prediction than in the VIS-NIR spectra.
Similarly, the NIR spectrum can be represented with a smaller number of components offering a more robust model, since it only needs four components in experiment A, one component for B and two components for C. Meanwhile, in the VIS-NIR spectrum more components are needed and its predictive power is lower. The NIR spectrum is considered as the most suitable for this problem, thus results are presented only for this system and its spectral range.
In the three experiments, it is observed that the Xenics camera obtained the highest prediction value and that it coincides with the least amount of components of the model (Table 1). For the six-hour experiment A, the model can be represented with 4 components, while experiments B and C with 1 and 2 components. This can suggest that the six-hour experiment needs more than the wavelengths to identify the classes, while in experiments B and C less information is needed since they only need 1 and 2 components, respectively. This is also due to the early stages of the demage, as it is more difficult to identify the area and classify the pixels. In the other experiments, there was more time for classification and the model is expressed with fewer components.
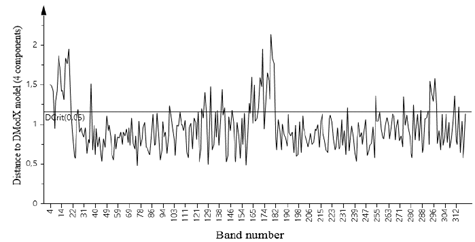
Experiment A: In the reduction of the dimensionality of experiment A, the model obtained does not display a number of anomalous values (Fig. 3) above the expected approximation, and never with extremely high values.
Source: The Authors.
Figure 3. Distances to model X [4 Components] (PLS-DA), NIR spectrum, experiment A.
It is worth highlighting that, for previous models associated with all the observations, the existence of influential data (high values in certain components) forced the existence of these components, resulting in little robust models (and over adjusted) ranging between 6 and 12 components.
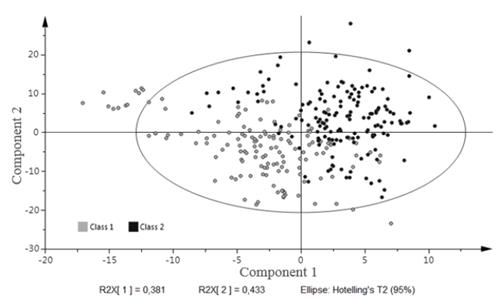
The score-plot graph is obtained when facing the components of the selected models. It shows the confidence oval in which 95% of the component scores must be present in order for the model to be reliable.
Fig. 4 shows the graph of the score-plots for component 1 versus component 2 in experiment A. it was found that 95% of the component scores are within the confidence oval.
Source: The Authors.
Figure 4. PLS-DA Score-plot: component 1 versus component 2 for the NIR spectrum in experiment A.
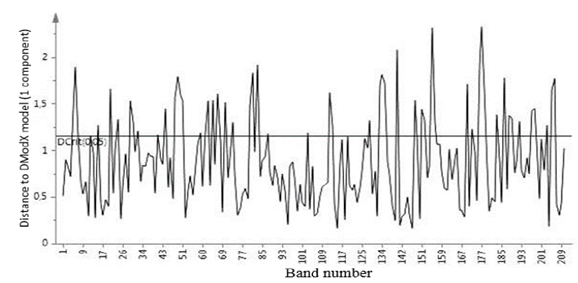
Experiment B: The model obtained for this experiment does not display anomalous values above the expected in an approximate manner and never with extremely high values, as shown in Fig. 5. In addition, it was found that all the model variability can be represented with only one component.
Source: The Authors.
Figure 5. Distances to model X [1 component] (PLS-DA), NIR spectrum, experiment B
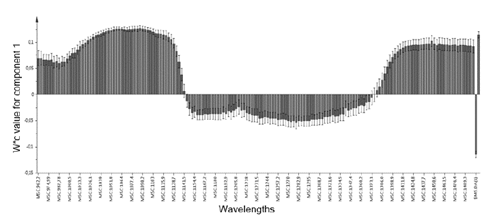
In order to determine the type of relationship of the spectral bands with the two classes analyzed (Healthy Class and Bruised Class), graph w * c (Fig. 6) is attached for the first latent variable of the treatment, whose weights (in absolute value) do not necessarily have to coincide with the order of the VIPs.
Source: The Authors.
Figure 6. Weights w * c of the first component, for the NIR spectrum, Treatment B
In Fig. 6, the wavelengths are displayed in the X-axis against the weight of such wavelengths in the first component.
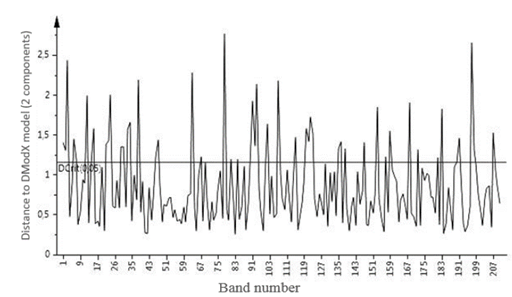
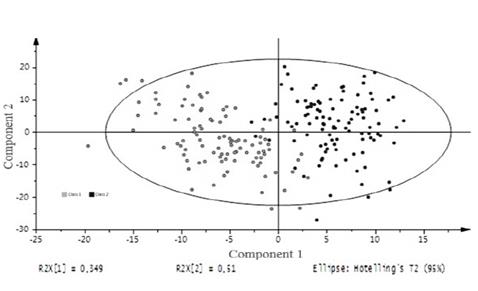
Experiment C: As in the previous experiments, the model obtained for this experiment does not display anomalous values (Fig. 7), and is constituted by two components that express all the variability of the model. The score-plot graph is obtained (Fig. 8) when facing the components of the model, in which 95% of the scores are inside the confidence oval, which renders the model reliable.
Source: The Authors.
Figure 7. Distances to model X [2 Components] (PLS-DA), NIR spectrum, experiment C.
3.2. Classification of data in mutually exclusive groups
Experiment A: The analysis of the variance of the time and class factors shows that the effect of time is not significant in the fruit classification (p <0.05) and, therefore, no differences related to the evolution of damage over time were found.
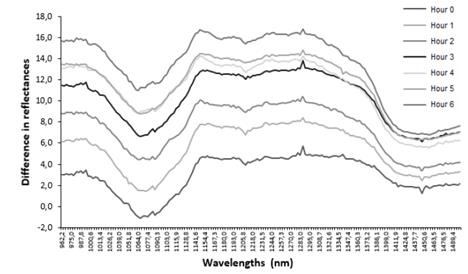
One possible explanation is that, as shown in Fig. 9, apples ripen differently, which has a great influence on the evolution of damage.
Source: The Authors.
Figure 9. Average differences between the spectra of healthy and bruised areas.
This makes it difficult to establish a valid threshold or discrimination function for all fruits. In [11], the authors obtained a similar behavior detecting blows in different apple cultivars (‘Champion’, ‘Gloster’, ‘Golden Delicious’, ‘Idared’ and ‘Topaz’) after an hour of causing the damage. Likewise, in [12] the authors used the same apple cultivar and studied the evolution of the blow in different stages at 0 hours, 12 hours and 18 hours. They found that the blow can be detected from hour zero, and concluded that time only affects the percentage of classification. Additionally, other works such [13], detected the damage after one hour from the event, excluding time as a variable that affects the classification. Fig. 9 shows that the average of the differences between bruised and healthy areas within the same apple increase in time, although this does not guarantee that between different apples clear thresholds can be established, since no significance was found with the ANOVA. The reason is the variability existing between apples, which changes to the residual variance, since the type of apple where the classification model is located cannot be controlled each time.
However, results obtained in terms of the detection of the bruised area help to lay the foundations for the development of devices that can potentially detect this type of damage, sometimes caused by the classification line itself. Different works, such as [14], use light scattering techniques and hyperspectral images for the prediction of blow damage at different strength levels. In [15], they developed a damage detection system in ‘Jonagold’ apples based on real-time pixel classification, obtaining 98% accuracy in the classification.
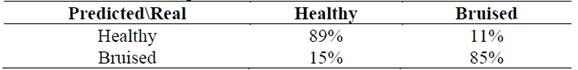
Table 2 shows the confusion matrix obtained for the pixels classification. On the one hand, it was found that the model classifies 89% of healthy pixels correctly and the remaining 11% are classified as bruised, which are false positives. On the other hand, the model classifies 85% of the bruised pixels properly and the remaining 15% are classified as healthy.
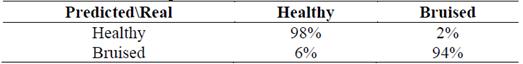
Experiment B: the evolution over time is not significant, thus data corresponding to all the moments of time in the model found are included, which generated an adequate classification. Finally, the model achieves a power of success in the classification, including the observations previously eliminated at the time of construction: 98% for healthy, and 94% for bruised ones (Table 3).
Experiment C: As in experiment B, the evolution over time in experiment C is not significant. Nevertheless, it achieves a high power of success in the classification, including the observations previously eliminated at the time of construction: 100% for healthy and 93% for bruised ones (Table 4).
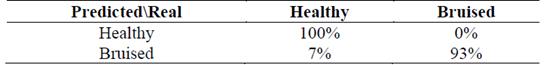
The success in the pixels classification of healthy apples in experiment B and experiment C are practically the same (98% and 100%), therefore, only 2% false positives were obtained. In pixels classification bruised apples, accuracy ranging between 93% and 94% was reached for the two experiments. In [12], they used other classification models in the same cultivar confirming that time (evolution of damage) only increases the accuracy in the classification of pixels as shown in experiment C.
3.3. Ranking of the most significant wavelengths
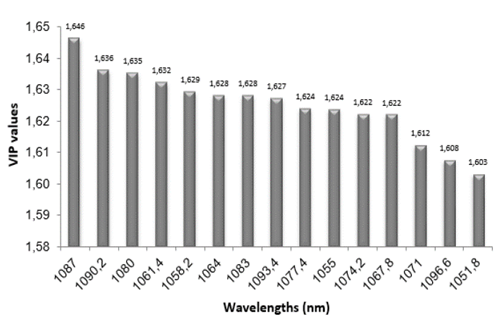
Experiment A: With the values of the distance graph to model X (Fig. 3), we extracted the VIP values that summarize the total contribution of each variable X (in our case, each wavelength) to the PLS model. The variables with higher discrimination power for the chosen model, according to the model importance (VIP) list, are those shown in Fig. 10.
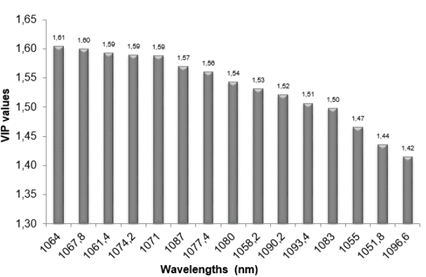
Fig. 10 shows that the wavelengths that contribute the most to the classification model are around 1060 nm and 1100 nm, where the first is the most significant contributor to the model.
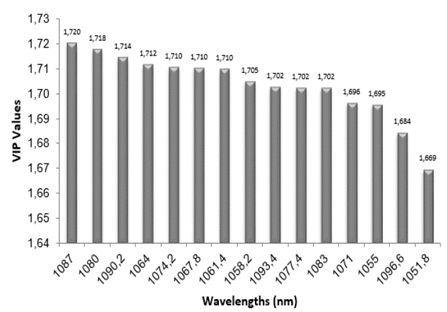
Experiment B: As in experiment A, the VIP values of Fig. 5 were extracted and represented in Fig. 11.
When observing experiment B in Fig. 11, it was found that the wavelengths that contribute most to the model are around 1050 nm and 1100 nm. In this case, the range is extended but the spectrum area does not change.
Source: The Authors.
Figure 11. Variable importance for wavelengths projection (VIP) with greater discrimination power for experiment B.
Experiment C: Using the same methodology as in the previous experiments, the VIP values of Fig. 7 were extracted and are represented in Fig. 12.
When observing experiment C in Fig. 12, the same behavior as in experiment B is shown, the wavelengths that contribute most to the model are around 1050 and 1100 nm.
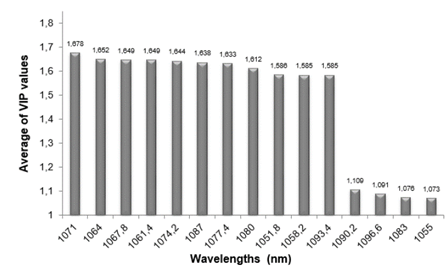
3.4. Most significant wavelengths
Based on the mean values of the VIP wavelengths of the first 5 bands of experiments A, B and C, the wavelengths with a greater discrimination power of the healthy and bruised classes 1071, 1064, 1067, 1061 and 1074 were chosen, which were used to identify the blow in the 'Fuji' apple, in the area of the spectrum that goes from red to near infrared (Fig. 13).
In the work of [16], the authors used the same cultivar and hyperspectral images from 450 to 1000 nm. They found that the most significant lengths are 780, 850 and 960 nm using the segmented principal component analysis (PCA) technique. It is possible that if in the work of [16] they had used a camera with a greater spectral range, they would have found wavelengths closer to those found in this study. Additionally, their success in the classification had an 8.5% of false positives without taking into account the storage temperature or the impact force of the apple. In the work of [17], the authors used the same cultivar and hyperspectral images from 400 to 1000 nm, proposing a method that combines a successive projections algorithm (SPA) with a support vector machine based on the optimization of grid search parameters (GS -SVM) to classify and identify apple samples with different degrees of shock and obtaining wavelengths from 882 to 983 nm. Although it coincides with [16], it is worth mentioning that they did not take into account the impact force and storage temperature, in addition to classifying them in different degrees of the blow, obtaining classification accuracy percentages ranging between 62.5% and 80%.
Different authors, such as [18-20,12], have found wavelengths closer to the visible one for the shock detection. However, this is due to the limitations of the equipment used, as expressed by [8], who performed a compilation of research on the application of hyperspectral images for fruits and vegetables. However, in the researches quoted by [8] it is also established that the infrared provides valuable information for damage detection. In [21], they found that in the bands centered at 558, 678, 728 and 892 nm, the blows were detected in 'Golden Delicious' apples, just as [12] in the same cultivar they found the wavelengths of 680 and 960.
The importance of the 'Golden' cultivars, used by [21] and [12], are their greenish-yellow skin, which makes it possible for the effect of the light with its skin tone to detect damages in the spectrum lengths between yellow and green. Bruises were detected in 'McIntosh' apples at three wavelengths in the near-infrared region 750, 820 and 960 nm, in [19]. Apples from the 'McIntosh' cultivar have red skin, similar to those of the 'Fuji' cultivar, with a skin tone ranging from green to red, which explains why their bruises can be identified from red to near infrared in the spectrum area.
However, in the work made by [20], the evolution of mechanical damage caused in different cultivars in the spectral region from 900 to 1900 nm was followed. They found that the most significant wavelengths to identify the blow were all in the infrared, specifically 970, 1200, 1470 and 1900 nm.
As for the accuracy in the pixels classification by PLS-DA, the classification of healthy apples in experiment B and experiment C are practically the same (98% and 100%), thus there was only 2% false positives. In the pixels classification of bruised apples, a success between 93% and 94% was reached in both experiments, which leads to the conclusion that the temperature effect is not important for pixels classification. In [22], they used a PLS-DA model in three apple cultivars (‘Jonagold’, ‘Joly Red’ and ‘Kanzi’) obtaining a success in classification between 90.1% and 96% with a temperature of 4°C, as the one used in this experiment. It also highlights, as in [12], that time increases classification success after the blow. Regarding treatment A, it was concluded that the model classifies 89% correctly out of 100% of healthy pixels, and the remaining 11% are classified as bruised, while 85% out of 100% of the bruised pixels are classified correctly by the model and the remaining 15% is classifies as healthy pixels.
In the work of [18], they used the PLS data pre-processing methodology to detect bruises on ‘Jonagold’ apples, obtaining a correct classification rate of 84.6% healthy areas and 15.4% of false positives. For the bruised areas, there was a success ratio of 77.5% and a 22.5% of false positives obtained. Additionally, the peduncle area was classified with a success rate of 98.3% and only an error of 1.7%, which indicates that the selection of classification algorithms proposed for the ‘Fuji’' apple (PLS-DA) is more appropriate, since they are more predictive than the ones proposed in [18].
4. Conclusions
It was found that the most significant wavelengths (1071, 1064, 1067, 1061 and 1074 nm) are obtained through a PLS-DA, showing that the NIR area between 1050 nm and 1100 nm is the one with the highest classification power between the two classes studied (healthy and bruised).
The study of the temporal damage evolution in order to determine the moment from which detection is possible concludes that the effect of time (evolution of the blow) is not significant in the pixels classification of fruit, which means that from the first moment of the blow, the pixels can be classified in both categories established as healthy and bruised.
It has also been concluded that the analysis of the hyperspectral images used in this study can prematurely determine the existence of damage in the fruit, which allows its practical application in the industry.
However, it would be necessary to further reduce the number of selected bands, since the range found in this work (1050 nm to 1100 nm) is small compared with the range used in the study (400 nm to 1700 nm).

