


 Inglês (pdf)
 Artigo em XML
 Referências do artigo
 Enviar este artigo por email
 Citado por SciELO
  Citado por Google
  Similares em
SciELO
Similares em
SciELO  Similares em Google
 Permalink
1. Introduction
Mexico is characterized as a country of great inequalities, a condition that is reflected in the cities and the quality of life of its inhabitants. Mobility is understood as the ability to move from one place to another and has become one of the most important needs for a population, which creates priorities to the government agendas. Public transport services represent a crucial point to the economy of the cities, making it a trigger factor that allows organizations to link with the population. However, the strategies implemented in the city of Morelia, in most cases, have failed to create the welfare conditions and prosperity that its society deserves. The accelerated growth of the city has taken place in a context of uncertainty and mistakes regarding urban planning and regulations. The territorial expansion involves an urban development of low density with high car dependency and, despite the public transport system is used by the vast majority of the population, there are no projections for public transport systems’ improvement or growth, a situation that only exacerbates the problem of urban mobility. In Morelia, the public transport systems are concessioned, which is why the government is restricted to only regulate transport organizations and cannot completely regulate the system. This business model has a lot of disadvantages, being the low quality of the service the most relevant one.
Morelia has 14 public transport routes, usually called “combis”, which have sub-routes that vary in their journey, covering the entire metropolitan area. According to numbers presented by the INEGI in 2015, the city has a population of 784.776 inhabitants, out of which 55% use the service. Since it is a social need, the responsible organizations of this service usually put aside such an important feature of business success: the quality of the service. Evaluating the quality of public transport service is an area of opportunity that should not be missed, as it is beneficial for both parts, on the one hand, meeting the necessities of society and on the other hand, allowing organizations to improve their activities, giving them the opportunity to correct the problems presented in the service, in order to become a profitable business, without neglecting the most important: the users of this service.
The main objective of this paper is to evaluate the quality of the public transportation service in the city of Morelia, Mexico. In section 2, this document presents a literature review, revising concepts about service, quality and the principal literature of SERVQUAL applications around the world. All the tables and figures were elaborated by the authors. Section 3, presents the applied methodology, while Section 4 shows the results of the research. Finally, in section 5, the importance to assess the quality of the services and the value of an efficient transportation system is discussed.
2. Literature review
2.1. Background
For many years, two socioeconomic variables remained almost unchanged in early civilizations. From the time humans learned how to domesticate some animals and later to control wind currents to harness this force for their benefit, the way of work and transport means remained unchanged in most civilizations, regardless of the socioeconomic conditions of their citizens. At this point in history, the conceptualization of quality begins [1].
Eventually, the problems of working together became more difficult, organizations grew immeasurably and their headquarters were increasingly remote. There was thus a need to develop management models in order to achieve the goals of the organization. Furthermore, such models have induced benefits and respect for workers. Organizations around the world have had to adapt their technological and administrative systems to operate in more profitable ways. The common factor in administrative changes, especially in economies where competition is encouraged, consists of looking for ways to provide quality products and services to attract the consumer. The key to success is to be competitive, which means that a society can successfully obtain the materials and/or emotional satisfaction that allows them to live with quality [2].
Not long ago, enterprises had no competition due to the government protectionism. Customers had no other option than buying whatever was in the market, even if it was bad and expensive. The market’s amplitude and complex demands include a complete aspect of organizational problems with cost structures, organizational relationships, staff development, technological changes, and machinery [3]. Globalization has raised the challenge for firms to adapt to a changing world [4].
2.2. Quality concept
A huge number of organizations are implementing quality processes, or at least, are trying out projects and programs that include some quality objectives. It is common that such corporate efforts are focused on problem-solving, improving productivity and quality assurance. Quality is best defined as the ability of a company to meet the needs of the internal and external customer [5]. Quality was an issue related to manufacturing activities, which has slowly made significant inroads into other sectors of human activity. Quality a series of features that remain fixed, it is an improved quality [6]. Also, quality can be understood as the ability of a product or service to fulfill the customers’ needs and contribute to their well-being [7].
The definitions of quality vary in several aspects, but all of them focus on considering it as a set of techniques and procedures for planning, controlling, and improving all the organizational activities to deliver a product or service that satisfies a customer’s needs and expectations [2]. Quality has four evolutionary phases, beginning with the inspection, to avoid defective products to reach the consumer, and it has now been perfected, considering it as a management strategy for competitiveness which involves all of the administrative, operational and support systems of an organization.
2.3. Importance of quality
The service sector, which exceeds two-thirds of the world’s gross product of modern economies, has lower levels of productivity than the "traditional" sectors, such as the industrial or extractive ones. This lower productivity is associated mainly with the lack of design and the high requirements of human labor in service processes [8]. What distinguishes utility companies from industrial goods it is that the former’s primary function is to perform a service and not selling a service [9]. The goal of a competitive industry, regarding quality, can be stated as providing a product or a service whose quality has been designed, produced and sustained at an economic cost and which entirely satisfies the consumer. The overall quality of the product features and service in terms of marketing, engineering, manufacturing, and maintenance through which the product or service in use meet customer expectations [3].
Finally, all professional service firms must identify the customers they wish to serve, the marketing problems posed by a methodical and thorough study of the market, as well as the use of the information gathered to guide their marketing activities [10].
2.4. Quality in services
Many times, a large number of organizations focus on production as a way to improve their results. This activity can be substantial but it cannot be used to measure the performance of utility companies. First, it is important to define what a service is. Services are deeds, efforts or performances exchanged between the producer and the user without property rights. Also, a service may be defined as other intangible assets which meet the needs of service providing pleasure, information or comfort [11]. There are seven characteristics that identify a service: Intangibility, Inseparability, Heterogeneity, Expertise, Perishability, Fluctuating Demand, and Property [9].
Moreover, there are 5 dimensions, developed by Parasuraman in order to evaluate the quality of services: 1) Reliability, ability to perform the promised service responsibly and accurately; 2) Sensitivity, the ability to perform the promised service responsibly and accurately; 3) Trust, it is a kind and intelligent attitude that inspires confidence and security; 4) Empathy, is understanding, interest and individual attention to customers; 5) Tangibles, appearance of physical facilities, equipment, personnel, and printed materials [12].
2.5. Service applications around the world
Service quality is a very important topic for researchers around the world, and many studies have been carried out to deepen the knowledge about the subject in service fields as Education, Health, Transportation, Banking, and others. The following examples describe the work of some authors in different countries, divided by continents:
2.5.1. Africa
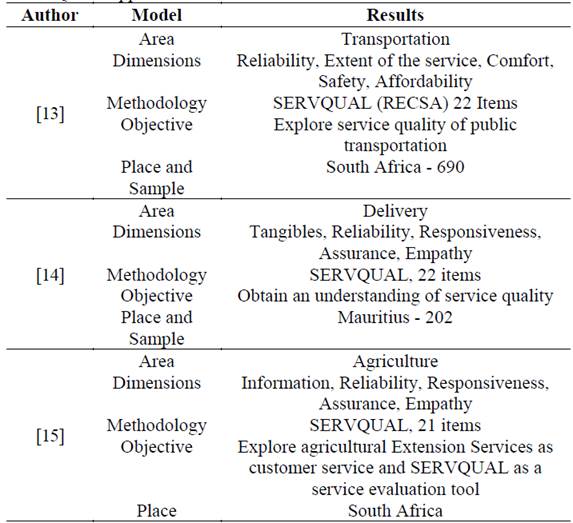
The first case, is one of the most important ones for the evaluation of quality in the transportation; this work is a deviation from the usual SERVQUAL service quality dimensions, by measuring service quality using a more appropriate instrument which considers reliability, extent of the service, comfort, safety and affordability -RECSA- as broad attributes/dimensions of transport service quality [13].
From a practical aspect, the next study attempted neither to test existing theory nor to develop new research instruments. The study tried to present the findings of assessing the expectations and perceptions of service quality for customers and FLE (First-Line Employees) in a public service context in Mauritius [14].
The last of the African cases was aimed at describing and validate an adapted SERVQUAL instrument to measure the provision of information to producers. SERVQUAL was identified as a relevant, service-evaluation instrument, however, it was noted that the standard instrument did not cater specifically for the measurement of the provision of information [15].
Table 1 presents a summary of studies performed in Africa using the SERVQUAL methodology. Further analysis was given to the dimensions explored, as well as the methodology, main objective, location, and sample.
2.5.2. America
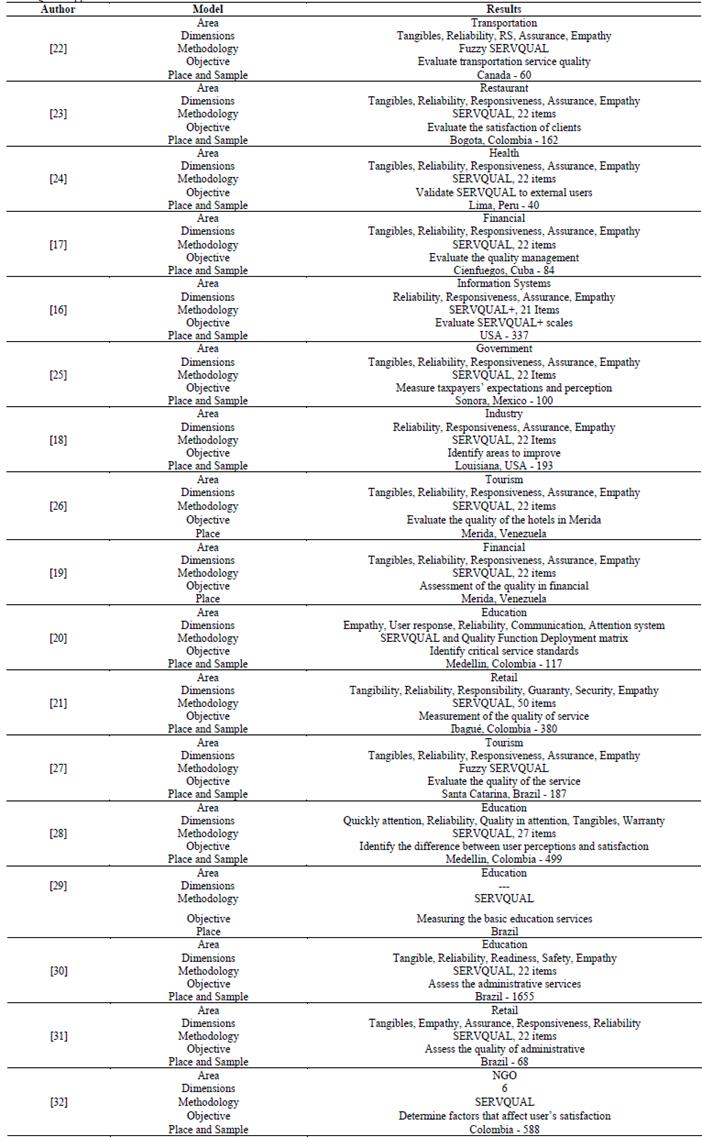
Research [16] provides a reassessment of IS service quality instruments that are based on the “SERVQUAL+” instrument proposed in marketing, which incorporates dual expectation measures. In particular, a comparison of the instruments “SERVQUAL+” and “IS-adapted SERVQUAL+” was reviewed. In the case of bank services, the perceived quality assessment was measured by 22 items in a SERVQUAL questionnaire. Results showed that customer perceptions did not exceed expectations, and gaps with lower quality index were related to service time [17].
In the American industry, the study examined the SERVQUAL measurement in the IS context. The relationship of SERVQUAL to the traditional UIS measure was examined. This was accomplished by administering both the UIS and SERVQUAL instruments to the same sample of IS users and then deriving unique dimensions of SERVQUAL [18].
In Venezuela, it was found that respondents showed high levels of expectations for most of the items associated with each of the dimensions of quality of service. However, attributes regarding reliability and accountability reported low perceptions. These levels are independent of the type of agency providing the service [19].
Another study showed the most important quality service requirements for users of the Central Library at University of Antioquia, in a decreasing order of importance by dimension: empathy, user response, reliability, communication, and systematic attention [20].
Service quality and customers’ satisfaction must be aligned with suppliers of products and services policies, since decisions made by the management of big stores are based on that. Results of the last study in America have very important applications to stores in order to redefine competitive strategies, by assessing their activities and as a starting point for the required improvements [21].
As shown in Table 2, a summary of studies performed in America using the SERVQUAL methodology. Further analysis was given to the dimensions explored, as well as the methodology, main objective, location, and sample.
2.5.3. Asia and Oceania
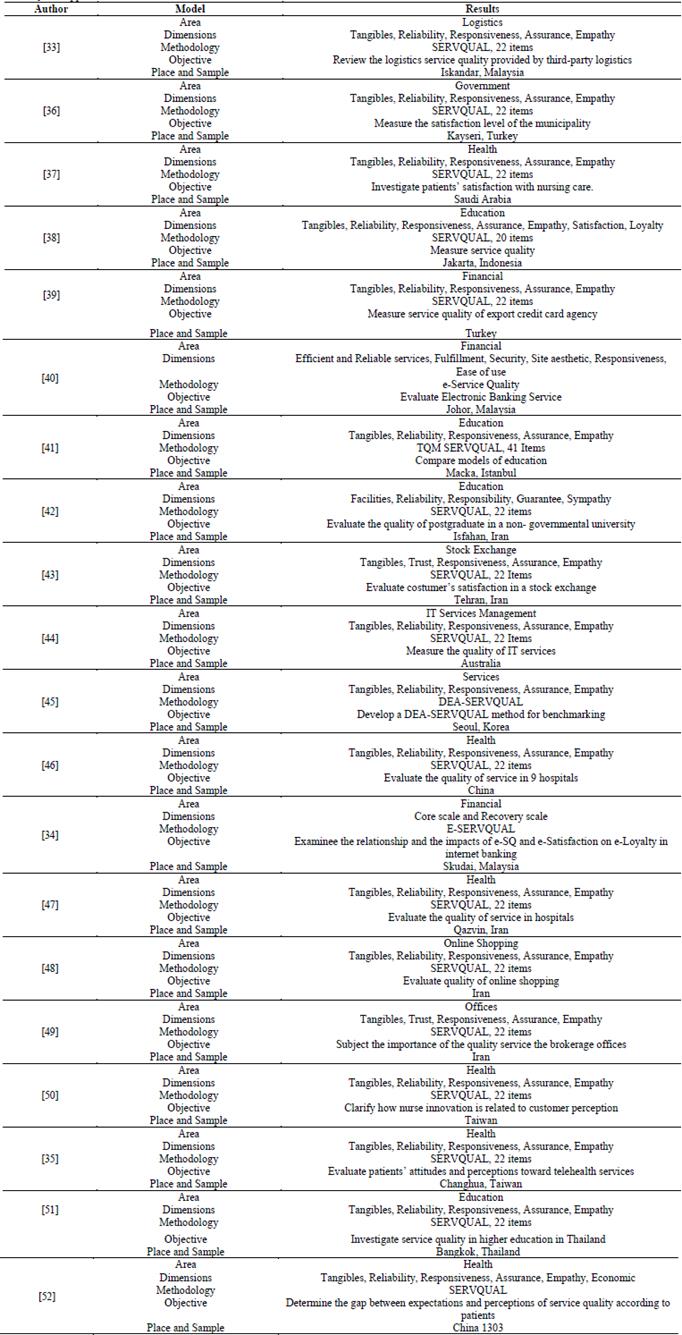
Every day, health studies are improving quality of life. The first study reviewed shows that the scores for patient expectations regarding nursing care exceeded the scores for the perception of the actual care provided in all dimensions, particularly in the items for responsiveness and reliability of nursing services.
The second study is aimed at identifying gaps between customers’ satisfaction and desires, as well as at identifying the relationship between customers’ satisfaction and service quality offered by the logistics service providers in Iskandar, Malaysia [33]. Another study examined the relationship and the impacts of e-SQ and e-Satisfaction on e-Loyalty on Internet banking. The findings indicated that assurance-fulfillment, efficiency-system availability; privacy, contact-responsiveness, and website aesthetics and guide constitute e-SQ on Internet banking services [34].
The last study combines a service quality model and an importance-performance analysis to evaluate telehealth services provided by a case hospital. The results showed six items categorized as major weaknesses, which should have been immediately addressed to reduce the patients’ complaints. In contrast to the determined weaknesses, there were seven items categorized as major strengths, which should have been maintained to provide a telehealth service of excellence and to establish better and longer relationships with patients in the long-term perspectives [35].
The applied studies in Asia and Oceanian are shown in Table 3; using the SERVQUAL methodology. Further analysis was given to the dimensions explored, as well as the methodology, main objective, location, and sample.
2.5.4. Europe
SERVQUAL relevance for service firms is unquestionable. However, as a general model, it is always interesting to discuss its applicability to specific service environments. This was the aim of a research focusing on Portuguese restaurants [53].
A different article presents the results of a SERVQUAL analysis on the quality of graduates’ suitability for the labor market in Poland. The approach links knowledge about the effects of education with information about the educational process and its elements [54]
The last case attempts to bridge the traditional mismatch between priorities of local transit operators and end-users in urban bus transport that are currently undergoing in the chronically underdeveloped Italian market. It shows the importance of looking for new ways to manage public transportation systems [55].
Table 4 presents a summary of studies performed in Europe using the SERVQUAL methodology. Further analysis was given to the dimensions explored, as well as the methodology, main objective, location, and sample.
3. Methodology
3.1. Subject and location
The public transportation system in the city of Morelia includes 14 routes. This research was carried out from January to March, 2018. To participate in this study, respondents were requested to be residents in Morelia and older than 15 years.
3.2. Application
This study consisted of two parts and the procedure for data collection consisted of two parts:
3.3 Sample and sampling
The sampling method was non-probabilistic. The sample size calculated was 384 cases. However, that number was increased to 392 cases, so each route would have a total of 28 cases to answer the questionnaire of perception and expectations.
3.4. Model
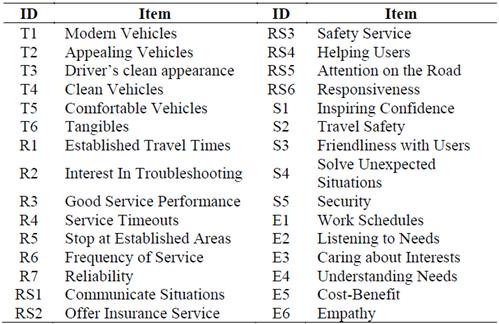
Table 5 shows the applied model, which is an adaptation of the SERVQUAL model, consisting of 6 variables and 24 items.
4. Results
4.1. Generalities
There are 14 routes of public transportation in Morelia, divided into several sub-routes. All the aspects regarding of the set of studied routes will be discussed in this part. In terms of gender, out of the 784 cases studied, 54% were female, compared to 46% male. Respondents 21 to 30 years old accounted for 46% of the population. According to occupation, 57% were students, 21% employees, 9% housewives and 12% others. As for frequency of use, 51% of the users said that they only use the service once or twice a day, which means that they do a round trip. The following data were the most relevant in the system:
Concerning to gender, there is a parity between male and female, with a difference of 1 (one) percentage point.
The maximum level of study, most users are either at a high school or university level.
According to the obtained data, most users are in an age range of 21 to 30 years, representing about 50% of the cases analyzed.
Frequency of use, most users only use the service once or twice a day.
4.2. Mean Comparison
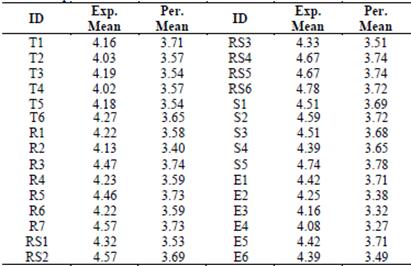
The first part to assess the quality of the service offered by the public transport routes is to analyze the mean obtained in each of the items and variables. Table 6 compares the results for both types of surveys, expectations, and perceptions, established as follows:
4.3. GAPS
Gaps can be defined as the difference between the average of service perceptions of a person minus the average of service expectations the same person has. Each of the five variables identified will be discussed, which will serve as criteria for users to evaluate the quality of service.
Fig. 1 shows the gaps in quality. Quality vehicles are those whose gap is closest to 0, which represents greater compliance with users’ expectations about the delivery of the service provided.
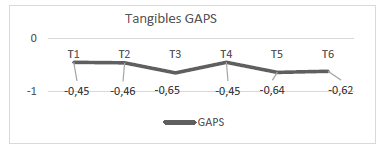
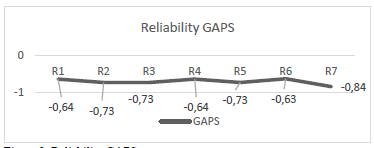
Fig. 2 shows the gaps in reliability, all the items of this variable have a gap higher than 0.6, which proves the high difference between consumers’ perception and the expectation.
In Fig. 3, the gaps for the Responsiveness variable are shown. The most important criterion is RS4, which represents an essential activity in the provision of public transport, and it is one of the largest gaps, corresponding to -0.93. Also, RS5 shows that drivers do not pay attention to the road, for several causes, such as answering the phone, eating while driving, or getting distracted while talking to others.
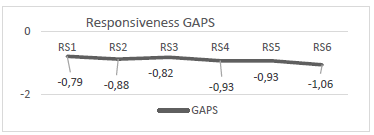
Fig. 4 corresponds to Security gaps. It was found here that the gaps do not exceed -1, being S4 the lowest. These results mean that users’ expectations far outweigh their perceptions, since none of the variables had a positive result, demonstrating that there is a great deficiency in service quality.
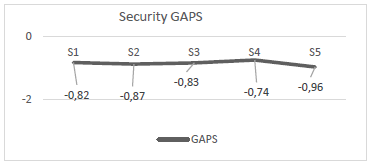
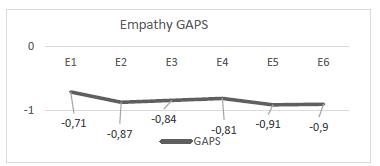
Fig. 5, shows the gaps in empathy. All the results have a high gap, between -0.7 and -0.9, this is the worst-ranked variable, and one of the most important to enhance quality service.
5. Discussion and conclusions
The purpose of the study was to evaluate the perceived quality of the public transportation system of city of Morelia, Mexico, with the application of the original SERVQUAL model that consists of both users’ expectations and perceptions. Findings show medium level of perceived quality and a high gap between the expected and the received service. Additional valuable results were obtained after analyzing the collected data. To begin with, users’ expectations are very distant from perceptions, for all the variables and in all the routes. Findings show gaps in quality of service, and none of the factors reached the maximum assessment punctuation 5, nor the minimum 1. Each of the criteria used for the evaluation of quality represents an area of opportunity for associations responsible for public transportation in Morelia. Twenty-five areas susceptible of being improved were detected, so it is important to invest in quality in order to generate profitable relationships with customers by enhancing the level of service organizations, which in turn will lead to monetary benefits. The concept of quality has been taken up as a standard for providing high quality services. Nowadays, there is an increasing number of organizations managing quality address their efforts towards customer satisfaction. Unfortunately, the associations responsible for providing public transportation in Morelia have not reached that point yet, and in fact, it seems that many of them only have their own interests in mind.
The review of international literature on the SERVQUAL model shows different applications according to different kind of services. After applying the model to the transportation sector in Morelia, the authors agree that the principal variables are: Tangibility, Reliability, Responsiveness, Assurance, Empathy, and Safety. Nonetheless, other variables can be included or excluded, according to the subject of study and the purpose of the research. It is important to highlight that the results of the study might be different if the collected data are analyzed according to each route of the transportation system, since each route is independently organized and its associates decide unilaterally modifications to the service. Further research on this area needs to focus on particular routes, which will also require further analysis and reflection on the legal aspects of this business model.
To conclude, the mobility of the population, as a social need, is one of the most important factors to the development by city mayors. Integrating the social factors that allow the productive use of resources is essential for achieving the common good of the entire population. Moreover, an effective public transportation system could catalyze economic and social development. This is the main reason why the service delivered by the public transport in Morelia must be improved.

