


 Inglês (pdf)
 Artigo em XML
 Referências do artigo
 Enviar este artigo por email
 Citado por SciELO
  Citado por Google
  Similares em
SciELO
Similares em
SciELO  Similares em Google
 Permalink
1. Introduction
This article focuses on the development of a clustering method to deal with variables having ipsative scales, in order to create profiles for a group of people based on their motivational preferences. The obtained results show that the proposed method provides better performance when compared to the PAM (Partitioning Around Medoids) method.
The structure of this article is as follows: this section presents a description of the problem. Section 2 describes the developed algorithm and the PAM method. Section 3 compares the results for each algorithm. Finally, Section 4 presents the most relevant conclusions and proposes lines for future research.
Psychological tests were applied to generate motivational profiles using categorical variables with ipsative scales for individuals to order, based on their preferences, the statements presented as options [1,2]. In individual analyses, this type of test allows collecting relevant information from the analyzed person. However, for this generation, the denomination of the variables makes the interpretation of the data difficult [3].
Clustering refers to the classification (grouping) of objects with the objective of generating homogeneous groups within and heterogeneous between groups. This means that the objects of a particular set differ considerably from the objects classified in other groups. According to Xu and Wunsch II [4], clustering is an important explanatory tool for professionals since it allows us to discover a number of hidden structures, generally valuable, in the data sets. Currently, areas such as social sciences, biology, computer science, image analysis, finance, marketing, and engineering widely use this technique.
The majority of clustering techniques have focused on the analysis of continuous numerical data and are based on parameter estimation and the selection of elements for each cluster, exploiting distance metrics [5]. Examples of these methods can be partition or hierarchical [6] and based on density, meshes, or on a combination of these. On the other hand, a lesser extent clustering method has been developed for categorical or ordinal data [7,8]. By their very nature, categorical attributed data can rarely be evaluated with the usual distance metrics for continuous data [9]; therefore, it is necessary to develop adequate methods for the correct analysis of these type of data.
A particular example of categorical data is ordinal data [10], which occur when labels obey a hierarchy. These type of data are obtained through surveys in which individuals answer questions of a motivational, satisfaction or preferential nature [5]. Commonly, ordinal data are transformed into quantitative data and analyzed through conventional clustering methods [10] or analyzed as nominal categorical data [11]. However, this could lead to erroneous results or incorrect interpretations [7].
The study of ordinal data can reveal heterogeneity due to, for example, different political tendencies, economic strategies, human preferences, amongst others [5]. That is why these heterogeneous classifications have attracted considerable interest since the last decade. An example of the above is presented in Murphy and Martin [12], in which a mixed model based on distance is considered and validated on a model of a data set of the 1980 presidential elections of the American Psychological Association (APA) [13]. On the other hand, Busse et al. [14] adapted these models to consider tied and partial classifications. Later, Lee and Yu [15] considered a weighted version of this family of mixed models with applications in political studies. Mixtures of multi-stage models [16] and the mix of Plackett-Luce models have also been successfully applied to the grouping of Irish election data and university admission data [17-19]. If the mixture of multistage models leads to an interesting adaptation power, the mixture of distance-based models has a smaller number of parameters and lower p-values in general (greater significance); it is also simple to be implemented [12].
Giordan and Diana [7] proposed a specific method for grouping based on ordinal data. They base their method on the use of a multinomial model, complemented with a clustering tree and a pruning strategy. For their grouping process, they use a contingency table, in which they group the relative frequencies of the responses. Then, they define a threshold (values between 0 and 1) that they use for the identification of the cells with higher frequencies, which are grouped with the adjacent cells that also exceed the threshold. This method also allows determining the number of clusters to be made. They successfully applied it to a bivariate example and, although they show results for a simple multivariate example, it is not clearly shown how it can be extended for this latter case.
Subsequently, Jacques and Biernacki [5] conducted a study of clustering mechanisms for ordinal data by adapting Thurstone models [20]. They base their method on the development of probability distributions for the data, the identification of a position and the precision parameters for these. In 2016, the same authors carried out the procedure extension for the multivariate data consideration under the assumption of conditional independence. For this extension, they considered a probabilistic model based on binary, ordinal search, and maximum likelihood parameters. This method showed its effectiveness in comparison with traditional clustering methods (multinomial and Gaussian).
On the other hand, commonly used clustering methods are designed to handle numerical variables, and, therefore, one of the assumptions of these methods is that there is an underlying metric. Among the most used methods is K-Means [21], in which, when selecting a number of clusters to build the algorithm, it begins to estimate the initial centers to group the remaining objects; this method uses the Euclidean distance [22]. Another method is K-Medoids. Although it is based on K-means, this method has its focus on an object chosen within each cluster, in which the average dissimilarity between it and all the other members of the cluster is minimal. This is a more robust alternative to the K-Means grouping, which implies that the algorithm is less sensitive to noise and outliers [23].
Lastly is CLARA - Clustering Large Applications. This method considers a sample of the data with a fixed size where an optimal set of centroids for the sample is sought. Its objective is to reach the minimum dissimilarity resulting in groupings with a set of centroids of minimum cost [23].
A review of the literature found that there is no method properly designed to handle variables with ipsative scales. However, since one of the characteristics of these variables is that they are classified in an ordinal manner, a review of the most used ordinal methods was investigated to evaluate the state-of-the-art.
Unlike the ordinal data considered by other studies, this work uses ipsative scales. This type of scale arises when, instead of assigning an independent score to each feature (variable), we have to place a group of variables in a hierarchical and excluding order. Therefore, the place occupied by the first feature will restrict the possible places for the remaining traits. Ordered subsequent traits will result in a similar situation. Given the characteristics of the data obtained through the survey, this work considers variables to be analyzed as ipsatives. Considering the above, it is observed that the commonly applied methods for clustering can be used in variables that handle ipsative scales but they do not consider that ipsative variables of k categories generate a non-independent k-dimensional array. For this reason, the purpose of this paper is to propose a new method for grouping individuals who have been measured with a set of ipsative variables.
2. Clustering methods for variables with ipsative scales
In this section, we present the method developed in the investigation. Subsection 2.1 is devoted to describe the proposed method based on the definition of the problem, while subsection 2.2 presents some elements of the PAM method, a classical method applied to variables with similar characteristics.
2.1. Proposed clustering method for variables with ipsative scales
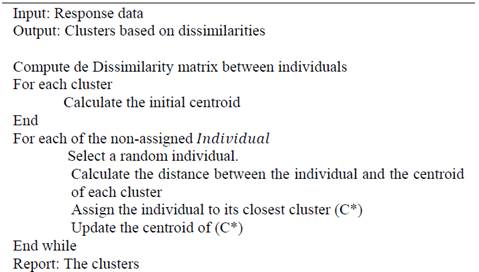
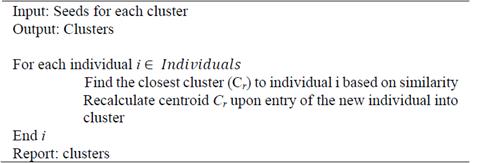
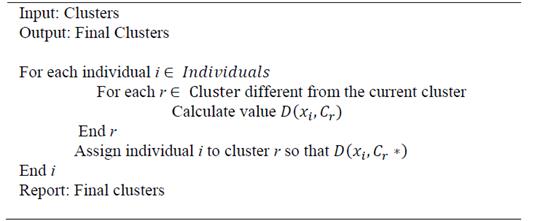
The proposed method is designed in two phases: the first consists of grouping individuals into clusters and running a specific number of times (which may vary depending on the number of the clusters the researcher has in mind) in order to calculate and determine the optimal number of clusters in the second phase. As a result, an iterated greedy algorithm with local search is obtained. Fig. 1 depicts the pseudocode of the proposed IG-LS clustering algorithm.
The gathered data consists of N items about the evaluated preferences with a categorical value (ranging from 1 to n) as an answer (values that correspond to importance index). From this, it is deduced when each of these items is added. The result can be assumed as an embodiment of a multinomial distribution, i.e., X~Multinomial (π_1,π_2,…π_n ). The workspace is the discrete set {1, .., n} and requires a method that considers these characteristics. The metric proposed below is based on the Sorensen dissimilarity [24], which is constructed from a set of indicator variables. That is, observing two individuals x 1, x 2 and of the distance or dissimilarity between them (D) can be quantified by the number of responses in which they do not coincide. This formalization is presented in two steps in order to show that the proposed dissimilarity function complies with the definition of distance in mathematical terms. The first step shows an item-item distance and then presents the proposed function.
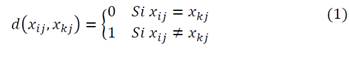
Distance between individuals: These are calculated based on the number of dissimilarities in the responses given by the individuals for every item j [25]. Given set 𝐵={1,2,3,4,5} and assuming that the responses between two individuals (i and k) are observed to the j-th item, that is, 𝑥𝑖j,𝑥kj. ∈𝐵. The dissimilarity function 𝑑(⋅,⋅) for the j-th item, of 𝐵×𝐵→ℝ, is defined as:
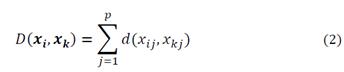
This definition can be taken to a p-dimensional space, where p represents the number of responses per individual, as follows.
The distance determines the degree of discrepancy between each pair of individuals when working with variables of ipsative scales; it indicates if that pair of individuals has or not the same perception in each attribute evaluated.
Definition (Metric for a discrete vector): Let 𝑀=𝐵𝑝, where p represents the number of characteristics or observed variables (one for each response), and let
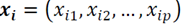 and
and
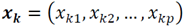 with 𝒙𝒊,𝒙𝒌 the function of distance over M, D(.,.) be defined as:
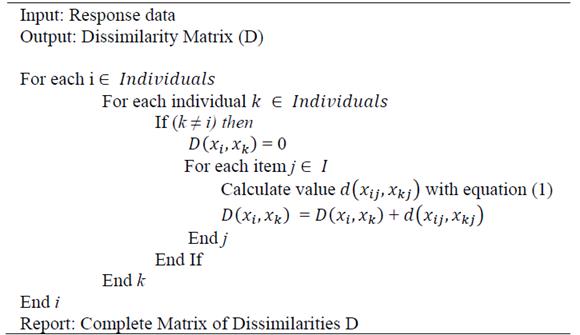
With d(.,.) given in Equation (1). For case p=1 D(.,.) = d(.,.)The definition in (2) is a value in R. It is the count of non-coincidences and its properties are derived from the metric defined in Equation (1). Fig. 2 presents the pseudo-code of this part of the proposed method.
Clustering process: The proposed clustering (grouping) process is presented in four stages. The first stage identifies the initial centroids of each group (seeds). The second stage assigns the non-clustered individuals to each of the groups. The third stage updates the centroid of each group. Finally, an improvement procedure is applied in pursuit of refining the initial clustering. This is done assuming that: (a) We have a sample 𝑚={𝒙1,𝒙2,…,𝒙𝑛} of individuals observed in M, and (b) we want to perform k differentiated groups.
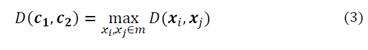
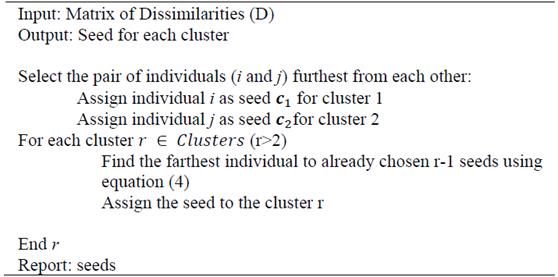
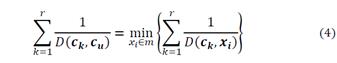
Stage 1. Seed Selection: The first two seeds c 1 y c 2 are identified (meaning that c represents the individual chosen as seed) so that:
Similarly, the other initial centroids C r, r=3…k,, are found. That is, the first initial r-centers (seeds) are identified; the initial r + 1-th center is the vector c u ∈ m such that:
For each individual, the inverse of the distance to each of the previous centroids is calculated. Subsequently, all of these inverses are added and finally, they are ordered in an increasing order based on the value of the sum. The individual with the smallest value is chosen as the next centroid.Fig. 3 presents the pseudo-code for selecting the seeds.
Stage 2. Assignment of Remaining Individuals to a Cluster: The group assignment, for each of the points (data) that was not chosen as seeds, is done following these rules: (a) 𝑔1,𝑔2,…,𝑔𝑘 denotes groups, and 𝐶1,𝐶2,…,𝐶𝑘 denotes their respective centroids (b) The individual 𝒙ℎ ∈ 𝑚 is assigned to group 𝑔u if:
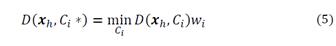
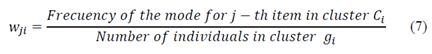
Where w i and C i * correspond to the vector of weights (of the centroid C i) and the centroid of the closest cluster. The following stage will describe the weight’s estimation mechanism (Fig. 4).
Stage 3. Definition of Centroids: The importance of defining a centroid lies in the fact that you do not have a continuous space. Therefore, speaking of the average individual can lead to vectors that do not exist in the population. Thus, the preferences of each individual in the cluster will give the reference vector.
Centroid definition: Given a cloud of points {𝒙1𝑗,𝒙2𝑗,…,𝒙𝑛} ∈ 𝑀𝑛 centroids Ci are defined as follows based on the scale of measurement of the variables to be analyzed:
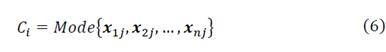
The mode is calculated component by component. When working component by component, several modes can be obtained, i.e., several points with the same frequency. The lexicographic order will determine the mode to be considered. For the case in which each cluster has only one individual, the mode for each attribute corresponds to the value of the item.
In order to avoid having ties, the corresponding weights (for the centroids) are calculated in the following way:
Stage 4. Improvement Phase: Given that the centroid is recalculated as individuals enter each group at the end of the assignment, the distance of each individual to the final centroid of the located group is verified to evaluate if they were assigned correctly. The algorithm takes the individuals that are furthest away from the final centroid of their group and compares to the final centroids of the other groups. If a smaller distance is obtained in a different group, the individual is reallocated to its nearest group. Fig. 5 shows the pseudo-code for this procedure.
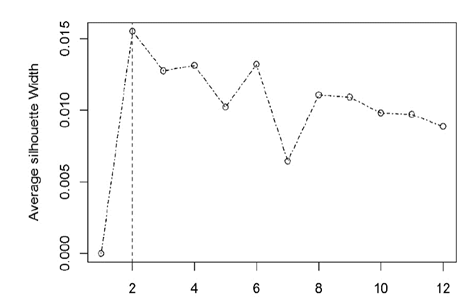
Determination of the Optimal Number of Groups - Silhouette: The second phase of the proposed algorithm is to parameterize the number of groups or clusters to be generated. For this, the algorithm is previously run to determine the data set in k groups, 𝑔1,𝑔2,…,𝑔𝑘, for each individual observation 𝑖 ∈ 𝑔𝑗, in order to identify the optimal number of clusters that must be calculated. These results can be defined in the following measurements, 𝑎(𝑖)≔ Median value of the dissimilarities with the elements in the cluster 𝑔𝑗 , i.e., the average dissimilarity of i with the observations of the assigned group. 𝑞(𝑗)≔ Median value of the dissimilarities with the elements in the cluster 𝑔𝑗≠𝑔𝑢 (i.e., the average dissimilarity of i with the observations of a cluster 𝑔𝑗 to which it does not belong).
Finally, let
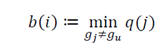
From the previous definitions, it is possible to define a measurement of belonging for observation 𝑖 to group 𝑔u, as follows
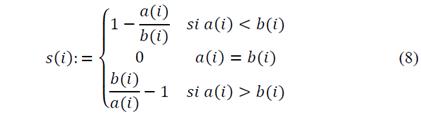
This equation may be re-written as:
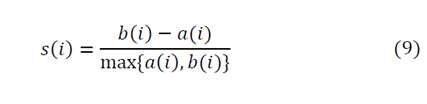
From equation (8), it can be observed that the values of s(i) go from −1≤𝑠(𝑖)≤1. Hypothesizing extreme situations, we find that 𝑠(𝑖)≈1 implying small values for 𝑎(𝑖) with respect to 𝑏(𝑖);;therefore, we can conclude that observation i is well located. It is in the appropriate cluster. The contrary situation, in which 𝑠(𝑖)≈−1,, indicates that the observation has been assigned to a group where it does not belong. Values close to zero indicate that the observation is located between two clusters.
As previously mentioned, the mean value of s(i) for all the observations of a specific group is the goodness of fit measurement which allows knowing if the observations in a group are well assigned. Following this reasoning, we can use the mean for all the observations varying the number of groups and the k+ value, for which the maximum is possibly the optimal number of clusters [26].
2.2. PAM (partitioning around medoids)
A comparison with the PAM method is carried out since this is a classical and widely recognized grouping method. It allows clustering from quantitative or qualitative variables, or from a mixture of both.
Following Kaufman and Rousseeuw [23], the PAM method can be synthesized into two steps, assuming that k groups are desired,
Select k individuals from the sample. Individuals that represent various aspects of information are called medoids. The most usual choice is to take the most distant individuals.
Assign a group to other individuals. Each individual that was not chosen as a medoid in the previous step is assigned to the group, whose representative is the closest to the individual.
In the PAM method, we start with a dissimilarity matrix or a distance matrix; the best-known distances are the Euclidean distance and Manhattan distance. The first is used for quantitative variables [27] and the second can be used for ordinal categorical variables. A third distance used is the Gower distance which allows obtaining a distance matrix for a mixture of quantitative and qualitative variables. The analysis carried out within PAM in the present work used the Manhattan distance, given that ipsative variables generate an order of preference.
3. Experimental results
3.1. Case study
To validate the effectiveness of the proposed method, it was implemented in the segmentation of a group of students from the city of Guadalajara, in Mexico. To collect the information, a survey was applied on motivational predilections. The instrument consisted of 15 questions about work preferences that allow identifying the type of motivational profile. For each question, individuals must order five answers from the most to least important. In this case, each question is considered as a variable and each of the five positions, where the answers are placed, corresponds to an item. Each question is associated with a variable, and each item is classified according to a level of preference and associated with a particular variable.
The selection of the sample is non-probabilistic; the selection criteria were: (1) to have been born between 1981 and 1995 and (2) to be working or have worked at some point in their life. 209 surveys were conducted in Guadalajara, Jalisco, Mexico and after debugging the database based on the inclusion criteria, a sample of 197 individuals was consolidated.
The results presented in this section reflect a first approach to the handling of the methods with data of ipsative scales. For this particular case with millennials in Guadalajara, the following subsections present the results obtained by both methods.
3.2. Proposed method
To start with the data analysis, the number of optimal groups to use was calculated. Fig. 6 indicates that the optimal number of clusters is two.
Subsequently, the clustering was carried out considering the 75 items of the instrument. For the analysis, these were grouped by adding the five corresponding items to each variable, thus completing the 15 variables that demonstrate what factors influence the motivation of workers [28].
3.3. Comparison of methods
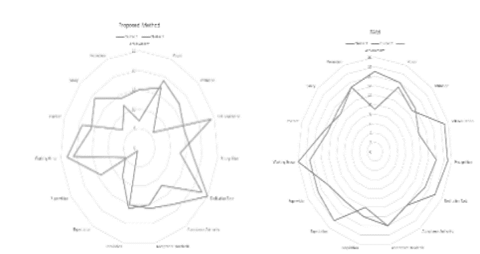
Fig. 7 reports the results for each variable using the values of the final centroids. From the comparison of the two graphical representations, it is evidenced that, conceptually, the proposed method has differentiating characteristics in each cluster, while PAM assumes similar values for the variables. Expectation, supervision, salary, promotion, and acceptance of the norms are the variables in which the most different values are observed between each method, while, in variables such as self-realization, dedication to the task, acceptance of authority, working group, content, and power, similar values are maintained.
Source: The Authors.
Figure 7 Comparison of characteristics of clusters between the proposed method and PAM.
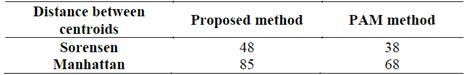
Another way to compare the quality of the grouping for the two methods is to compare the distance between the centroids of the clusters. What is desired is the distance, regardless of the used method (binary distance or Manhattan), to be as large as possible. However, since the used measurement units for each are different, it is not possible to directly compare them. To have a reasonable comparison, the distance between the centroids of the clusters was considered.
In Table 1, it is possible to observe that, through our method, both clusters are more differentiated providing a greater distance independently of the measure used. Additionally, it was investigated how unbalanced the clusters were in terms of the difference in the number of individuals in each one. Table 2 shows the obtained results.
Table 1 Comparison of distance between centroids in proposed method and PAM method.
Source: The Authors.
Table 2 Difference between the number of individuals per cluster between the proposed method and the PAM method.

Source: The Authors.
It is possible to observe that, on average, the proposed method generates more differentiated clusters. Additionally, it is evidenced that, conceptually, the proposed method better compacts the generated values in each of the variables depending on the cluster since it produces a lower average dispersion. To validate the effectiveness of the proposed method, clustering validation indicators are used to compare the performance of both approaches.
3.4. Clustering validation
There are different types of validation measures; for this investigation, internal validation measures were used. To perform the calculations, this type of measurement uses intra-cluster and inter-cluster distances to obtain measures of compactness and separation [29].
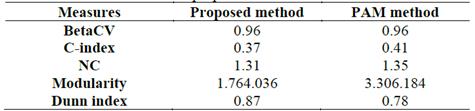
The indicators used are shown in Table 3. The BetaCV in the first row measures the grouping through the intra-clusters distances. The smaller its value, the better the clustering. For this exercise, both methods obtained the same value. Regarding the C index, a lower value indicates more compact clusters with relatively smaller distances. For this index, the proposed method has a better performance. With respect to the normalized cut measure (NC) is good when its value is as small as possible, since it reflects a good clustering. In this case, the proposed method shows a better result. Next the modularity index is compared. This measure assesses the difference between the observed and expected fraction of weights on edges within the clusters. Comparing the two methods, it is observed that the distances within the clusters of the proposed method are lower than expected. Finally, the Dunn index is compared. A larger value indicates better clustering, since it means even the closest distance between points in different clusters is much greater than the farthest distance between points in the same cluster. This index shows that the proposed method generates better results.
Extensive Computational Experience: To evaluate (validate) the efficiency of the proposed model (and considering the limitation of methods for dealing with ipsative variables), extensive computational experimentation is performed that consists in generating simulated scenarios by randomly clustering individuals and comparing the obtained metrics for the grouping/dispersion against the metrics achieved by the model. In this case, we respect the case of generating only two clusters.
The random clustering procedure consists of the following steps: (1) randomly select an individual; (2) assign the selected individual to one of the clusters. These steps are repeated until all of the individuals have been assigned to clusters. Finally, the values for BetaCV, C-index, NC and Dunn index are calculated. It is important to remark that the modularity index is no longer computed because, in the case of having only two customers, the value is always the same.
Using the random clustering procedure, one thousand scenarios were generated. In other words, for each scenario, the number of individuals (and the individuals) belonging to each cluster is different. As is to be understood, in each scenario the number of individuals in each cluster is different, considering that, if the grouping had been done by some method different from the two previously discussed, the number of individuals per cluster could be different as well. To facilitate the analysis, a summarized report is presented by indicating the minimum, maximum and median values (over all of the simulations) of each of the calculated indices. These results are displayed in Table 4.
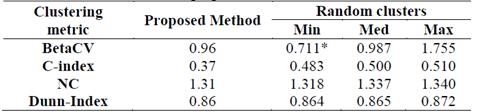
In this table, the first column indicates the name of the index reported, while the second column indicates the values obtained by the proposed method for these indexes. Columns 3, 4 and 5, report the minimum, average and maximum values obtained on the random clustering procedure.
When comparing the proposed method with the random clusters it is observed that only for the BetaCV a better result was obtained (in the minimum) through the mechanism of random clusters (indicated with the symbol *), however, when reviewing the value in the median and maximum, these are above the proposed method. Regarding the other indicators, it is evident that the proposed method outperforms all of the random clusters. This means that the method generates an appropriate grouping for the case under study.
In particular, the percentage of improvement that the proposed method can have over the randomized scenarios is up to 30% (C-index). This confirms the fact that the proposed method generates more compact groups with relatively small distances.
4. Conclusions
This paper analyzed the problem of clustering with ipsative variables and proposed a method based on Sorensen dissimilarity distances. The contribution of the proposed method is the construction of an "individual type" (centroid) with the characteristics of the cluster that may not be present in the selected sample but present in the population. Therefore, it does not fictitiously limit the characteristics of a group because it is not linked exclusively to the people in the sample.
On the other hand, it can be graphically observed that there is a large difference between both methods in grouping and obtaining the values considered for each variable. First, it is evident that most scores obtained by variables are inverses. It could indicate that segmentation by characteristics is proper, while in the PAM method, the characteristics of the two presented clusters handle similar values. A clear difference between the two methods is the way in which centroids are selected. In the proposed method, a seed (individual of the sample) is first determined as an initial centroid and, as individuals are integrated into the cluster, the centroid is recalculated; while in PAM, medoids (centroids) are chosen from the individuals of the sample and remain fixed.
Considering the above, it can be concluded that the clustering generated by the proposed method better identifies the characteristics of conceptual segmentation, while the second does not completely differentiate segmentation by distinguishing variables. Additionally, after performing mathematical analysis of the distances, the proposed method separates better the centroids of the generated clusters.
Finally, clustering validation measures were used to evaluate the effectiveness of both approaches. In general terms, the proposed method outperforms the existing method that can deal with ipsative variables. In addition, the results can be used to characterize groups of people in the organization. Future research lines involve using these results to design customized portfolios of incentives that better fit each profile. Another research consists of using the obtained information to predict the performance (for instance, in terms of productivity) of a particular group of people.

