


 Inglês (pdf)
 Artigo em XML
 Referências do artigo
 Enviar este artigo por email
 Citado por SciELO
  Citado por Google
  Similares em
SciELO
Similares em
SciELO  Similares em Google
 Permalink
1. Introduction
At present, projections of different hydrometeorological variables have been created worldwide using General Circulation Models (GCMs), a tool that allows the future behavior of variables such as precipitation and temperature to be examined in order to gain a better understanding of Climate Change (CC) and its after-effects in the near and distant future [1,2]. However, despite the practical uses of low-resolution projections, researchers have been working on developing downscaled models that provide regional and local analysis of hydrometeorological variables [3-5].
The downscaling of the GCMs and their respective projections is carried out using statistical and dynamic modeling [6,7]. As such, statistical downscaling has gained huge popularity, as, compared to the dynamic variety, it has a low computational cost and is simple to apply [8]. According to Jones et al. (2009) [9], it largely works by associating the hydro-climatic variables with the results of the GCMs, achieving high-quality results similar to those produced by dynamic downscaling.
In statistics, when compared with other regression techniques, automatic learning techniques like Artificial Neural Networks (ANNs) are more efficient and present more correlated values, due to their capacity for learning from the data and their use of computer algorithms [10]. Research has been carried out globally that involves ANNs in the downscaling of Climate Change scenarios, and these studies show this method to be adequate and with low computational cost [2,11,12].
In Colombia, the analysis of Climate Change precipitation scenarios has been mainly carried out at a national and departmental level [13-15]. According to pronouncements by IDEAM (2015) [13], the impact of CC on the country’s precipitation will vary in magnitude and duration depending on the department. The present study found that by 2100, Valle del Cauca will see a 6% average increase in precipitation, mainly in the Andean and Pacific regions. The various changes in the behavior of the distribution and magnitude of rains create environmental, social and economic conflicts, thus, studies should be encouraged not only on a national or departmental level, but also at a local level. This will allow for adaptation plans and projects to be created that avert climate vulnerability and risk in specific areas like river basins [16,17].
Precipitation is a hydrological component that is highly influential on the different activities carried out in river basins. In Valle del Cauca, studies on the spatial and temporal behavior of precipitations have been conducted in different river basins, where it has been found that the phenomena of climate variability and change influence different parts of the department in different ways. For example, the department’s Pacific region has shown to be more greatly affected compared to the Andean region, due to its proximity to the ocean. In another study, Cardona et al. (2014) [18] examined trends in two of Valle del Cauca’s Andean river basins (the Cali and the Dagua), and affirm that in recent years, these have seen an increase in precipitation, and that this has been recognized in the local news with reports of an increase in the number of flash floods and landslides in these basins over the last few years.
The Cali river basin is of great importance to the department of Valle del Cauca, as it provides different ecosystem services that contribute to the wellbeing of people living in the municipality of Santiago de Cali, including 20% of their fresh water provision [19]. Taking into account the current rainfall trends for the Cali river basin and the different problems associated with them, this study’s primary objective is to create a monthly precipitation prediction using the statistic downscaling method for climate change scenarios and posterior analysis to determine whether this trend will be upheld over time.
The present analysis of Climate Change precipitation scenarios employed historical monthly precipitation records from 35 meteorological stations from January 1972 to December 2016. Using this data, an estimation of the missing data was performed, and the GCM obtained from the Coupled Model Intercomparison Project version 5 (CMIP5) databases were downscaled.
2. Metodology
2.1. Study area
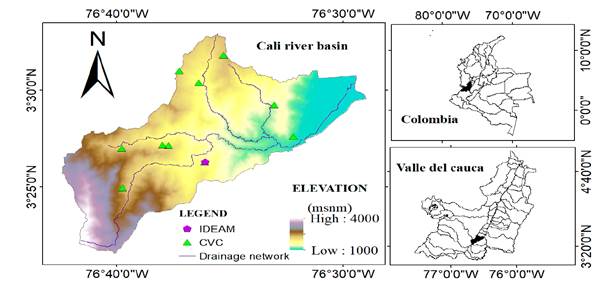
The Cali river basin is located in the department of Valle del Cauca (Fig. 1), and has an area of approximately 215 km2, with altitudes between 4000 mamsl and 1000 mamsl, and precipitation varying between 3600 and 1200 mm in the upper and lower regions respectively. Its main channel originates in the Farallones de Cali mountains and discharges into the river Cauca [19].
2.3. Data and analysis period
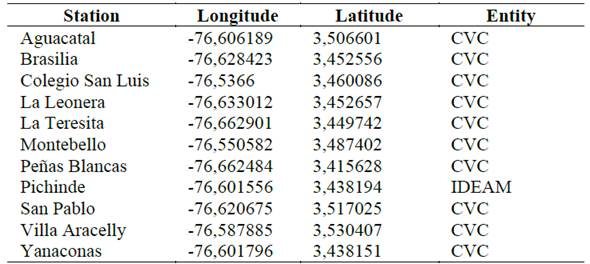
This study was conducted using monthly precipitation data from 35 meteorological stations. Of these, 11 are located within the river basin and the rest in the surrounding area (Fig. 1).
2.2. Methodological design
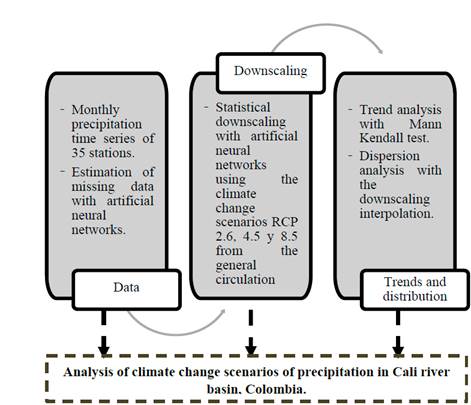
The analysis of future precipitation scenarios was conducted using artificial intelligence (Artificial Neural Networks), where initially a refinement of the missing values was developed and then a precipitation prediction was carried out by downscaling the Representative Concentration Pathway (RCP) scenarios of climate change models compiled from CMIP5. Similarly, interpolations were applied to two periods of projected values, the near future (2017-2059) and the distant future (2059-2100), and these were compared to the precipitation observed over the period 1972-2016. The distribution was examined by comparing the standard deviation of these periods of analysis. Finally, using the Mann Kendall non-parametric test, the future precipitation trends from 2005 to 2100 were analyzed (Fig. 2).
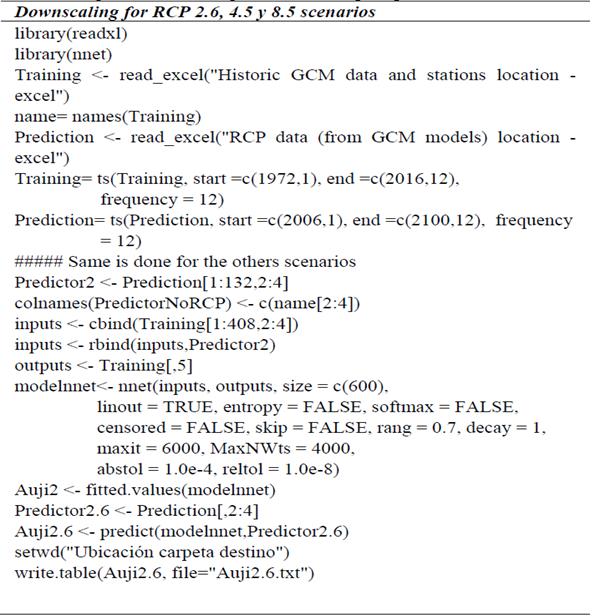
The period of analysis considered was from January 1972 to December 2016; a total of 540 months [20,21] (Table 1). Additionally, historical data was used alongside climate scenarios of the models CNRM-CM5, MPI-ESM-LR and MRI-CGCM3 from CMIP5, taking into account that these correlated more with the observed values of precipitation of the majority of the meteorological stations [22].
2.3.1. Estimation of missing data using artificial neural network
One of the greatest inconveniences when using the precipitation databases is the lack of or non-existence of some data, meaning that radial basis function networks (to use R programming language) had to be applied to process an estimate the missing data. This model achieves acceptable efficiencies for this type of processing, according to Nkuna and Odiyo, 2011 [23]. Initially, 8% of the data was missing, but the estimation managed to complete 100% of the information. It is important to note that, after applying this process, the dataset becomes continuous.
2.4. Downscaling
The downscaling of future precipitation scenarios consists in comparing a General Circulation Model (GCM) with actual local or regional data (precipitation values taken from the meteorological stations). In other words, the resolution of the GCM is increased with the aim of eliminating the existing bias and, in this way, concentrating the data to a local level [9,24]. The ANNs can be used for this method, thanks to their capacity for associating both input and output non-lineal variables [11]. First, the historical data and the future scenarios of the CNRM-CM5, MPI-ESM-LR and MRI-CGCM3 models downloaded from CMIP5 databases are obtained for the specific coordinates of each meteorological station. The neural network is trained using the historical databases and a monthly precipitation prediction is made using the scenarios. This process is shown in the diagram in Fig. 3.
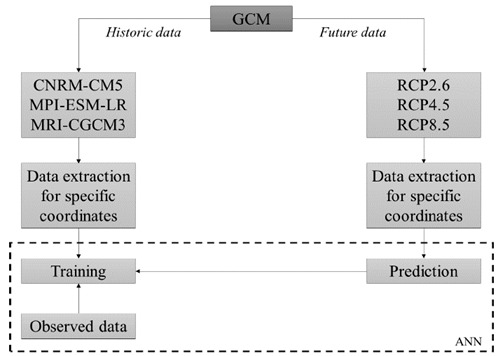
It is important to note that the downscaling process does not create precipitation forecasting; rather, it makes predictions based on the forecasts already established in the GCM described above for each of the RCP scenarios, with the goal of generating future information specific to each of the stations.
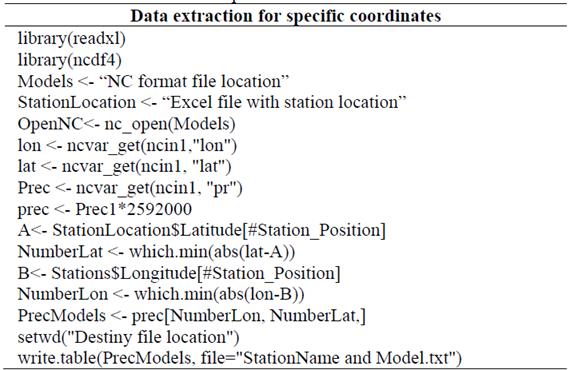
After downloading the historical and future data for the models described in Fig. 3 from the official Earth System Grid Federation (2018) [22] website, the data for the specific coordinates was extracted using the statistical software R using the script outlined in table 2, based on the NCdf4 package [25].
2.4.1. Artificial Neural Network
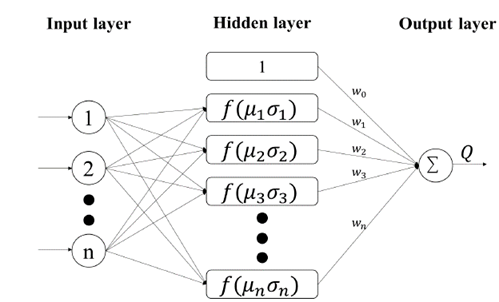
The ANN method is inspired by biological models and elaborates a series of mathematical models with a large number of elements that are organized in hierarchical levels [26,27]. An ANN is made up of neurons that are organized in layers and interconnected to each other. The neurons regularly have three or more layers (Input layer, Hidden layers and Output layer), and with this structure the said method can associate the input variables with the output variables and weight those that are most relevant [27].
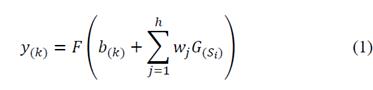
The downscaling was carried out using the “nnet” package. Venables and Ripley (2002) [28] explain that the ANN used in this package are of the Multilayer Perceptron variety, and as their name suggests, they are classified as having a multilayer topography, that is, the input units are distributed among the hidden layers where a constant or bias is added and they take on a fixed function (eq. 1) [29].
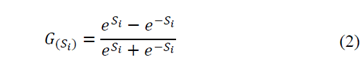
Where F represents the function activation of the output, w j corresponds to the weight of the connections between the hidden layers and b k is the bias or threshold value that is generated during processing. This applies when taking into account the lineal output j with a hidden layer with h nodes and G (Si) as the activation function of the hidden layer (hyperbolic tangent) as defined by eq. (2) [29].
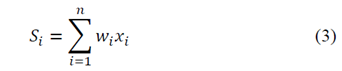
Where S i is the weighted sum of all the input information, x i corresponds to the values inputted into the network and w i is the weight of the connection between the nodes in the input layer and the hidden layer, as is described in eq. (3) [29].
Using the actual data and the information obtained from the 3 GCMs and their respective climate scenarios RCP 2.6, 4.5 and 8.5, the Multilayer Perceptron neural network was trained with data from January 1972 to December 2016. Additionally, 3 layers (input layer, hidden layer and output layer) were used in the network, with 600 neurons for the hidden layer with a tangent hyperbolic activation function and 6000 interactions. Subsequently, with this same network, the future precipitation from January 2017 to December 2100 was predicted, using the projected data of the above-mentioned GCMs and their scenarios. Fig. 4 shows the diagram of the procedure design, as well as the script that was used for its implementation in table 3, based on the R package “nnet” [30].
Where u represents the number of interactions, b corresponds to the bias and G is the hyperbolic tangent activation function.
2.5. Analysis of the trends and changes in the distribution of future precipitation.
An analysis of the future precipitation trends on a yearly basis was performed by applying the non-parametric Mann-Kendall test that can present a null hypothesis (H0) that indicates that no considerable trend exists or an alternative hypothesis (H1) that indicates that an increasing or decreasing trend exists.
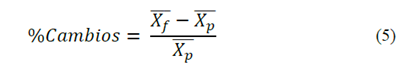
Additionally, for the distribution analysis, the historic total average annual precipitation (1972-2016) was compared with the same measurement for the near future (2017-2058) and the distant future (2059-2100), employing the percentage change analysis outlined in eq. (5).
Where
 represents the average future precipitation and
 is the average historic precipitation.
2.6. Interpolations
Interpolations of the spatial distribution of future precipitation data were attained, and the dispersion was compared with the historic precipitation using the Empirical Bayesian Kriging (EBK) method, employing the Geostatistical Analyst extension of the Arcmap10.3 software. This method uses eq. (6) as the foundation of its functionality [32].
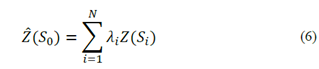
Where: 𝑍(𝑆𝑖) represents the median value in the location 𝑖, 𝜆𝑖 is an unknown weighting of the mean value for the location 𝑖, 𝑆0 corresponds to the location of the prediction and N is the quantity of mean values.
3. Results and discussion
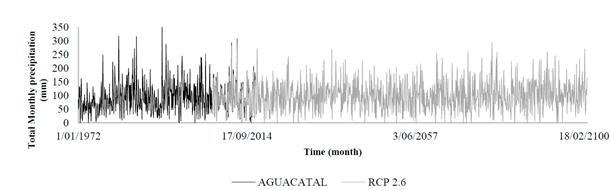
The statistic downscaling of the Climate Change precipitation scenarios using Artificial Intelligence models (Neuron Networks) managed to simulate the hydrological behavior of the different stations analyzed with an acceptable resolution. However, the results obtained establish that anomalous extreme large-scale events (heavy precipitation) are not adequately represented, as is the case of the Aguacatal station presented in Fig. 5.
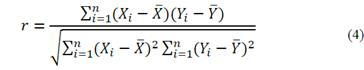
The validation of the training using the Pearson correlation test indicates that the correlations obtained in the different stations oscillate between 70% and 98%, which are results that align with the study carried out in La Guajira by Bernal et al. (2000) [5] where, in the calibration (training) phase, correlations of between 69% and 90% were achieved. Similarly, a study for Bangkok by Vu et al. (2016) [33] found a correlation of 80% for the training phase of their downscaling methodology for precipitation data.
Additionally, it was observed that the stations with less correlation to the GCMs are those that related least closely to the actual data.
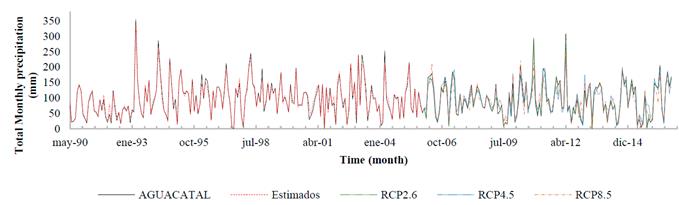
It should also be noted that the validation of the different Climate Change precipitation scenarios has an average correlation of 86.4% for the RCP8.5 scenario, 85.8% for RCP4.5 and 84.1% for RCP2.6. To demonstrate said distribution, fig. 6 presents the estimated and projected values for each scenario. The Aguacatal station reached a correlation of 95% for the training period (1972-2005) and 98% for the validation period (2005-2016) in conjunction with scenario RCP2.5 and 93% for scenarios RCP 4.5 and 8.5.
Source: The Authors.
Figure 6 Correlation of the artificial neural network training in MGC historical and RCP scenarios, Aguacatal station.
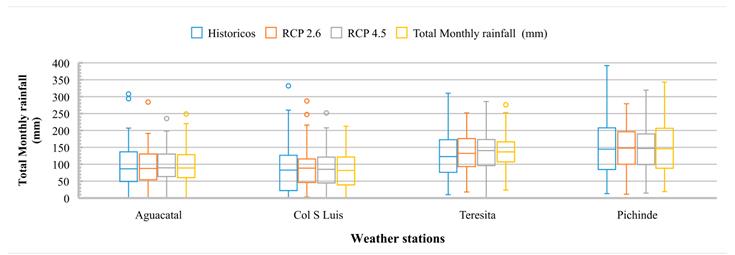
For the majority of the stations, the ANNs achieve an acceptable representation of the precipitation distribution that adequately reflects the data’s median. However, for some stations, mainly those located in the upper and lower areas of the basin, the ANNs do not manage to estimate the maximum and minimum values of the different scenarios with precision (fig. 7). This is because the precipitation variable has a high spatial and temporal heterogeneity that makes the estimation of the values difficult. Furthermore, part of the precipitation that is generated by small-scale atmospheric structures cannot be recreated adequately at the resolution of the GCMs [34; 35].
Source: The Authors.
Figure 7 Box and whisker plot for historical vs. estimated precipitation data of the Cali river basin, period 2006-2016.
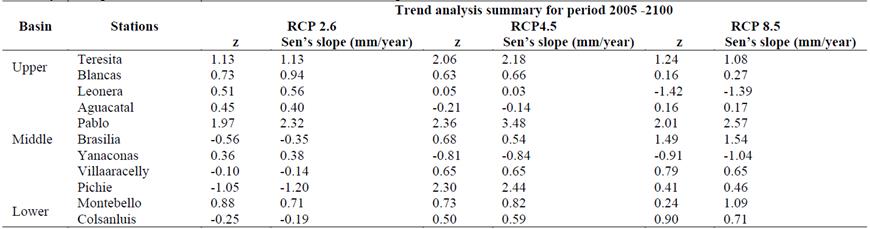
The analysis of the trends using the Mann Kendall non-parametric test found that, over the coming years, the river basin will be subject to an upward trend. However, it is important to note that in the middle area of the basin, for some stations, in the RCP scenarios 4.5 and 8.5, there are downward trends. Additionally, the size of the precipitation depth, calculated using Sen’s slope, ranges between 0.3 and 2.2 mm/year in the upper area, 3.5 and -1.4 mm/year in the middle area, and between -0.2 and 1.1 mm/year in the lower area, from which it can be inferred that the middle zone will suffer the greatest changes in the future (table 4). These results match those obtained by Cardona et al. (2014) [36] from an evaluation of precipitation trends in the Cali river basin for the 1954-2010 period, where they found that precipitation trends generally increased by 67% in the stations located within the basin, especially those in the east, with an average increase of 0.3 mm/year. For these reasons, it is predicted that precipitations in the basin will continue to rise in the future, as has been seen historically.
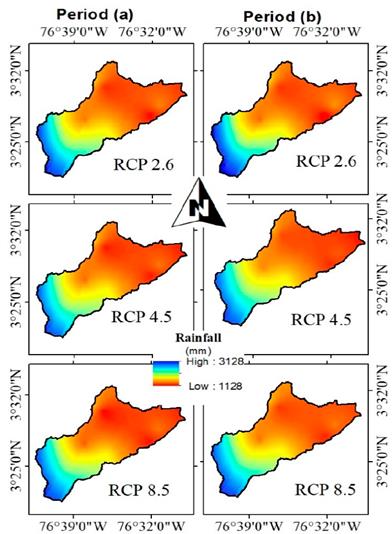
The distribution of the average annual precipitation in the different Climate Change scenarios presented higher levels in the basin’s upper and middle areas in comparison with its lower areas for Period a (2017-2058) and Period b (2059-2100). Similarly, precipitation in scenario RCP2.6 presents higher maximum average precipitation levels in both periods with values of 3125 and 3128 mm respectively. For scenario RCP4.5, on average, the maximum levels are lower with values of 3045 and 3043 mm, and the minimum levels have values of 1138 and 1132 mm consecutively for each period. Finally, for scenario RCP8.5, there are maximum levels of precipitation of 3086 and 3096 mm and minimum levels of 1131 and 1175 mm respectively (Fig. 8).
Source: The Authors.
Figure 8 Precipitation distribution in Climate Change scenarios RCP 2.6, 4.5 and 8.5 in period a (2017-2058) and period b (2059-2100) in the Cali river basin.
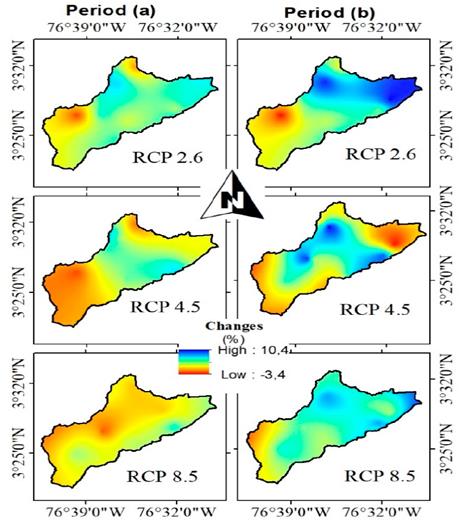
The analysis of the Climate Change scenarios showed that when compared with Periods a and b, the 1972-2016 period presented changes that range between -3.4 and 10.4% for the different RCP scenarios (fig. 9). It also showed that these changes are generally positive, results that match the trends presented in the Mann Kendall Table 4 where the most significant changes are found in the middle area.
Source: The Authors.
Figure 9 Precipitation change distribution of the RCP 2.6, 4.5 and 8.5 Climate Change scenarios for period a (2017-2058) and period b (2059-2100) in the Cali river basin.
Additionally, according to a study developed by IDEAM et al. (2015) [37] that predicted precipitation and temperature (2011-2100) in Valle del Cauca, the Cali river basin area will see a change in conditions that is categorized as normal with a range of -10 y 10%, which aligns with the results described above that refer to the changes in precipitation in the basin. IDEAM (2015) [37] also establishes that the reduction in rainfall alongside changes in land use will directly impact agricultural and forestry production, human health, and the regional economy and its competitiveness, thanks to the acceleration and increase of desertification and the loss of water sources. Furthermore, an increase in rainfall will cause flooding (in flat areas) and an increase in the risk of landslides, damage to road infrastructure and harm to rural aqueducts.
4. Conclusions
Analysis of the Climate Change scenarios in the basin found that the statistic downscaling of monthly precipitation using ANNs presented acceptable correlations, the results of which were affected by the location of the different stations and their initial correlation with the chosen GCMs. Additionally, the precipitation trends of the different projected scenarios are generally positive, and so it can be inferred that over the coming years, precipitation events will increase in either intensity or duration. Similarly, the distribution of precipitation in the river basin for the 2017-2058 and 2059-2100 periods will present varying reductions at specific points in the upper and lower parts of the basin and increases elsewhere. Finally, it was found that this distribution would present changes ranging between -3.4 and 10%, where increases in precipitation will be observed mainly in the middle area of the basin, anticipating that if the same trends continue, there will be an increased risk of landslides, considering that the basin’s Development and Management Plan [19] states that this area has steep slopes, unsustainable livestock activity, and high erosion zones.

