


 English (pdf)
 Article in xml format
 Article references
 Send this article by e-mail
 Cited by SciELO
  Cited by Google
  Similars in
SciELO
Similars in
SciELO  Similars in Google
 Permalink
1. Introduction
Income or payment capacity is essential in transportation research, especially in travel behavior analysis. This variable is one of the main factors that determine the individual choices of travelers, such as trip rates and the probability of choosing a determined transportation mode or route [1]. In addition, population segmentation in socioeconomic categories is relevant for the evaluation of externalities, costs and transport benefits, as well as social impact and equity studies. In the context of Colombian transportation research, due to the difficulty of collecting data and the absence of information on income, it is a common practice to use an official classification of households-socioeconomic strata (SES)-as a proxy variable for the income.
The socioeconomic stratification system valid in Colombia was created in 1994, classifying households into six different categories numbered 1 to 6. Strata 1 households correspond to those of lesser quality and strata 6 to the best conditions. This classification was developed to assign subsidies for public service through differential rates between high and low strata households, and between residential and commercial users. The concept of differential tariffs was created in 1968 by Decree 3069, establishing that public services rates should consider the payment capacity of different population segments. However, it was not possible to define a unified criteria to determine the payment capacity of the users until 1991. Many valuations could be observed throughout the territory during this period, some based on cadastral criteria using statistical sampling frames, and some methodologies established by the same companies that provide public services using different approaches according to the area [2].
With the promulgation of the Political Constitution of Colombia in 1991, and the compliance with article 365, which orders the state to ensure the efficient provision of public services, the SES system was established for household classification for the assignation of public services tariffs. Initially, the Administrative Department of Statistics (DANE) would supply the classification methodologies to the municipalities, oversight that was then assumed by the National Planning Department (DNP) in 1992, and that finally returned to DANE in 2004 through Resolution 392.
The concept of socioeconomic stratification has been developed through a technical discussion about which criteria should be taken for its classification and convenience [3]. Since the beginning, through Decree 969 of 1991, it was established that an adequate indicator for the payment capacity of users was a composite of factors related to the physical characteristics of the house and its surroundings. This criteria is still active. According to DANE [2], the current methodology for SES employs information from the house and its surroundings for classification based on data from the official cadastral system of Colombia, including variables like legal status of the property, registry, ownership, geometry, physical characteristics, econometric models for property valuation and zoning of homogeneous physical and economic areas. With this information, qualification procedures for a weighted hierarchy by location are executed, from which the strata is defined taking into account the average characteristics of the households.
As reviewed, the methodology for SES of households is based on the physical characteristics of the house and its surroundings; it does not directly consider economic attributes of the inhabitants. Despite this fact, there is a notion that the SES represents household income, based on the assumption that the physical conditions of the house are an indicator of the payment capacity of the inhabitants, even though the SES is a dwelling classification. Considering this situation, some public authorities have made evaluations of the viability of the SES as a subsidies allocation tool [4, 5].
Despite the problems that the use of SES as a proxy variable for income can generate, this practice continues to be implemented due to minimal availability of income information. On the one hand, there are complete and reliable official databases for SES, given its relevance in the estimation of public service rates. Besides, the strata is an easy variable to collect in the field. In general, it has been observed that people are not willing to provide information concerning their income on surveys, mainly due to security issues, while providing the SES is a practice that does not generate rejection. Thus, there have been cases such as the last official mobility survey in Barranquilla, hired by city hall in 2012, which did not inquire about income, just the household SES.
Given this background, this research proposes an evaluation of SES as a proxy variable for household income. The analysis was made for the cities of Bogotá, Medellín, Cali and Barranquilla, by estimating ordered logit regression models that include additional variables such as household size, availability of vehicles and proportion of workers and students. The approach aims to establish the relation between SES and income for different segments of the population from a transport engineering perspective. The results were then validated and applied in a trip generation model.
The document contains five sections. The first corresponds to the current introduction and the second includes a literature review about the use of SES as an indicator of household income, with an emphasis on transportation research. The third chapter explains the methodology and the fourth includes the results. In the last section, the main conclusions are summarized.
2. Literature review
The literature review has two sections. First, we discuss studies that evaluated the viability of SES as an indicator of income or payment capacity; while the second section reviews the use of SES and income in transportation research.
2.1. SES as indicator for household income
Some studies developed by public entities have evaluated the pertinence of SES as an indicator for household income, mainly from the perspective of the instrument as a tool to target subsidies and social programs [3-6]. In the report describing the current methodology for SES, DANE [2] made a correlation analysis and performed a multiple correspondence analysis to establish a relation between the strata and the physical status of the dwellings according to cadastral information and the payment capacity of the household. As expected, they found that there is a correlation between these characteristics.
DNP [4] evaluated the efficiency of the strata in the allocation of subsidies by comparing it with different indicators of payment capacity. The results indicated that although the strata is adequate to identify households with lower payment capacity, it has led to population growth in the subsidized zones by customers who can afford to pay the full rate; so the authors suggested evaluation of allocation alternatives, for example, use of the Identification System of Potential Beneficiaries of Social Programs (SISBEN). The planning office of Bogotá [5] carried out a similar evaluation through experimental economic methodologies based on the dictator game methodology. They determined that SES tends to concentrate the population in the second and third strata, reducing the redistribution ability of the territory, so they proposed a multidimensional targeting index.
A study was developed to evaluate the SES in Bogotá in 1999 [7]. In the process, the authors estimated a logit regression model to predict the strata from the income using the quality-of-life survey data of DANE. Even though a positive correlation between the variables was evident, in low-income households, the probability of belonging to the second and third strata was always higher compared to the first, while, in the highest strata, the probability of belonging to the fourth strata was always higher compared to the fifth and sixth. In the middle-income ranges, the results were relatively congruent, with a greater possibility of belonging to the fourth and fifth strata.
In the academic literature, the connection between strata and income has been moderately addressed. In 2006, Sepulveda et al. [6] analyzed the SES limits from the point of view of cadastral information as a reflection of urban socioeconomic differentiation. The author began by arguing that the strata classification methodology has important limitations in four main aspects: some input variables are defined in a subjective way, there is no weighting of variables by discriminating power, the criteria are vulnerable to political pressures and there are deficiencies in the flow of information between the institution involved in the process. In addition, based on a descriptive statistical analysis from the Bogotá multipurpose survey of 2011, they point out that the current SES does not rigorously classify households according to their living conditions. They also performed a multivariate analysis to observe the correlations between a set of socioeconomic indicators and a series of cadastral variables, concluding that stratification fails to classify households adequately in terms of their socioeconomic characteristics.
In this way, Alzate [3] conducted a review of the SES system in Colombia and the methodologies applied for classification since its conception, focusing on the utility of the tool as an instrument for allocating public expenditures. The author indicated that the evaluations carried out to date tend to state that there is a correspondence between income and SES based on how well the latter manages to target subsidies on the poorest. However, this is not completely true, since the stratification is based on the physical characteristics of the house and its environment, so when classifying households by income quintiles and comparing with their strata, the correspondence is not evident. In addition, the relation of strata and income tends to be stronger in urban areas compared to rural areas.
Finally, Bogliacino, Jimenez and Reyes [8] carried out an experiment based on the trust game and the dictator game with a sample of 1000 participants in Bogotá in order to identify the incidence of SES on household segregation. In the exercise, the sample correlation between SES and payment capacity, measured based on the household expenditure and the difficulty of facing an unexpected expense in a limited time, stood out. The correlation was determined through a Chi2 test, with a significant statistic value of 0.44, although some measurement error should be considered.
2.2. SES, income and transportation
In the field of transportation and urban studies in Colombia, few studies have used both income and SES as indicators of payment capacity, while many use SES as a proxy. Along this line, Bocarejo and Oviedo [9] calculated accessibility in different areas of Bogotá in order to evaluate inequities in accessibility to the territory. They formulated a cost function based on the monetary travel cost by mode, location and SES with an accessibility component corresponding to the ratio between monthly expenditures on transportation and individual income, finding that individual accessibility does not depend entirely on SES. In this case, joint use of location and SES have advantages in the estimation of travel costs, since the spatial information for SES is available from different official sources.
In Medellín, Marquet, Bedoya and Miralles-Gausch [10] analyzed local accessibility inequalities and willingness to walk, finding that lower-strata individuals had higher probability of taking a walking trip and a lower probability of taking a short trip. This means that this segment of the population walks more and has longer trips. The authors suggested that recent transport investments made in the city, such as the Metrocable system, has proven to be a useful tool for the integration of neighborhoods with difficult access, but Medellín is still a highly unequal city, facing huge challenges in mobility and accessibility.
SES is used as a proxy for income evaluation and accessibility to the Bus Rapid Transit (BRT) of Cali [11], showing that 80% of the population was within a 15-min walk to the system. However, this accessibility varies with SES. Middle-range strata users (SES 3, 4 and 5) had higher walking accessibility to the bus rapid transit, compared to the lowest and highest SES-groups 1, 2, and 6.
Studies using household income as the analysis variable include the work of Guzman & Bocarejo [12], who analyzed the density distribution in the urban area of Bogotá, reviewing the implications for different segments of population and finding significant differences in travel times between income groups. Spatial differences between population and employment density lead to greater accessibility, shorter travel times and, on average, 150% more trips on a typical day for the high-income segments. The investigation did not use strata, but worked directly with the household income reported in the mobility survey from 2011. In addition, using data from the same survey, Guzman and Oviedo [13] addressed the issue of accessibility, affordability and equity from the perspective of subsidies to public transport.
In Latin America, many studies incorporating income can be found, in some cases, as an ordinal variable and as input in transportation research. Some examples include studies of departure time choice models [14], analysis of the relation between mobility and the built environment [15] or mode choice models [16, 17].
In contrast, studies addressing SES as an income indicator are more common in the Colombian context. Oviedo-Titheridge [18] studied social exclusion and accessibility in peripheral areas of Bogotá where low strata predominate. In this way, Teunissen, Sarmiento, Zuidgeest and Brussel [19] identified that Transmilenio, the BRT system of the city, offers equal access to all levels of SES, although alternative programs, like Sunday ciclovía, favor high strata. In the interaction between the transport and land price fields, Munoz-Raskin [20] determined through spatial hedonic models that properties located in areas of medium strata have more value in the market due to proximity to Transmilenio. Similar studies are evidenced in Cali, using SES as segmentation criteria [11,21].
The use of SES as an income indicator is also evidenced in other areas of transportation research. In demand modeling, is used as an input variable for trip generation models [22], in departure time and mode choice models [23] or in travel behavior analysis and other choice contexts, such as street crossing [24,25].
From the literature review, one could conclude that most of the studies use the SES as an indicator for household income in an implicit way, without formal justification. In this scenario, the current investigation proposes an evaluation to support that practice, with the purpose of providing a tool to validate its use.
3. Methodology
The methodology was divided into two parts: first, an ordered logit regression analysis was used to evaluate the pertinence of the use of SES as an explanatory variable for income and its correlation, incorporating some household characteristics. Then, the results from the first evaluation were validated by applying them in household daily trip generation models.
To carry out the evaluation of the SES as an explanatory variable for household income, we used data from mobility surveys of households in the four main cities of Colombia. This kind of survey collects information about trips made by the population and socioeconomic characteristics of users and their households. This information is generally used to develop transportation models, although the data are useful for other kinds of analysis.
The cities included in the investigation were Bogotá, with a mobility survey from 2015, Medellín with information from the origin-destination survey of 2017, Cali, with the mobility survey from 2015 and Barranquilla, with a household survey from 2017. From this information, we estimated ordered logit regression models in which the dependent variable was the household income and the independent variables were the SES and other characteristics of the household. This methodology was chosen because in all databases the income is found as an ordinal variable divided into non-uniform ranges. With this framework, it was possible to determine the level of explanation that the SES has over income, and if there is a correlation between them.
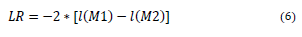
In an ordered logit regression model, level k of the observed response in the ordinal dependent variable Y is given by the relation between a lineal estimator Y’ j , constructed from a set of explanatory variables x i multiplied by the coefficients β i to be estimated, plus a component of error εj, and some thresholds t k-1 that must also be estimated. This formulation is summarized as indicated in equations (1) and (2).
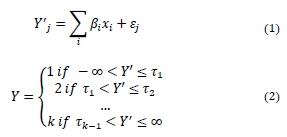
The probability of the response variable Y corresponding to a category smaller than k, is given by equation (3), where the logit function of such probability is equal to the threshold of the given category minus the linear estimator.
Note that the regression coefficients ß i correspond to the log-odds ratio of the independent variable against the dependent variable. Besides, the vector of coefficients ß i does not depend on the number of categories j, so one can assume that the connection between Y and x i is independent of this value, so the log-odds ratio of probability is considered constant throughout all k points of response [26]. Hence, by estimating the values of the regression coefficients and their significance level, it is possible to identify the link between independent and dependent variables. The significance of the coefficients was evaluated through the Student's t-test, where the t-statistic is equal to the value of the coefficient divided by its standard deviation (equation 4). This value must be greater than 1.96, assuming a significance of 95%, to reject the null hypothesis that the coefficient is statistically equal to 0.

Two ordered logit regression models were specified. The first (M1) only contains the SES as an independent variable; while in the second model (M2), household size, two dichotomous variables that take the value of 1 if the household has a car/motorcycle available, and the proportion of workers and students in the household were included. We expected a correlation between these proportions and the income, so that as the number of workers increase, so does the income, while the opposite occurs with the number of students.
To compare the goodness of fit of the two models, we estimated the statistic ρ 2, which relate the model quality to the null model which does not include explanatory variables, using the log-likelihood as shown in equation (5). The value of ρ 2 is between 0 and 1, and while the statistic is bigger, the model has a better fit.

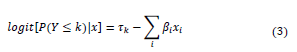
Likelihood ratio tests were applied to compare the M1 and M2 models for each city. In this test, the log-likelihood ratio was estimated according to equation (6), which distributes Chi2 with degrees of freedom equal to the difference in the degrees of freedom of the models. This statistic allowed us to evaluate the null hypothesis that the simple model (M1) is statically equal to the complex model (M2), considering that M2 is a more general version of M1.
In the surveys from each city, the income was present as an ordinal non-uniform variable. Thus, it was necessary to aggregate it into three comparable levels, as indicated in Table 1.

The second stage of the evaluation consisted in the validation of the results obtained in the ordered logit analysis by comparing trip generation models per household using income and SES, with the attributes that were significant in the first analysis. For the models to be comparable, in those where the SES was included as an explanatory variable, the attribute was reclassified into three categories. In this way, strata 1 and 2 group into the low level, strata 3 and 4 into medium, and strata 5 and 6 into the higher level, so the classification coincides with income class.
The second analysis allowed us to implement and validate the findings of the ordered logit regression evaluation in a typical transportation model. For this purpose, we estimated ordinary linear regression models where the dependent variable corresponded to the number of household trips made in a typical day according to the information collected in the surveys, which has been found to be related to the payment capacity of the travelers [1]. We then compared these models by goodness of fit using the coefficient of determination R2 and the significance of the estimators.
4. Results and discussion
The results chapter contains two sections according to the methodology applied. The first part refers to the estimation of the ordered regression models with their respective parameters of goodness of fit. The second includes the proposed generation models. In addition, Table 2 shows a description of each sample used by city. In all cities, the majority of households belonged to low-range SES and income, which is consistent with the results from the National Household Budget Survey 2016-2018 carried out by DANE. The survey determined that around 60.7% of Colombian households subsist with an income of less than two times the monthly minimum wage.

4.1. Ordered logit regression models
Tables 3 and 4 contain the results of the estimation of the ordered logit regression models M1 and M2, as well as the two thresholds of the three income categories for each city.


In all cases, the thresholds increase in value with the income level, and the SES coefficients are highly significant. In addition, the coefficients of strata 1 were less than one, with the exception of Barranquilla, which increases as the strata goes higher. This means that low SES households have a higher probability of belonging to a low-income level.
Regarding M2 models, the availability of a car or motorcycle in the household was significant and relevant in the prediction of income from SES, with exception of the motorcycle in Barranquilla, where the value of the t-test was 1.04, so it is not significant. The car coefficients were higher than those in Bogotá, Cali and Medellín, so a household with this kind of vehicle has a higher probability of having a higher income compared to one that does not have a car. In the case of the motorcycle, the value of the coefficient was less than one, so households with this attribute tend to have a lower income than those with a car.
As expected, the household size was also significant, as the probability of having low-income increases with the number of inhabitants. Furthermore, the proportion of workers was significant in all cities, except Cali, with coefficient values higher than one. Instead, the percentage of students was only significant for Cali, with values even below zero.
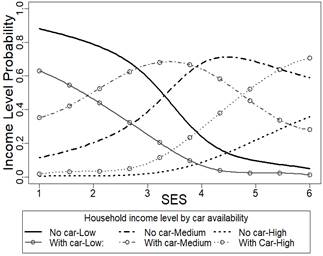
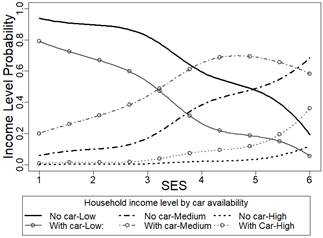
Graphical results for the M1 models of Bogotá and Cali are shown in Figs. 1 and 2 as examples. In Bogotá, the probability distribution of having a certain income level given the SES had the expected trend, since the probability of a household with high income was higher for SES 5 and 6. In the case of middle income, the probability was greater in SES 3 and 4, and for the low-income levels, the probability was higher in SES 1 and 2. However, in the other cases, this correlation was not clear because these patterns were not clear. Fig. 2 shows that an SES 5 household in Cali was more likely to have a medium or low income, while in SES 6, the probability of having a middle income was much higher than the probability of having a high income level. These results suggest that to use SES to segment the population according to their income in Bogotá, it was appropriate to use three categories (low, medium and high); while in Cali , Medellín, and Barranquilla there was no clear difference between medium and high income levels, so it is recommended to use two categories (low and medium/high).
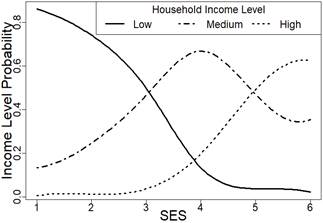
Source: The Authors.
Figure 1 Probability of having a determined income level given the SES in Bogotá

With the purpose of visualizing the difference in the interaction between SES and income depending on household characteristics, Figs. 3 and 4 show the probability distribution of having a determined income level given the SES in households with and without car for Bogotá and Cali. The probability changed when comparing two household of the same SES with and without car. Households with car had a higher probability of having a medium or high-income level and a lower probability of having low income.
Source: The Authors.
Figure 3 Probability of having a determined income level given the SES in households with and without car available in Bogotá
Source: The Authors.
Figure 4 Probability of having a determined income level given the SES in households with and without car available in Cali
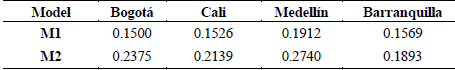
Table 5 includes ρ2 parameters to test the goodness of fit of the ordered logit models M1 and M2 by city. The statistic was higher for the more general models M2, meaning that they had a better fit in comparison with the simpler model M1 that only considered the SES as an explanatory variable for income, without introducing any more household attributes.
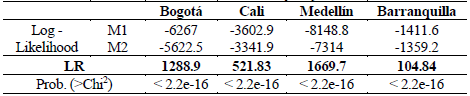
Moreover, Table 6 includes the likelihood ratio test between M1 and M2 models for each city. In all four cases, the test results indicate that the M2 model had a better fit compared to the M1 model, results that were in concordance with the ρ2 parameter estimated.
Most of the household characteristics included in the analysis, with the exception of the student proportion, were significant with a 95% level of confidence in the ordered logit regressions. A household with a high SES (strata 5 and 6) does not necessarily have a higher income than one with a lower SES, a situation that was especially relevant in Cali, Medellín and Barranquilla. Therefore, when dividing the population by SES groups, precautions must be taken since the strata might not be representative of the household income. The results suggest that the relation between SES and strata is not direct, but that it depends on some household characteristics.
4.2. Household trip generation models
Two household daily trip generation models for each city were estimated. One considering the grouped SES (low, medium and high), and the other, the income levels as explanatory variables. In both cases, the household attributes considered in the ordered logit analysis were included as independent variables in order to evaluate whether similar results can be achieved in transportation models using SES and income through the incorporation of these attributes. The framework considered the use of a simple linear regression model to predict the number of trips per household. The estimation results, coefficients, t-tests and coefficients of determination R2 can be reviewed in Table 7 for the SES models and Table 8 for income.


SES and income coefficients resulted in similar levels of significance for both models in all cities. Furthermore, when reviewing the coefficient values and t-tests of household characteristics, it can be noted that these attributes were highly significant, especially household size and car and motorcycle availability, the last one with the exception of Bogotá. These results indicate that the number of trips made by a household in a typical day depended heavily on these attributes. On the other hand, the coefficients of determination of the models by city were practically the same, so the fitness of the models that use SES and those with income was similar.
According to the results, trip generation models can be estimated with similar results using SES or income, if the significant household attributes from the ordered logit analysis are added as explanatory variables. This means that by incorporating car and motorcycle availability, household size and the proportion of workers, similar predictions might be obtained using either SES or income.
5. Conclusion
This research provided useful information about the pertinence of using household SES as a proxy variable for income. This is a common practice in transportation research in Colombia due to the ease in obtaining information regarding SES in comparison with people’s income. Nevertheless, the methodology of household classification in SES is based on the physical characteristics of the dwelling and its surroundings, and it does not directly consider the economic attributes of the residents. Keeping this in mind, the evaluation of the relation between income and strata for Colombian cities was justified.
The analysis focused in Bogotá, Cali, Medellín and Barranquilla, the four most important cities in Colombia. The work had two relevant components. In the first, we estimated ordered logit regression models to determine the predictive power of income from SES, considering the following household characteristics: size, vehicle availability and proportion of workers and students. In the second, daily trip generation models by household were estimated using SES and income as explanatory variables, and adding the significant attributes from the first evaluation in order to test if similar results can be obtained when using SES as a proxy variable for income.
The main conclusion of the research is that there was a positive correlation between SES and household income. However, this correlation depends on specific household characteristics: household size, number of workers, and vehicle availability. Along this line, the probability of having a higher income increased in households with a car and decreased in those with a motorcycle. The correlation between SES and income was not completely clear because the probability of having a certain income level given that SES varies according to these attributes. For this reason, in order to obtain trustworthy results for income distribution given the SES, the inclusion of these characteristics is recommended when using the SES as a proxy variable for income.
Regarding the differences between the cities analyzed, Bogotá had the clearest correlation between SES and income. In other words, households in SES 1 and 2 were more likely to have low-income levels, those in SES 3 and 4 were more likely to have a middle-income range and high-strata households were more likely to have a high income. However, according to the results in Cali, Medellín and Barranquilla, the correlation was diffuse for these cities. This might be because a high strata household does not necessarily have an income higher than one in a lower strata. In such cities, households belonging to the high strata were more likely to have a medium income than a high income. In addition, homes in the middle SES, strata 3 or 4, had similar probabilities of having either low or middle incomes. From these results, it is possible to conclude that the correlation between SES and income is stronger in Bogotá compared to the other cities. However, the segmentation of low, medium and high SES to represent households within the same categories of income in different cities is not recommended.
Otherwise, the household daily trip generation models estimated using SES and income had similar fits when incorporating the significant attributes of the ordered logit regression analysis. This indicates that using the SES as a proxy variable for income might be viable if the correspondence between the variables is reviewed considering specific household characteristics. This situation is especially important when grouping the income or SES in categories with different levels.
Finally, future research should consider expanding the analysis to more cities, especially medium and small towns, and rural areas where the relationship between SES and income could be even more diffuse. On the other hand, it is pertinent to increase the spectrum of application of the results found, comparing results of models that include SES and income in other fields of transportation research, as is the case of route or mode choice exercises.

