


 Inglés (pdf)
 Articulo en XML
 Referencias del artículo
 Enviar articulo por email
 Citado por SciELO
  Citado por Google
  Similares en
SciELO
Similares en
SciELO  Similares en Google
 Permalink
1. Introduction
The modeling of real estate prices has undergone the majority of its development under the hedonic approach, since the value of this type of property depends mainly on its structural, neighborhood and environmental properties [1].
Despite the support given by the hedonic approach, this does not offer a guide how to choose the variables that should be incorporated in the hedonic price function [2]. Today, such a challenge involves even more complexity, as massive data scenarios predominate, as highlighted by studies such as that by Mullainathan and Spiess [3]. Pérez-Rave, Correa-Morales and González-Echavarría add that due to the high power of (parametric) testing, differences that are insignificant from a practical point of view are often interpreted as being significant [4]. Additionally, Mullainathan and Spiess show that due to high levels of multicollinearity, different sets of variables can lead to models with almost the same predictive capacity, thus reflecting the instability of these models and their limitations in terms of inference processes [3]. In this regard, the study in [4] provides empirical evidence for three types of variables: those that tend to be significant even with small sample sizes, and which remain stable despite an increase in the number of observations; other variables that are not significant from the beginning and remain so; and others that are more risk, whose significance changes with an increase in the sample size. Hence, authors such as Banerjee and Dutta have found that one of the great challenges in the study of hedonic prices is clarification of the variables that are strictly necessary to make favorable predictions [5], and there is additionally a need to identify stable variables so that the predictive function can also be used in inferential processes (e.g. marginal effects) [3,4].
These considerations must be taken into account when facing practical challenges such as: (i) the need to take advantage of new sources of massive data in real estate, in order to favor better decision making [6]; (ii) building models of real estate prices based on machine learning, with high predictability in non-training samples, and whose attributes are stables (considering different samples) [3,7-9]; (iii) exploring patterns derived from texts as attributes of these models [7,10]; and (iv) using precise criteria when establishing policies related to real estate prices, thus preventing arbitrary fixations that are not supported by evidence [1,11].
The objective of this article is to develop a machine learning model for online pricing of apartments in a Colombian context. At dataset level, the scope corresponds to apartments in the municipalities of Medellín, Envigado and Sabaneta (Antioquia, Colombia) that were offered for sale on the web within a window of observation of six months (06/02/2018 to 04/12/2018). This objective has been systematized into three research questions for this study, as follows:
Q.1 Among linear regression, regression trees, random forest and bagging, which method has the best capacity to predict real estate prices?
Q.2 To what extent do attributes derived from text help to improve the predictive capacity of trained models?
Q.3 What are the most stable-important attributes for predicting online apartment prices, and what interpretation should be given from an inferential perspective?
The answers to these questions are not universal and tend to vary with the sample used, and this limits the external validity of models based on machine learning. It is therefore essential to test new contexts and samples, and to demonstrate the stability of the variables for different sample sizes.
The process of construction and validation of the model of interest used in this article, with a focus on the questions presented above, makes two contributions, as follows:
1) It provides empirical evidence derived from the use of a potential source of massive data, which is seldom used in real estate (web advertisements) [12] from a machine learning perspective, especially in the Colombian context [13]. This data source is characterized by a high frequency of data generation, accessibility and availability [14], and value (i.e. a reasonable proxy of the value of the property that does not differ significantly from the offline prices [12,14]). In Colombia, there are constant calls from the government, for example from the Science and Technology Policy and the Ministry of Information and Communications Technologies, to generate solutions that make use of data science and big data.
2) It provides a model and minimum attributes that are useful in reaching the predictive aim, but that also allow inferential explorations of the object of study. The latter is possible if the assumptions used in the training method are verified and the stability of the attributes used [8] is fulfilled, and, of course, if theoretical reasons are found for these. This is possible since although machine-learning-based models do not address causal inference, they can help in estimating these effects when they occur [15]. Thus, the present study analyzes the stability of attributes in different sample sizes using the ‘incremental sample with resampling’ strategy proposed by [4].
This document is organized as follows: Section 1 justifies the study and states its purpose and scope. Section 2 describes the procedure used. Section 3 presents the results obtained, accompanied by a discussion, and Section 4 presents some general conclusions.
2. Methods
The study was carried out in four stages, from data preparation to inferential exploration of the model attributes. All data analysis was performed in R [15]
2.1. Data preparation
The dataset consisted of 15,177 records of apartments located in Medellín, Envigado and Sabaneta (in Antioquia, Colombia), which were offered for sale through the internet over the period 02/06/2018 to 04/12/2018. This dataset was derived from the Statihouse® project [13] and was supplied by the IDINNOV research group.
Among the variables this data set contained, one was in text format and corresponded to a narrative description of the property; the other variables were structured. The data were relatively clean, so our efforts were focused on the homogenization of text in lowercase format, the elimination of punctuation marks and the replacement of values lost in the category "NR" (not reported), which allowed us to consider them in modeling. Features such as the age, floor, socioeconomic stratum and condition of the apartment were also recorded to give more balanced and useful response levels from analysis. A new attribute was additionally created (pre.m2.mean.zone), which consisted of the average price per square meter in the municipality in which each property was located (based on the available observations for the given municipality, but excluding the price of the property under consideration). This attribute was intended to serve as a proxy to summarize the conditions at municipality level that can influence the price of the property and cannot be seen either structurally (in terms of the area, number of rooms etc.) or from the sub-neighborhoods of the property [4].
Four attributes were derived from the narrative description of each property offered. One of these attributes was called the purchase stimulus (stim.buy); this was quantitative, and corresponded to a function of the narrative objects that may tend to increase or decrease the price of the property. This attribute adds +1 for each term in a set of 37 textual objects that reflect a price increase ("broad", "exclusive", "beautiful", "modern", "quiet" etc.) and −1 for each term in a set of 18 textual objects whose presence may reflect a price decrease ("economic", "auction", "simple", "without intermediary" etc.). To support this process, we used qualitative analysis and the "stringr" package in R. The other attributes derived from the text were categorical, based on whether or not they expressed a certain characteristic, and a label of "NR" was added for values not reported. These attributes were: "station", which reflected whether or not the property was near a Metro/Metroplus station); "low.price", which reflected whether or not the property was at a lower price than expected (six terms e.g. "bargain", "low price" etc.); and "longi", which reflected the length of the advertisement description, based on the total number of characters used.
2.2. Description of the dataset
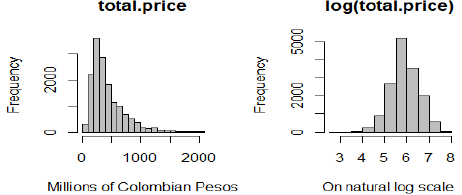
The variable to be predicted was the natural logarithm of the price of the property, as offered for sale on the internet log (total.price). This transformation is widely used in the analysis of real estate prices [3,17] in view of the characteristic asymmetry of these prices; they often have a high bias towards the right, which is caused by a few properties with values that are markedly higher than the others. Fig. 1 shows the distribution of the prices of the properties on both scales.
Source: The Authors.
Figure 1 Distribution of the total price on a monetary and natural log scale (15,177 records)
The prepared database contained 23 potential attributes. Table 1 presents a statistical description of the dependent variable (in original scale) and the quantitative attributes included in the previously prepared dataset.
Table 1 Description of quantitative attributes (sample: 15,177 records).
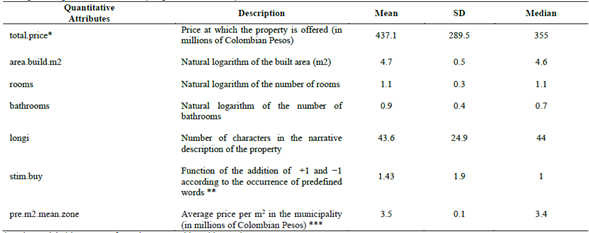
* In the model, this was transformed to a natural logarithm scale.
** In the narrative descriptions of the property, +1 was given for each word such as "broad", "exclusive", "beautiful” etc. and −1 for "economic", "auction", "simple", "without intermediary" etc.
*** Based on the properties of each municipality in the sample, but excluding the property under study. Log.nat: Natural Logarithm; SD: Standard deviation.
Source: The Authors.
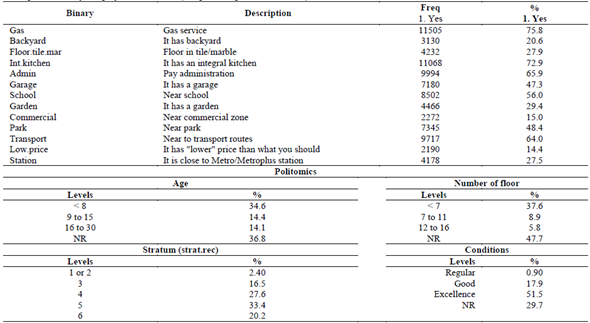
Table 2 provides a statistical summary of the binary and polytomic attributes of the sample.
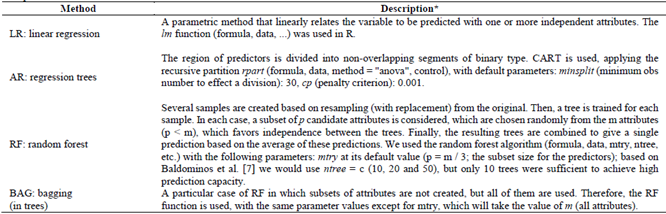
2.3. Training of models
Training was carried out using 70% of the sample (10,623 records). Table 3 summarizes the general functioning of the four methods used to train the model and gives the conditions in each case.
2.4. Validation of models
Validation was done in two stages, using the remaining 30% of the records (4,554 observations) that were not used for training. In the first instance, a comparison was carried out after splitting the validation sample into 10 subsamples (455-456 records/subsample). Following Mullainathan and Spiess [3], the value of R2 was calculated for each of these on a natural logarithm scale, using the square of the Pearson correlation between the vector of predicted values and that of the real values. In second instance, using all of the validation sample (4,554 records), although this time not using a natural logarithm scale but a monetary scale (millions of Colombian Pesos, after conversion of predictions under the exp function), we calculated the percentage of properties whose predictions fell within three error ranges with respect to the real price (p.maxErr%): 10%, 15% and 20% [4]. This validation procedure was executed twice. One of these procedures included the four variables derived from the text (stim.buy, low.price, station, longi) in the validation sample, and the other excluded them, in order to evaluate the change in the prediction capacity of the trained models.
2.5. Important attributes, stability analysis and interpretation
The most important attributes were identified predictively, based on the chosen model. The stability of these attributes was then studied, in order to explore their sensitivity to changes in the sample. This analysis was carried out due to the need in machine learning approaches to find the most stable-important attributes in order to predict the phenomenon under study with the minimum possible redundancy, which favors parsimony and inferential interpretation of the model [8, 19, 20]. We then proceeded with the interpretation of the results, supported by metrics of variability/error/impurity reduction according to the method with which the chosen model was trained. Independent of the method that offered the best predictive performance, the potential of the estimates of the coefficients under regression was exploited. So, the effects of the attributes on the response variable were explored, previous compliance with the traditional assumptions and some theoretical support. In other words, although the scope of machine learning involves prediction and not inference [3,16], we try in this study to offer interpretation of the attributes of the chosen model.
3. Results and discussion
This section is divided based on the specific research questions of this study.
3.1. Method with the best capacity to predict real estate prices
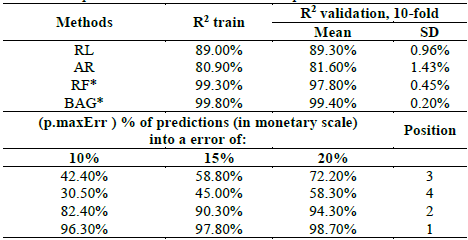
Table 4 and Fig. 2 show the results of a comparison between the tested methods in terms of their predictive capacity. It can be observed that all the methods under study have a high predictive capacity (R2 above 80%). However, the high performance of the random forest (RF) and bagging (BAG) approaches is notable compared to that of linear regression (RL) and regression trees (AR).
When the methods are ordered for this case study, the first place is held by BAG, which has an almost perfect fit not only to the training sample (R2: 99.8%) but also to the validation sample (R2: 99.4%). The results for RF are also very close to these values, and this occupies second place. The third best method is regression (RL), with a value of R2 of around 89% for both samples, i.e. about 10 percentage points lower than the two best predictive methods. AR is in last place with an adjustment at least 18 percentage points lower than that achieved by RF and BAG. Another aspect to be noted is the low overfitting of the models under test, which is supported by the small difference in the results for both samples (training and validation samples). In fact, in RL and AR the results are slightly higher for the validation sample (0.30 points for linear regression and 0.60 for tree). Regarding RF and BAG, the value of R2 was reduced when the validation sample was used (1.5 percentage points for RF and 0.5 for BAG). Although the literature highlights the predictive potential of BAG or RF over RL, it also warns that the first two tend to show greater overfitting. For example, Mullainathan and Spiess [3] trained several methods for predicting real estate prices in a US context, and found that the percentage difference between training vs. validation for RL was 5.6%, while for RF this difference was 39.6%.
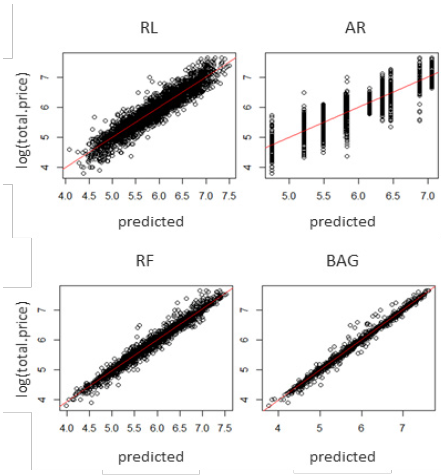
It is also worth mentioning that in Table 4, the variable pmaxErr reflects the percentage of properties whose predictions are within a maximum absolute percentage error (on a monetary scale: millions of Colombian Pesos). For example, when using RL, 72.2% of the properties had predictions with an error that did not exceed 20%, while for BAG, this value was 98.7%. Moreover, 96.3% of the predictions (for BAG) were different from the real price by a maximum of 10%. These results reinforce the potential of BAG and RF to predict the phenomenon of interest. Note that in Fig. 3, which shows the adjustment graphs for the four methods under test, the high performance of BAG stands out with respect to the other methods.
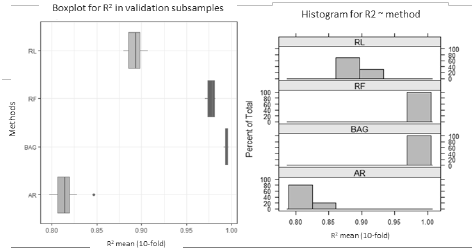
Source: The Authors.
Figure 2 Box plots and histograms for R2 for each method using the validation sample.
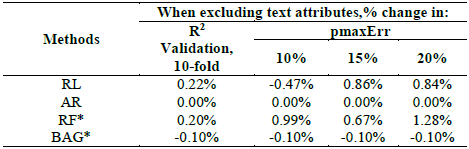
3.2. Predictive contribution of induced text attributes
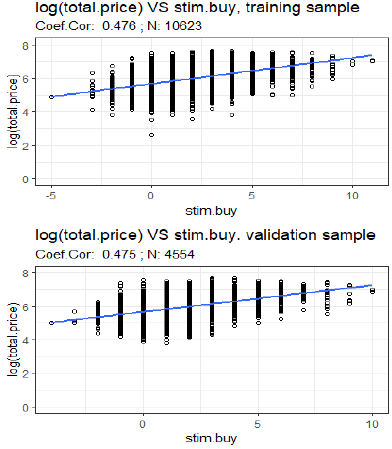
Fig. 4 illustrates the relationship between the induced text variable (stim.buy) and the price of the property (on a natural log scale).
Fig. 4 shows a positive association between the price and the stim.buy variable, with a Pearson correlation coefficient of about 0.47 for both samples (training and validation); this is statistically significant, with a p-value of almost zero for both samples. We now analyze the extent to which the group of induced text attributes (stim.buy, longi, low.price and station) impacts the prediction capacity of the interest methods. Table 5 shows the percentage change obtained by excluding this group of attributes from the model.
From Table 5, it can be seen that when the attributes derived from the text are excluded, the prediction metrics remain almost identical. The largest change was only 1.28% (pmaxErr in RF) and the smallest was −0.47% (pmaxErr in RL). In other words, the use of these text attributes is irrelevant in this case, in terms of their contribution to predictive capacity. One possible explanation for this is that attributes other than those considered here have greater importance when it comes to serving as price predictors. Hence, although the attributes derived from the text may be determinant, their contribution to the predictive capacity of the models is not sufficient to be noticed from a practical point of view. This contribution will be studied in the next section.
3.3. Most important attributes, stability analysis and Interpretation
Table 6 shows the importance of each attribute as a result of the execution of the method with the best predictive capacity (BAG) in the scenario studied here. Only four attributes stand out: the built area (area.build.m2), the number of bathrooms (bathrooms), the socioeconomic stratum (strat.rec) and the price per square meter in the municipality where the property is located (precio.mean. m2.zone, calculated excluding each property observed).
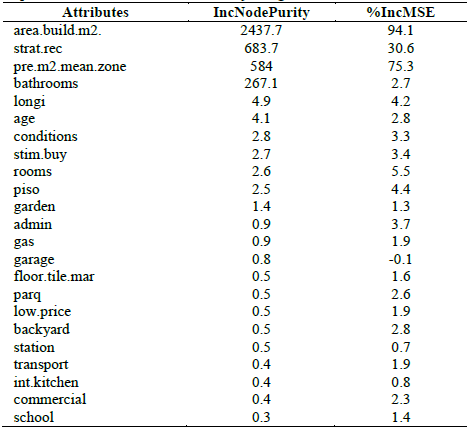
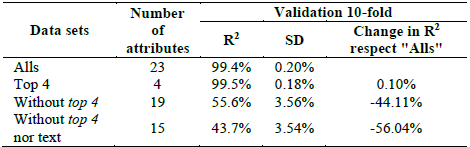
Table 6 highlights the values for the first four attributes shown, based on the increase in impurity (the sum of squares of residuals, averaged for all trees) (IncNodePurity), as a result of excluding each attribute observed. It can also be understood as the reduction of the average impurity, when a specific attribute is included in the model. For example, the lowest value of IncNodePurity for the four most important attributes identified above (bathrooms: 267.1), is more than 50 times the largest of the other 19 attributes (longi: 4.9), which gives an idea of the distance between the first four attributes and the others. Additionally, Table 6 reports the increase in the mean square error (MSE) due to the exclusion of a given attribute. Note that three of the four most important attributes are: area.build.m2, strat.rec and pre.m2.mean.zone. For example, by including only the built area in the corresponding node, a reduction of 94.1% in the MSE is expected. This means that in the specific context of this study (apartments for sale in the municipalities of Medellín, Envigado, Sabaneta over the specific observation period), the area is the most important attribute in predicting the online price of the property, based either on the IncNodePurity or MSE criteria. For a better understanding of the relevance of the attributes, three bagging models were tested in addition to those derived from the original validation data set (23 attributes, name: "All"). The first of these includes only the four most important attributes identified in Table 6 (area.build.m2, strat.rec, pre.m2.mean.zone and bathrooms) (top 4). The second model is trained using all the attributes except for these four, while the third excludes both these four attributes and the text attributes (stim.buy, station, low.price and longi). Table 7 presents a comparison of the results from these models.
Table 7 Summary of bagging based on the original set of attributes and three additional models.
Source: The Authors.
Table 7 highlights the parsimony and the predictive value represented by the most important four attributes (top 4) (area.build.m2, strat.rec, pre.m2.mean.zone and bathrooms). This means that on a statistical basis, a bagging model that considers only these four attributes as candidates (R2: 99.5%; SD: 0.18) can match the predictive performance obtained when considering the original 23 attributes (R2: 99.4%; SD: 0.20). In fact, when these four attributes are excluded, the value of R2 is reduced by about 44%, and the adjustment becomes 55.55% (R2). Worse still, when the text-based attributes are excluded in addition to these four attributes, the reduction in R2 is more than half (56%). This indicates that after the top 4 attributes, the text-derived attributes of stim.buy and longi also play a significant role, as shown in Fig. 5.
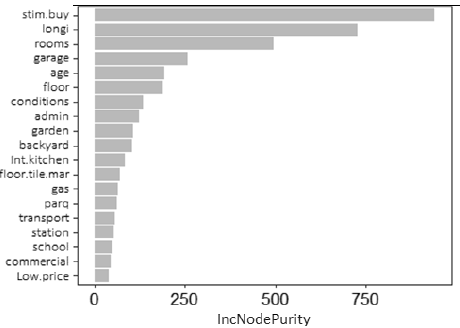
Source: The Authors.
Figure 5 Importance of attributes in a trained bagging model, excluding the most important four attributes (top 4)
It is also worth investigating whether our conclusions about the most important attributes for the prediction of online prices of apartments are applicable only to the specific sample under study, or whether their importance prevails for other samples. It is then a matter of exploring how sensitive the top 4 attributes and the text-derived attributes are when the composition and size of the sample are changed. This is a fundamental issue, since according to Mullainathan and Spiess [3], Varian [16] and other authors, machine learning results are useful for prediction but are not usually suitable for inference, due to multicollinearity events, or useless or redundant variables; even more, before data-driven approaches. To investigate this stability, Fig. 6 shows a graph of the proportion of cases using incremental sampling with resampling [4] (100 replications and replacement) for which each attribute has p-values of less than 0.05 in a linear regression model.
From Fig. 6, a high stability can be inferred for the top 4 attributes, since even for sample sizes of less than 1000 observations (close to 10% of the training sample), these are significant (p-values < 0.05) under regression in more than 95% of cases, and this significance was maintained along with the other incremental sample sizes. For the longi and stim.buy attributes derived from the text, the proportion of cases in which these were significant increased with the sample size. These two attributes were significant in 95% of the cases, based on sample sizes of close to 2500 and 4500 observations, respectively. On the other hand, for low.price and station (derived from the text), in none of the sample sizes tested was achieved a p-value lower than 0.05 in 95% of the cases.
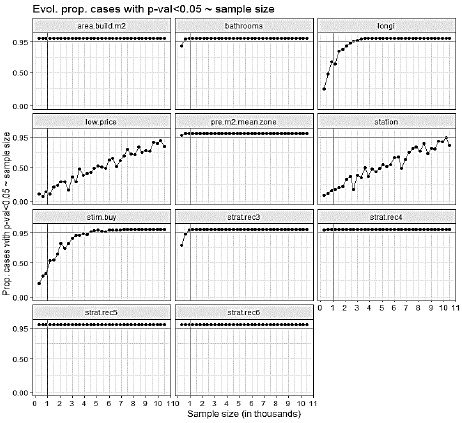
Source: The Authors.
Figure 6 Analysis of the stability of the attributes, showing the behavior of the proportion of cases (of 100 samples with replacements for each size) in which the attribute had p-values of less than 0.05 under linear regression.
Once the stability of the top 4 attributes was verified, input from previous studies was considered that reinforces the relevance of these attributes. The stratum (strat.rec) is a proxy attribute with a latent nature that aims to summarize the socioeconomic conditions of the sub-neighborhoods of the property and the amenities of the building as a result of higher purchasing power, better public services, etc. Referring to the Colombian context, Florez and Árias [21] show that this is a measure of the resources and facilities of a place. The socioeconomic stratum has also been reported as being relevant in the understanding of a variety of situations, such as the access of a population to urban green spaces [22], spending on food consumption [23] and academic performance [24]. The attribute pre.m2.mean.zone is also a proxy that aims to summarize the conditions at the level of the municipality in which the property is located that have an influence on the price and which cannot be seen at the micro (structural) level or from the adjacent neighborhoods (streets, neighborhoods, blocks etc.) [4]. At the municipality level, these conditions may include the demand for real estate, construction costs [25] and population density [26]. The built area (area.build.m2) and the number of bathrooms are traditional attributes that reflect the size of the apartment. Their importance as predictors is consistent with the positive relationship between the attributes of the size and price of the property, as reported in studies such as [27-29].
Additionally, Table 8 shows estimates of the coefficients of top 4 attributes under linear regression; these are reported separately for three samples: the training and validation sets and the complete dataset. The stability of the estimated coefficients is highlighted here.
Table 8 Coefficients (β) estimated under regression, using the four most important attributes (top 4)
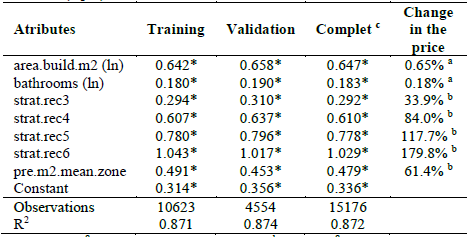
a 100 × (1.01β - 1) under complete sample; b 100 × (eβ - 1) under complete sample; c One property was excluded after analysis of residuals, as it had an extremely low studentized residual (less than -10) in comparison with the others (the maximum after eliminating the property was 5.16 and the minimum was -4.79). The excluded apartment was the lowest priced one (13.8 million pesos, 80 m2, in stratum 1). When this was excluded, the minimum price for the sample was more than double the initial price, at 35 million pesos. * P-value < 0.01.
Source: The Authors.
Based on the last column of Table 8 ("Change in price"), in which the values were calculated for the complete sample (15176 obs, after the exclusion of one property), the following points can be made:
- For a change of 1% in the built area of the apartment, with the rest of the attributes remaining constant, an increase of 0.65% is expected in the average sale price advertised on the internet.
- When the number of bathrooms increases by 1%, an increase of 0.18% in the average price is expected.
- A change from an apartment in stratum 1 or 2 to one in stratum 3 represents an expected increase of 33.9% in the average price of the property; a change to stratum 4 gives an expected increase of 84%; a change to stratum 5 gives an increase of 117.7%; and for a change to stratum 6, the expected increase is 179.8% (the rest of the attributes remaining constant).
-For every increase of one million Colombian pesos in the average price per square meter of the properties in the municipality (calculated excluding the particular property observed), an increase of 61.4% in the average price of the apartment is expected (the rest of the attributes remaining constant).
Fig. 7 shows a residual analysis of the regression model giving the coefficients in Table 8, using the complete sample (after excluding one outlier from the observations).
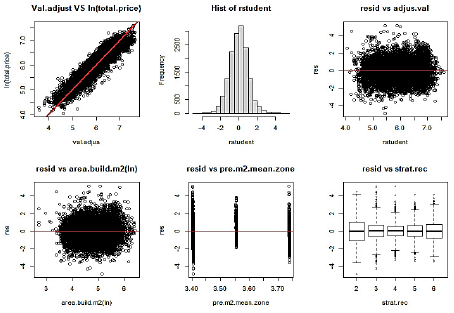
Source: The Authors.
Figure 7 Analysis of residuals for regression in the complete sample, after exclusion of one property. N: 15,176 observations
Note that Fig. 7 does not show notable patterns that lead to distortions in the classical assumptions of the regression, especially taking into account the large sample size.
4. Conclusions
This article demonstrates the usefulness and relevance of machine learning for the prediction of real estate prices in a Colombian context, and contributes to answering three study questions related to the following topics: a comparison of four methods (RL, AR, RF and BAG); the predictive effect of a group of derived text attributes; and the identification and interpretation of the stable-important attributes (of those available).
In the context studied here, the methods of tree assembly (RF and BAG) were superior to classical regression and regression trees; this result is consistent with the premise that teamwork yields better results than individual work. The best method, with a R2 of 99.4% in the validation stage, was BAG. This differs from RF in that it does not use a sampling of attributes (subspace sampling), but instead uses all of them. In addition to the original attributes, the comparison between these methods used four attributes derived from the narrative descriptions of each property for sale: stim.buy, longi, low.price and station. The first two attributes showed a statistically significant relationship with the total price (in natural logarithm scale) of the property, both in the training sample (N: 10624), and in the validation sample (N: 4554), with Pearson correlation coefficients of approximately 0.47. However, their contribution to the predictive capacity of the models was almost nil, since the primary information for this purpose was provided by only four attributes: area.build.m2, bathrooms, pre.m2.mean.zone and strat.rec (referred to here as the top 4 attributes). These attributes were analyzed, along with the attributes derived from the text, in terms of their sensitivity to changes in the sample. This analysis was done by studying the proportion of cases in which each attribute was statistically significant (p-value <0.05) via linear regression, using the “incremental sample with resampling” [4] (with 100 repetitions of each sample size). This procedure confirmed the stability of the top 4 attributes, and for only 1000 observations (about 10% of the training sample), these were already significant in at least 95% of cases. Based on the stability of these attributes, the important roles of the stim.buy and longi attributes derived from the text, which achieved the same behavior for at least 2500 and 4500 observations, respectively, were also highlighted. In view of the predictive capacity (importance) and stability of the top 4 attributes, this article provides a practical interpretation of these attributes in order to take advantage of the predictive function for inferential exploration. The regression coefficients of the total price of the property were estimated (on a log scale) using the complete sample (excluding one extreme outlier observation, N: 15,176). These coefficients made it possible to explore the percentage changes in the average price of the property based on unit changes in these attributes (in percentages or millions of Colombian pesos, according to the scale of each attribute). In this way, this work not only reports the method with the best predictive capacity, but also seeks to facilitate an understanding of the object of study.
5. Future works
It is expected that the results reported here will stimulate future transformations in real estate decision making, with a view to greater efficiency in the capture, processing, analysis and visualization of data, and more timely and evidence-based decision-making processes. For example, the proposed model could be used to develop property valuation systems. This paper also provides a guide so that future studies not only test the predictive capacity of the models but also the stability of the attributes and make inferential use of the predictive function.

