


 Inglês (pdf)
 Artigo em XML
 Referências do artigo
 Enviar este artigo por email
 Citado por SciELO
  Citado por Google
  Similares em
SciELO
Similares em
SciELO  Similares em Google
 Permalink
1. Introduction
The seismic design of most bridges is based on the results from structural computational models. Various idealizations can be used in the model for the local and global modeling that depend on the desired accuracy of the results. Despite this flexibility, many modeling assumptions are necessary because some bridge properties and other external factors are unknown at the design stage. For example, expected rather than nominal properties for the concrete and steel in the columns are used to account for the concrete strength gain with age or to define a more realistic strength of the steel [1]. The connections between the bridge elements and the boundary conditions of the bridge are modeled as accurately as possible or representative behavior is used based on the judgment of the structural analyst. The earthquake loading is also unknown, which adds uncertainty to the calculated results by the model. Even with the inherent uncertainties in the results, they are considered as the closest approximation to the actual response of the bridge during a seismic event.
Highway bridges that are continuously monitored to assess their long-term performance and are subjected to strong earthquakes may be used to revise the modeling assumptions. However, the infrequent occurrence of strong motions results in scarce opportunities to assess the computational models. This issue can be addressed by using shake table tests conducted on large-scale bridges.
The suitability of a computational model to capture the main seismic response parameters of a 0.35-scale, two-span concrete bridge model that was subjected to simulated bi-directional ground motions using a shake a table is discussed. This paper is based on a Ph.D. dissertation by the first author supervised by the co-authors [2]. The bridge model was constructed by assembling several precast elements using accelerated bridge construction (ABC) techniques. Six connections types that had been previously tested at the component level were used to connect the precast elements. The connections are referred to as ABC connections hereafter. The purpose of the tests was to investigate the seismic response of ABC bridges and connections. Before testing, a three-dimensional computational model of the bridge was developed in the software OpenSees [3] to estimate the bridge response under the simulated earthquakes. Details of the bridge and the computational model are discussed in the following sections. Key measured responses were then compared to calculated responses. The sources at the material level, boundary conditions, modeling of the ABC connections, and earthquake loading that help to explain the differences between the measured and calculated data are discussed, and future steps to improve the agreement are presented.
2. Bridge model summary
The bridge model was a 0.35-scale of a hypothetical prototype bridge that is representative of standard two-span overpass bridges in high seismic regions. The length and width of the bridge model were 21.23 m and 3.35 m, respectively. Fig. 1 shows a schematic view of the bridge model including the precast elements and the ABC connections. The superstructure included 70-mm-thick precast reinforced concrete deck panels that were connected using lap-spliced bars within longitudinal and transverse joints filled with ultra-high performance concrete (UHPC) (ABC connection #1). The panels were connected to four 420-mm-depth precast prestressed girders using clustered headed bars that protruded from the top surface of the girders and were embedded in the longitudinal deck panel joints or in deck pockets filled with grout (ABC connection #2). A cast-in-place (CIP) end diaphragm and three intermediate diaphragms completed the superstructure. Seat-type abutments that had no shear keys or backwall supported the superstructure at the bridge ends. The girder bearings at that location consisted of sliding bearings with stainless-steel-to-Teflon interface. The superstructure of each span was built as a precast component that was later connected to a precast two-column bent that had been attached to the shake table. The disassembled configuration of the bent is shown in Fig. 1. Precast column segments were attached to the footing by using pipe-pin connections (ABC connection #3). The column segments had a diameter of 450 mm and were reinforced with 10-#6 longitudinal bars and a #3-bar spiral spaced at 44 mm. This reinforcement configuration resulted in longitudinal and transverse steel ratios of p l =1.73% and p s=1.65%, respectively. At the top, the columns were connected to a precast cap beam using grouted ducts, and the column longitudinal bars were extended into a CIP portion of the cap beam (ABC connection #4).
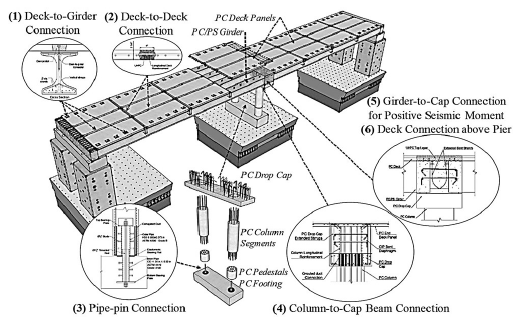
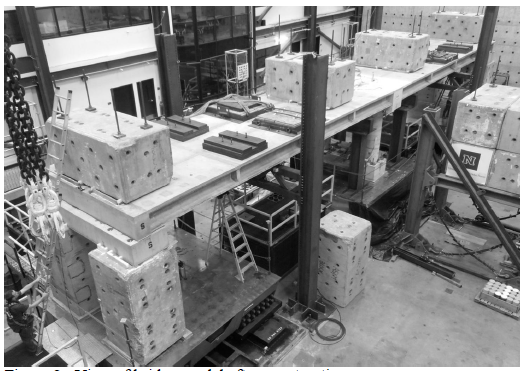
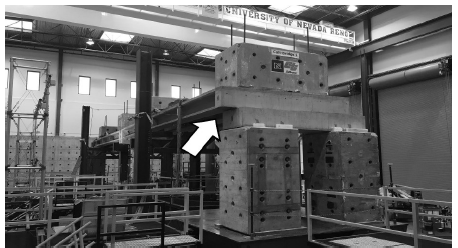
The precast superstructure spans and the bent were integrally connected at pier. Unstressed strands that were extended from the girders and were anchored in the CIP part of the cap beam along with dowel bars that passed through the girders web were used to resist the positive moments at the girder-to-cap connection (ABC connection #5). Lap-spliced deck bars embedded in a UHPC layer at the top part of the CIP cap beam provided continuity of the deck reinforcement at pier (ABC connection #6). Superimposed weights were placed on the superstructure to induce sufficient dead load stresses in the bridge model elements without exceeding the shake table limits. The bridge model after construction is shown in Fig. 2. Detailed information about the bridge and the connections is presented in [2].
3. Computational model and testing protocol
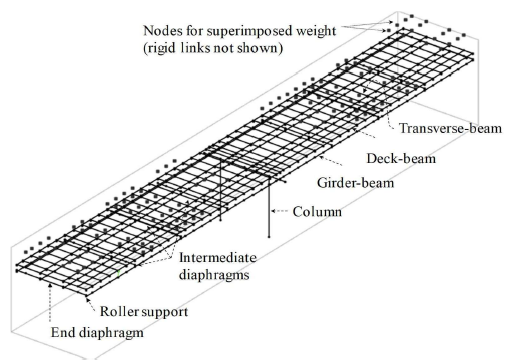
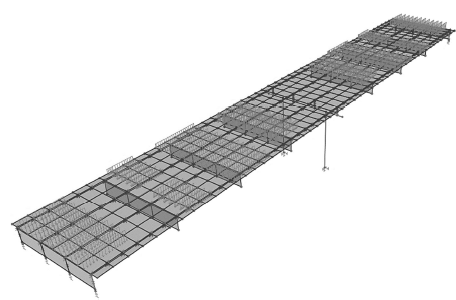
A three-dimensional computational model of the bridge was developed in OpenSees software [3] to estimate the response of the bridge during the tests, ensure that the shake table limits allow for failure tests to be conducted, and to determine the loading protocol for the shake table tests. OpenSees is an open-source software that has an extensive library of elements, material models, and solution algorithms for simulation of structural and geotechnical systems subjected to seismic excitations. Previous studies [4,5] have demonstrated the software capability to replicate the non-linear response of bridge systems with reasonable accuracy. Fig. 3 shows the computational model of the bridge. The staged-construction of the bridge was not simulated in the analytical model. Hence, it is assumed that the bridge is built in a single stage with all dead loads applied after the superstructure continuity at pier is achieved. Neglecting the staged-construction of the bridge resulted in differences less than 10% for the dead load reactions at bent and abutments compared to the anticipated values. However, the superstructure negative moment above pier was significantly overestimated with this approach. These effects were considered to not affect the global seismic response of the bridge. The following sections describe the modeling approach for the bridge components and the ABC connections, a preliminary verification of the computational model that was performed before conducting the non-linear dynamic analysis, and the loading protocol for the shake table tests.
3.1. Modeling of Bent
The idealization of the bent is shown in Fig. 4. The columns were modeled with force-based distributed plasticity elements of five Gauss-Lobatto integration points.
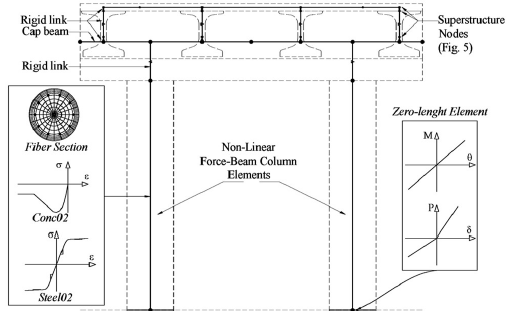
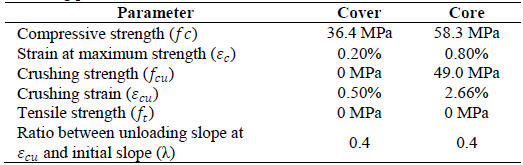
A fiber section with non-linear uniaxial materials was used to capture the axial-flexural interaction and the non-linear hysteretic response of the columns. The concrete and the steel reinforcement fibers were modeled using the material models “conc02” and “steel02,” respectively (Fig. 4). Expected material properties determined according to the recommendations in [1] were used in the analysis. The concrete properties were based on a specified 28-day concrete compressive strength (f i c ) of 28 MPa. The confined core concrete properties were calculated using the Mander’s model [6]. The modeling properties used for the cover and core concrete are listed in Table 1. The specified mild reinforcement of the column bars was Grade 60-ASTM A706 steel, which expected yield strength (f ye ) and modulus of elasticity (E s ) were 476 MPa and 200 GPa, respectively. The strain hardening modulus was assumed as 0.011E s . Note that the material steel02 does not include the yield plateau nor the strain-hardening region in the constitutive stress-strain relationship. The torsional moment of inertia for the columns was taken as 0.2 times the gross polar moment of inertia to account for significant reduction of the torsional rigidity after cracking [7]. The modified torsional rigidity was assumed to be linear through the analysis. The flexure-compression and torsional responses were uncoupled. Given the relatively large column aspect ratio, the column shear deformations were ignored. However, the potential second order P-Δ effects on the columns were included in the analysis.
The precast and the CIP layers of the cap beam were assumed to act as a single elastic section. Accordingly, the cap beam was modeled with linear elastic beam-column elements located in the centroid of the full cap beam (Fig. 4).
A modulus of elasticity of 26.8 GPa was assigned to these elements based on f l c =28 MPa. Rigid links were used to transfer the forces among the cap beam, the columns, and the elements of the superstructure as seen in Fig. 4.
3.2. Modeling of superstructure
The superstructure was modeled using a grillage to capture the distribution of forces among the girders and the superstructure in-plane rigidity. Fig. 5 shows the discretization of a typical superstructure cross section. Linear elastic beam-column elements were used to model the girders and the deck. The girders were represented by longitudinal elements (girder-beam in Fig. 5) located at the centroid of the girders. Their modulus of elasticity (E) was 37.95 GPa based on f l c =56 MPa. Gross section properties were used to reflect the lack of cracks in the girders due to the prestress force, which was not directly simulated in the analytical model.
The deck was modeled by longitudinal and transverse elements denoted as deck-beam and transverse-beam, respectively, both positioned at the center of the deck. The width of the deck-beam elements for the interior girders was the effective flange width calculated according to [8]. Two deck-beam elements were used to model the deck in the remaining section on top of each exterior girder after discounting the effective width of the interior girders. This avoided using a single deck-beam element eccentrically located with respect to the centerline of each exterior girder. The two deck-beam elements for each exterior girder consisted of a deck-beam, which was symmetric with respect to the axis of the girder, and an additional element that completed the remaining deck area (Fig. 5). The sectional properties of the deck-beam elements were based on the area they represented and their modulus of elasticity was 26.8 GPa based on f ’ c =28 MPa. Deck cracking was accounted for by using a modification factor of 0.4 assigned to the flexural rigidity of all deck-beam elements [9]. The girder and deck beams were connected by rigid links as discussed in section 3.3.
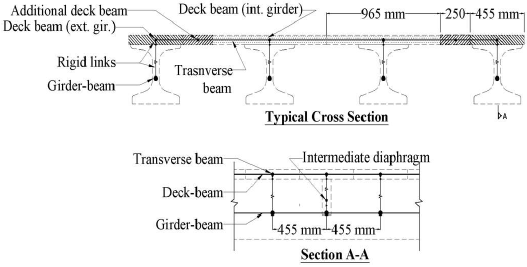
The transverse-beam elements in the grillage captured the transverse distribution of the loads among the longitudinal deck-beam elements. The spacing between the transverse-beams was 455 mm (Fig. 5), which matched the center-to-center distance between the clusters of deck-to-girder connectors.
The sectional properties of the transverse-beam elements were calculated from the slab region they embodied. Following the approach proposed by [10], the Poisson’s ratio of the longitudinal and transverse deck beams was set to zero and their torsional constant was reduced by a factor of 0.5 to account for the lack of interaction between the axial force and bending moment in the two perpendicular directions in the grillage.
As seen in Fig. 3, the grillage was completed by linear beam-column elements that simulated the intermediate and abutment end diaphragms. These elements were located at the respective centroids and had E=26.8 GPa based onf ’ c =28 MPa. The superimposed weights were represented in the model by replicating corresponding grillage nodes and placing tributary weights at the centroid of each weight. Rigid links connected the grillage and replicated nodes. Frictionless roller supports were assumed at the abutments and were implemented in the girder-beam element nodes.
3.3. Modeling of ABC connections
The deck panel joints (connection #1) were not explicitly modeled and were assumed as rigid. This assumption was based on the results from shake table tests of a superstructure span with UHPC longitudinal connections conducted by [11]. Similarly, the deck-to-girder connectors (connection #2) were modeled using rigid links that connected the longitudinal girder and deck beam elements (Fig. 5). This approach was intended to simulate composite action.
The pipe-pins (connection #3) were modeled by using zero-length elements with decoupled responses at the base of the columns. The gap between the lower and upper steel pipes and the associated pounding effects due to the closure of the gap were not modeled. Instead, the base of the columns was assumed restrained against slippage. The axial response of the connection was assumed bilinear (Fig. 4). The compressive and tensile stiffnesses corresponded to the axial stiffness of the bearing pad (118.4 kN/mm) determined from the apparent modulus of elasticity and the axial stiffness of the threaded rod (156.8 kN/mm), respectively. The moment-rotation response of the pipe-pins was assumed to be linear following the recommendation for pipe-pin connections proposed by [12]. This resulted in a rotational stiffness (Kθ) of 584.7 MN-mm/rad. The rotational stiffness was assigned in the longitudinal and transverse directions independently. The torsional stiffness of the connection was neglected as minimum torsional rigidity was expected based on the pipe-pin detail.
The column-to-cap beam (connection #4) and the superstructure-to-cap beam connections (connections #5 and #6) were assumed to behave as rigid joints. The rigid response for the three connections reflected the standard practice in the design of ordinary bridges.
3.4. Preliminary verification of computational model
An analytical model of the bridge was developed in the software CSi-Bridge [13] to verify the OpenSees grillage model.
The verification was done by comparing the bridge response under dead loads and the modal responses from the two models. Fig. 6 shows the CSi-Bridge model. Its main difference from the grillage model is that the deck and diaphragms were modeled with shell elements. Moreover, the superimposed loads were applied as surface pressure acting on the shell elements. These refinements justified its selection for comparison with the OpenSees model.
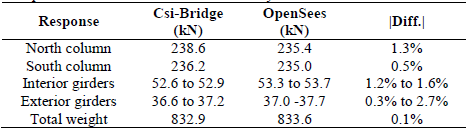
The dead load reactions are compared in Table 2. The differences are smaller than 3% indicating that the 3-D grillage was satisfactory in capturing the distribution of gravity loads among the elements. This was also evidenced by comparing other responses such as the bending moment and vertical deflection of the girders, which peak differences were less than 2% and 8%, respectively.
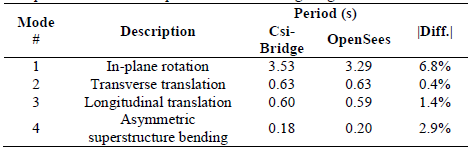
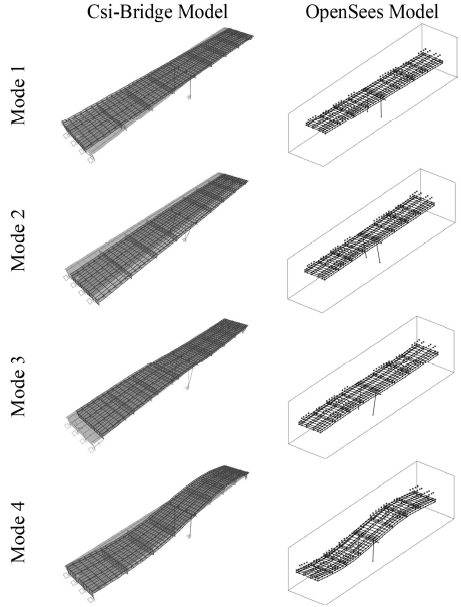
To perform the modal analysis, the non-linear column elements were replaced with linear elastic beam-column elements. The effective moment of inertia of the elastic columns was taken as 0.33 times the gross moment of inertia to account for column cracking. The modification factor was calculated based on moment-curvature analysis for the columns as recommended in [1]. A consistent mass matrix formulation was used to account for the mass of the beam-column elements that represented the deck, girders, columns, cap beam, and the diaphragms. The transverse-beams in the grillage were defined as massless elements to avoid duplication of the deck mass. The translational masses of the superimposed weights were added to the associated nodes. The mode shapes and the periods of the first four modes of vibration determined from the two analytical models are compared in Table 3 and Fig. 7. The results from the two models are in close agreement.
3.5. Loading protocol and non-linear dynamic analysis
The 1994 Northridge Sylmar earthquake was selected for simulation in the shake table tests. The acceleration record was downloaded from the PEER NGA-West2 database [14] and its time axis was compressed by a factor of 0.592 to account for similitude requirements. This value corresponds to the square root of the scale length factor (0.35).
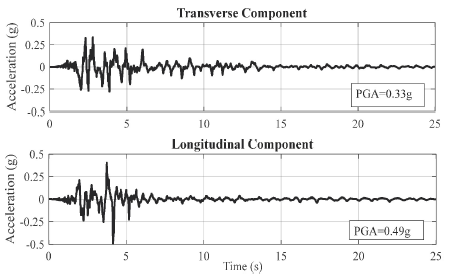
The testing protocol consisted of eight earthquake motions with amplitudes of 20%, 50%, 75%, 100%, 125%, 150%, 175%, and 200% of the design level earthquake (DE). Given the bi-axial nature of the tests and the displacement based design approach used for the bridge, the DE amplitude was iteratively determined so that the maximum resultant displacement from the response history analysis and the resultant displacement demand for the design spectrum (89 mm) were approximately the same. As a result, the target DE motion was defined by multiplying the as-measured accelerations by a factor of 0.535, resulting in the acceleration histories shown in Fig. 8.
Non-linear response history analyses (NRHA) were performed by applying coherent ground motions at the support nodes of the bridge. Although the earthquake motions were expected to be applied by the central shake table during the tests, the uniform base excitation analysis would not affect the expected response of the bridge response because the abutment nodes were not restrained against horizontal translation. The analyses were conducted by using the Newmark’s average constant acceleration method for numerical integration and the Modified Newton-Raphson method as the solution algorithm. Classical Rayleigh damping matrix with 2% damping ratio was used. The time step for the analyses was 0.00296 s and the convergence criterion was the energy increment test with a maximum tolerance of 1.11x10⁻¹⁷ kN-m. The time step, the solution algorithm or the integrator were automatically modified by a sub-routine in case the convergence criterion was not reached at the end of an iteration step.
4. Measured versus Predicted results
The response of the bridge model during the shake table tests was measured using 332 instruments attached to the bridge and 24 internal sensors of the shake tables. Several recorders were used in OpenSees to obtain the calculated results. These results are referred to as predicted results hereafter as they were determined before the shake table tests. The measured and predicted bent displacements and base shears were selected for comparison. These are important seismic responses for the design of bridges and therefore were considered relevant to assess the analytical model.
4.1. Bent displacements
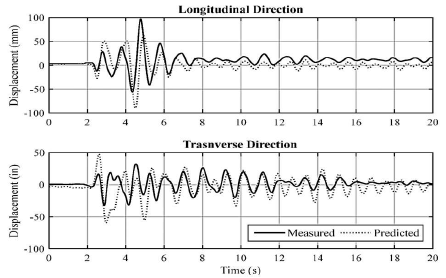
The measured and predicted bent displacement histories for the 100%DE and 200%DE motions are compared in Figs. 9 and 10, respectively. The results from these motions were selected because they are representative of the bridge response during moderate and high amplitude motions. As seen in Fig. 9, the correlation between the predicted and measured displacements during the 100%DE motion was somewhat better in the longitudinal direction than in the transverse direction. In the former, the largest measured and predicted peak displacements were opposite. Regarding the transverse direction, the analytical model overestimated the peak displacements by a large margin during the high amplitude part of the transverse earthquake component (1 s<t<6 s) and resulted in significant differences during the last part of the motion (t>12 s).
As seen in Fig. 10, the overestimation of the measured peak displacements in the transverse direction was substantial during the 200%DE motion whereas the peak longitudinal displacement (negative direction) was underestimated. It should be noted that the measured data in Fig. 10 is terminated around t=11 s because the test was stopped to avoid unseating of the superstructure at abutments as discussed in section 4.3. The shake table applied the high-amplitude part of the motion before stopping. Therefore, the comparison of the measured and calculated data for that test was judged reasonable.
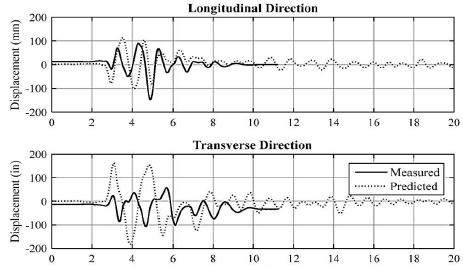
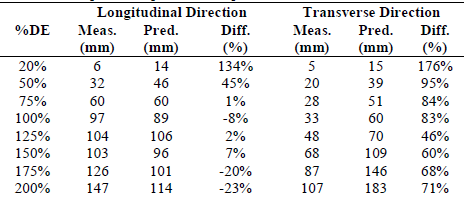
Table 4 compares the absolute peak measured (Meas.) and predicted (Pred.) displacements in the longitudinal and transverse direction of the bridge for each earthquake motion. The differences (Diff.) between the two displacements are included in the table. A negative difference indicates underestimation of the measured displacements by the analytical model. As seen in the table, the differences in the transverse direction were consistently higher than those for the longitudinal direction. The average absolute differences during the moderate and high amplitude motions (100%DE to 200%DE motion) were 14% and 65% for the longitudinal and transverse direction, respectively. The causes of the relatively large differences are discussed in section 5.
4.2. Force-Bent displacement relationships
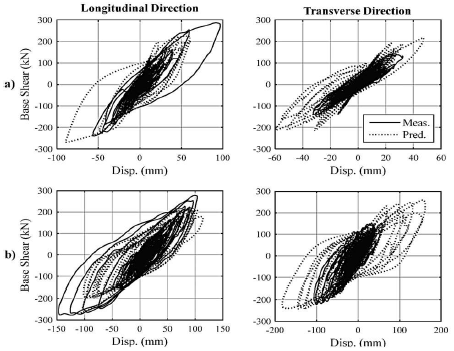
The cumulative hysteretic bent responses for 20%DE to 100%DE and 125%DE to 200%DE motions are shown in Fig. 11. The plots in Fig. 11(a) show that the initial stiffness of the bridge was reasonably estimated by the analytical model. However, the peak bent base shears in the transverse direction of the bridge were overestimated by a larger margin than those in the longitudinal direction. For example, the measured absolute peak base shear in those directions for the 100%DE motion were 140.2 kN and 286.6 kN, respectively. In contrast, the predicted values were 215.6 kN and 269.0 kN, which translates to differences of approximately 54% and 6%, respectively. The differences for the base shear and the hysteretic energy dissipation increased with the increase in the amplitude of the ground motions, especially in the transverse direction [Fig. 11(b)]. The average absolute base shear differences during the moderate and high amplitude motions (100%DE to 200%DE) were 16% and 33% in the longitudinal and transverse direction, respectively. This outcome is a consequence of the transverse-dominated displacement response predicted by the analytical model, which exhibited a trend that was the opposite of the longitudinal-dominated responses measured during the tests.
4.3. Superstructure In-Plane rotation
During the shake table tests, the peak and residual in-plane rotation of the superstructure increased gradually after the 50%DE motion. Consequently, the superstructure displacements at abutments also increased and reached peaks of 98 mm and 368 mm during the 100%DE and 200%DE motions, respectively. The latter displacement caused an unsafe condition due to the potential unseating of the girders at abutments and therefore the test was stopped. The deformed configuration of the bridge after the last tests is shown in Fig. 12.
The computational model did not predict the superstructure in-plane rotation response during the tests. For example, the measured peak in-plane rotation during motions 50%DE, 100%DE, and 200%DE were 0.002 rad, 0.0074 rad, and 0.0306 rad, respectively. In contrast, the maximum predicted in-plane rotation was 0.0032 rad. Although several factors may have resulted in the in-plane rotational response of the bridge during the tests, it is believed that this response was mainly caused by friction forces at the sliding bearings at abutments. Inspection of these bearings after each earthquake motion showed tearing and wearing of the Teflon sheets at four out of the eight bearings. This indicated that the girders did not bear uniformly on the abutment supports, which may have contributed to the development of differential friction forces at the two abutments. The effects of the friction forces and the uneven bearing of the girders were not included in the computational model of the bridge as the bearings were modeled as frictionless roller supports.
5. Evaluation of computational model and proposed improvements
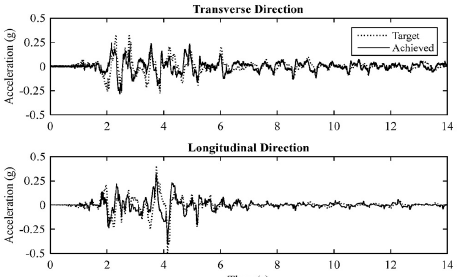
The differences between the measured and predicted bent seismic responses indicated that some modeling assumptions for the materials, ABC connections, and boundary conditions of the bridge should be revised. Another source of the differences is the ground motions. Comparison of the target ground motions and those achieved by the shake table showed that the actual earthquake motions experienced by the bridge differed from those used in the analytical model. As an example, the target and achieved acceleration histories for the 100%DE motion are shown in Fig. 13. As seen in the figure, the target acceleration in the longitudinal direction of the bridge was better reproduced than the target accelerations in the transverse direction. The differences in the target and achieved motions are due to resonant forces that act on the shake table as a result of the bridge-shake table interaction during the tests [15]. These disturbances are corrected to a great extent by internal controls of the shake table, but the correction is not effective for all frequency ranges of the motions. A high-pass filter with a cutoff frequency of 0.75 Hz that was applied to the target motion when defining the reference motion for the shake table caused additional disparities between the target and achieved motions. The filter was used to match the spectral acceleration response in the vicinity of the longitudinal and transverse periods of the bridge without exceeding the shake table capacity.
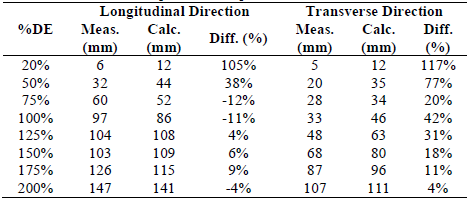
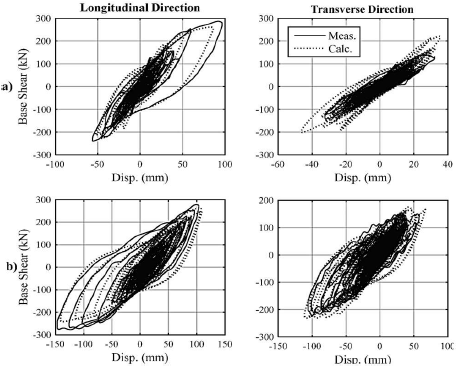
The effects of the earthquake loading on the calculated results were determined by performing the NRHA again but using the achieved rather than the target motions. The rest of the modeling assumptions were kept constant. The calculated peak displacements and the force-displacement relationships are compared to the measured data in Table 5 and Fig. 14, respectively. As seen in the table and the figure, the correlation between the measured and the calculated bent seismic responses improved significantly compared to that obtained using the target earthquake motions. For example, the average absolute differences for the peak displacements in Table 5 and for the high amplitude motions (100%DE to 200%DE) are 7% and 21% in the longitudinal and transverse direction, respectively. Recall that these differences were 14% and 65%, respectively, based on the target ground motions. Likewise, the average base shear differences during the high amplitude motions were 10% and 25%, which are smaller than the errors determined before changing the ground motions (16% and 33%, respectively).
Source: The Authors.
Figure 14 Measured and calculated cumulative bent hysteretic response: (a) 20%DE to 100%DE motion, (b) 125%DE to 200%DE motion.
The design of critical bridges is based on the results from NRHA performed by using a minimum number of earthquake motions with characteristics that are consistent with the design basis earthquake [16]. The results discussed in the paragraph above indirectly demonstrate the importance of adequately selecting the number of motions to reduce uncertainties in estimating peak seismic demands at the design stage.
The improved correlation between the measured and calculated seismic responses after updating the earthquake loading suggest that the modeling approach for the bridge model was reasonable. However, further refinements should be implemented in the computational model to reduce the remaining differences as discussed below.
The difference between the actual and assumed properties of the materials used in the fiber section of the non-linear column elements is another source of disagreement between the predicted and measured results. This is of particular importance because the seismic response of the bridge was mainly governed by the plastic deformations at the top part of the columns where the plastic hinges formed. Therefore, a reasonable estimation of the strength and hysteretic behavior of the concrete and steel in the columns could reduce the measured and calculated response differences. For example, column concrete samples that were tested on the shake table tests day resulted in average compressive strength of 63.5 MPa. This strength is 1.74 times the expected concrete strength used in the analytical model (36.4 MPa). The measured yield stress of the column bars was only 5.6 MPa higher than the expected value (476 MPa). However, the measured backbone stress-strain curve for reinforcing steel differed from that in the analytical model by exhibiting the yield plateau and strain hardening regions. The concrete and steel properties of the columns should also be modified to account for the effects due to the high loading rate during the shake table tests. These strain rates are substantially larger than those used in the compressive and tensile tests of the concrete and steel samples. The strain-rate effects could be accounted for in the computational model by using any of the models proposed by [17-19].
As mentioned in section 3.3, slippage at the base of the columns was constrained in the computational model. This assumption should be modified because the base of the columns slipped horizontally to some extent during the tests. The slippage resulted from the closure of the gap between the upper and lower steel pipes in the pipe-pin connection, which was 9.5 mm. The revised shear-slippage response of the pipe-pins should also include the pounding effects due to contact of the pipes and potentially the coupling effects between the shear-slippage, moment-rotation, and axial-deformation relationships.
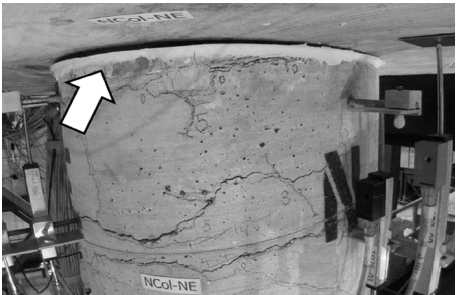
A more accurate approach to model the column-to-cap beam connection should also be used. Measured vertical displacements at the top part of the columns showed relative rotations at the column-to-cap beam joint during the tests. The gap due to the relative rotations can be seen in Fig. 15, which is shown as an example. This response differed from the rigid joint behavior assumed in the analytical model. The interface rotations are due to strain-penetration effects in the column longitudinal bars that are anchored in the cap beam. Thus, the modelling approach for the connection should be refined by integrating zero-length rotational springs such as those proposed by [20] or by adding a zero-length fiber section with modified steel properties that account for the additional bar deformations due to the strain penetration effects [21,22].
Source: The Authors.
Figure 15 View of top part of north column at instance of peak interface rotation during the 150%DE motion.
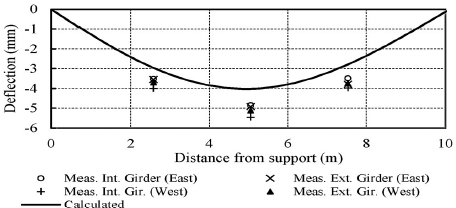
The rigid assumption for the superstructure-to-cap beam connections and the deck panel joints were judged as reasonable based on the measured data and observations during the shake table tests. However, the modeling approach for the deck-to-girder connectors should be modified to account for the flexibility of the connection. This observation is based on the differences between the measured and calculated vertical deflections of the superstructure spans under a part of the superimposed weights (Fig. 16). The deflections were measured before the spans were made continuous at pier. The predicted deflections with rigid connectors were smaller than the measured deflections by an average of approximately 22%, which indicates that the deck and the girders worked in partial rather than composite action.
6. Conclusions
The conclusions drawn from the analytical study and the results reported in this paper are:
The computational model substantially overestimated the bent seismic responses in the transverse direction when the target earthquake motions were used in the analysis. The average errors for the transverse peak displacements and base shears during the high amplitude motions were 33% and 65%, respectively. The average errors for the responses in the longitudinal direction were approximately 16%.
The main cause of the relatively large errors between the measured and estimated bent seismic responses was the difference between the target and actual earthquake motions. When the motion was updated in the analytical model by using the achieved shake table motions, the average errors for the displacements and base shears were 21% and 25% in the transverse direction, respectively, and 7% and 10% in the longitudinal direction, respectively.
The reduction of the errors in the predicted response as described above indicated that the modeling approach for the bridge model reasonably captured peak seismic response of the bent during moderate to high amplitude earthquakes.
The analysis of the measured and observed data during the shake table tests indicated that further refinements were required for the modeling approach to reduce the remaining errors after updating the earthquake loading. Several modifications were proposed to better capture the seismic response of the ABC connections as well as the strength and hysteretic behavior of the column materials.
The computational model did not predict the measured superstructure in-plane rotation and the associated displacements at abutments. It is believed that this outcome was mainly due to simplification of the boundary conditions of the superstructure at the abutments.

