


 Inglês (pdf)
 Artigo em XML
 Referências do artigo
 Enviar este artigo por email
 Citado por SciELO
  Citado por Google
  Similares em
SciELO
Similares em
SciELO  Similares em Google
 Permalink
1. Introduction
Currently, automation of the design tasks in engineering projects is required to meet project schedules. In this context, the design of trusses constitutes an active field of interest in research. Automation can be accomplished by elaborating customized numerical tools, in which commercial softwares such as SAP 2000, ETABS, ANSYS, etc., among others, may play an important role. SAP 2000, in particular, is a well-known program for structural analysis and design, used in most design offices due to its versatility and friendly output interface. Moreover, it allows users to customize their design tasks by means of its Application Programming Interface (API). That is, the user can access the program by scripts written in Visual Basic programming language without accessing the graphical interface directly. In turn, the graphical interface enables better visualization of results in real time and also exporting these results to Excel spreadsheets. Combining SAP 2000 with optimization algorithms to minimize the weight of truss structures, can lead to more feasible solutions in relation to manual solutions. For this purpose, metaheuristic algorithms, which do not require the evaluation of function derivatives and surpass local minimums, can be used.
To optimize truss structures the well-known Artificial Bee Colony algorithm (ABC) proposed by Karaboga [1], based on the productive behavior of honey bees around a given hive, is selected here. This algorithm has proved to perform well for truss optimization problems in other works [2-5] by attaining global minimums, even for complex functions, and also due to its competences compared to other important algorithms, such the cultural [6], ray [7], hybrid harmony search [8], and surrogate model [9], all of which have also been applied successfully to truss optimization problems. Meanwhile, other applications of ABC to other problems can be found in references [10,11]. Furthermore, in [12] a genetic algorithm procedure is combined with SAP2000 for optimizing truss structures by using parallel computing. To minimize the computational time, several processors and computers are used in the computation.
The aim of this work is to give a complete picture of the construction of a numerical tool for the size optimization of spatial trusses using two computer programs commonly encountered in most design offices, i.e., SAP 2000 and Excel, rather than discussing improvements for the ABC algorithm itself, all of which can be found in other works [4,5]. The coupling is developed by means of the Visual Basic programming language of macros in Excel, in which the ABC algorithm and SAP 2000 sentences are coded. Then, the necessary steps to perform this linking procedure are presented. The resulting tool can be further extended to spatial frames and shell optimization problems with minor modifications of the developed code. The complete listing code then can be requested from the authors by mailing the second author.
Finally, some conclusions are then given in the discussion section in order to enhance the performance of the combined tool because of the studied examples. It should be highlighted that this tool is able to cope with imposed constraints expressed in terms of limiting displacements and stresses. Shortcomings due to excessive computational times are also commented. Because the original ABC deals only with unconstrained problems, a commonly static penalty approach is used to convert the constrained problem into an unconstrained one as suggested in other references [3-5].
2. The ABC algorithm coupled with SAP 2000
In the following, subsections comments are made regarding the original ABC algorithm proposed by Karaboga [1], about the definition of the unconstrained weight optimization function, and to the steps needed to couple SAP 2000 with ABC via macros of Excel.
2.1. The original ABC algorithm
The ABC algorithm proposed by Karaboga [1] was initially applied to find global minimums of some complex functions. Since then, it has been applied to truss optimization problems with the inclusion of some modifications to enhance its performance [2-5]. The approach is based on the intelligent foraging behavior of honey bees in a given hive and surroundings. The best solution is accomplished by dividing the bee objects into different tasks. For this purpose, three groups of bees are used: employed, onlooker and scout bees. The location of each food source and the amount of nectar refer here to the design variables and fitness function of the problem at hand, respectively. Each food source corresponds to a possible solution of the problem and the best solution corresponds to the position of the most profitable source. In the truss optimization context, the bar areas and the self-weight of the truss are, respectively, the design variables and fitness function. In this paper, the fitness function is taken as the inverse of the weight of the truss [5] as will be shown later.
Employed bees leave the hive to search for promising food sources. Thereafter, they return to the hive to share their knowledge about a particular food source with their nest mates. Then, the profitability of the source is shared with a certain probability with the onlooker bees.
The exchange of information is guided by a probability based on the amount of nectar (fitness function) that an unemployed bee (onlookers or scout) will determine in a new food source in the neighborhood of its choice. Each bee that finds a solution becomes an employed bee, and when its supply is exhausted, it becomes a scout bee. The parameters of the ABC algorithm are the number of food sources (NS), which here is considered to be equal to the sum of the number of employed and onlooker bees, and the dimension of each solution vector D, which represents the number of groups of bar elements to be optimized. The steps of the algorithm are briefly described next. For further details, see reference [5].
Step 1: A initial random population is generated (x 1,… x NS), with x 1 = (x i1 , x i2, x i3, …. x iD) established as follows:

Where j = 1,2, …D, i=1,2…NS and x max-j , x min-j are the upper and lower bounds of the design variable j and rand [0,1] represent a random number between 0 and 1. After initialization of the population, the fitness of each food is evaluated.
Step 2: Beginning of the employed bee phase. Each employed bee searches the neighborhood of its current food source to determine a new food source in the following manner:

where k = 1,2,…NS and j = 1.2…D are randomly chosen indexes. It must be noted that subscript, k, in the last term of eq. (2) must be different from subscript i and rand [−1,1] represents a random number between -1 and 1. Values of v ij , which exceed their limit values, are set to their limit values.
Step 3: After generating the new food source (design variable), the amount of nectar it contains (fitness function) will be evaluated together with a greedy selection process. When, the quality of the new source is better than the current position, the employed bee leaves its position and moves to the new food source, i.e., if the fitness of the new food source is better than that of X i the new food source replaces X i in the population and becomes a new member.
Step 4: Beginning of the onlooker bee phase. First an onlooker bee selects a food source according to the information provided by the employed bees. The probability of selection of each food source, p i is determined by means of eq. (3).
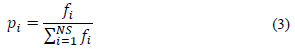
Where f i is the fitness value of the food source X i After selecting a food source, the onlooker bee generates a new food source by means of eq. (2). Once the new source is generated, it will be evaluated besides a greedy selection as in the case of the employed bee phase.
Step 5: Beginning of scout bee phase. If a candidate solution of food source cannot be further improved after a number of trials, this is abandoned and the associated employed bee becomes a scout, whose new food source is generated by means of eq. (4).

With j=1,2…D. The abandoned food source is replaced by a randomly generated food source by evaluating the fitness function. In the ABC algorithm, the predetermined number of trials for abandoning a food source is named limit. At most one employed bee in each cycle becomes a scout.
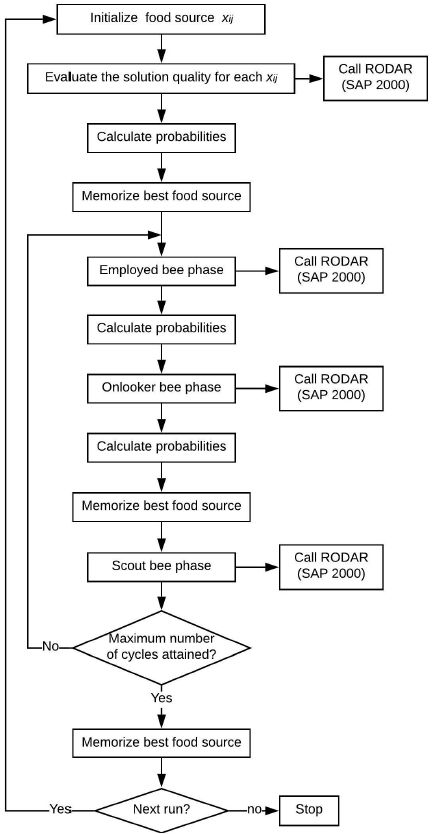
Step 6: If a termination condition is met, the process is stopped and the best food source is reported. Otherwise, the algorithm goes to Step 2, and an iteration cycle is established. The termination condition is defined here when a maximum number of iterations or cycles called MITER (predefined by the user) is reached. Often limit is taken as MITER/3 . For the studied examples MITER is arbitrarily chosen as 2000 iterations, while limit is 667. A flowchart of the ABC algorithm showing all the aforementioned steps is depicted in Fig. 1. The fitness function is evaluated by means of the subroutine RODAR, which will be explained in more detail in section 2.3, and where the structural analysis of the truss is carried out by SAP 2000.
2.2. Size optimization of trusses
The most feasible solution is defined as a solution which resists all external actions with the lightest weight, without incurring in any violation of the imposed constraints. Indeed, the weight optimization process represents the continuous modification of cross section areas, X ij ,of the members that compose a given truss, which in turn are subjected to constraints in terms of displacements and stresses. The corresponding optimization is formulated based on the following solution vector of areas X
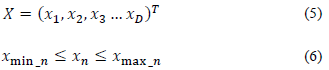
with n= 1,2,3…D, subjected to the following constraints:
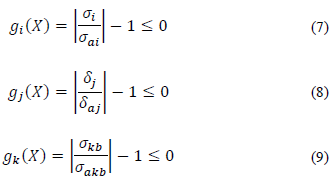
where subscripts are i, K =1,2,3,…NM,j =1,2,3…ND, and other parameters such as NMand ND represent the number of elements in the truss and the number of degrees of freedoms, respectively. In eq. (5), X is a candidate solution, X min_n and X max_n are the upper and lower limits of the design variable x n , and D is the total number of design variables. That is, x n represents the cross section area A n of the nth element, whereas g i ,g j and g k are the normalized constrained functions due to yield stresses, nodal displacements, and buckling stresses, respectively. Here, σ ai is the current stress in the ith element, σ ai is the allowable stress in the same element, δj is the displacement in the direction of the degree of freedom j and δ aj is the allowable displacement in that direction. Finally σ kb is the compressive stress in the kth element and σ akb is the associated allowable buckling stress. In this manner, the penalty function is defined by means of eq. (10)
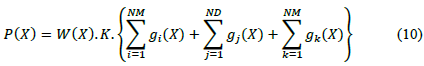
with,
where, A j ,Lj and p j are the cross section area, length and material density of the jth element, respectively. The variable W(A) is the weight of the truss, K is a penalty constant taken as 1.0, and gm with m= i,j,k represent the amount of violation of the corresponding constraint. Each time that a constraint is violated, the value of g m is activated, otherwise it is zero. Eq. (12) presents the objective function to be minimized in the process. Indeed, the constraint optimization problem becomes an unconstrained one by using the penalty approach [5]. The fitness function used in eq. (3) is then determined by 1/W(X)
2.3. Interface between SAP 2000 and ABC
During the size optimization, process the ABC algorithm evaluates a series of possible combinations until the best feasible solution is finally attained. During this process, the cross section areas of each bar change at each iteration. As a result, stresses and displacements in the truss are evaluated at each new combination. The Application Programming Interface (API) of SAP 2000 is therefore used to control the program, i.e., API allows users to write external applications in Visual Basic Application (VBA) to manage the graphical interface of the program. In the installation directory of SAP 2000, there exists a file named CSI_OAPI_Documentation [13], in which a list of commands is provided for this purpose. In this paper, a computer program is written in VBA via macros of Excel to couple SAP 2000 with the ABC algorithm. Input geometric and material property datasets of a given truss are read by means of Excel spreadsheets as depicted in Fig. 2. As may be observed, various tables are defined to read the complete input data. They are better visualized and explained in the following Figs. 3-6. For instance, the nodal coordinates of the truss, prescribed displacements and forces are defined in the table shown in Fig. 3.
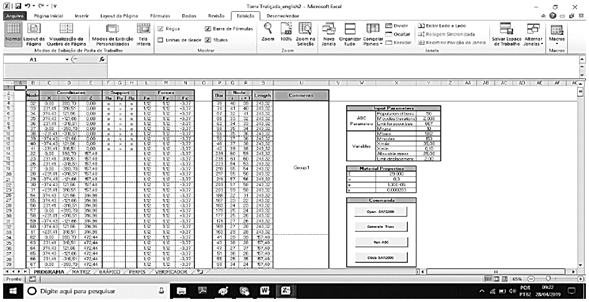
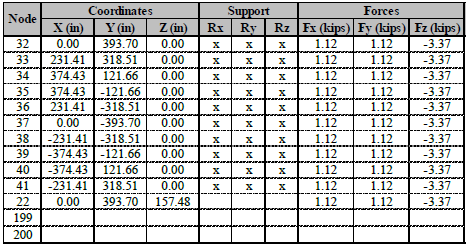
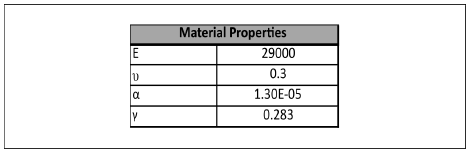
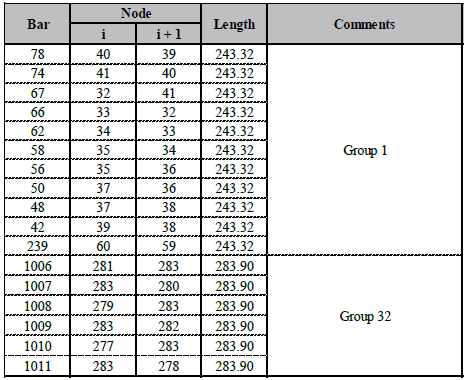
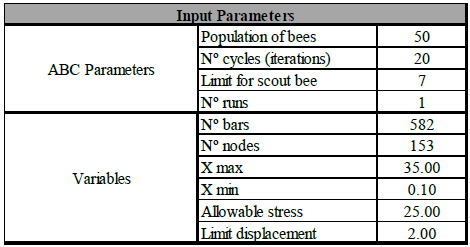
Nodal coordinates are defined in columns C, D and E of the current Excel spreadsheet for global coordinates along X, Y and Z directions, respectively. Meanwhile, corresponding restrictions are identified by a symbol “x” in columns F, G and H. Concentrated forces are specified in columns L, M and N for the loaded nodes. Furthermore, truss material properties are input into the table shown in Fig. 4, where E is the elasticity modulus of the material, v is the Poisson coefficient, α is the thermal coefficient and γ is the material density, whereas element connectivity is registered in columns Q and R in the table shown in Fig. 5. Finally, input parameters for the ABC algorithm are displayed in Fig. 6. For all the aforementioned data, units are input consistently.
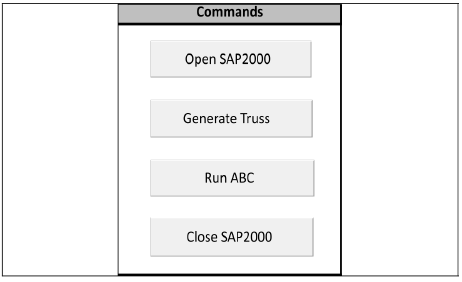
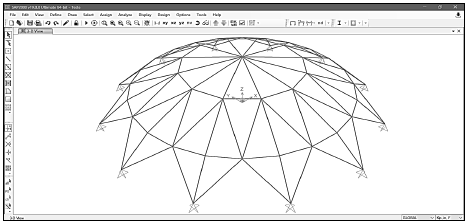
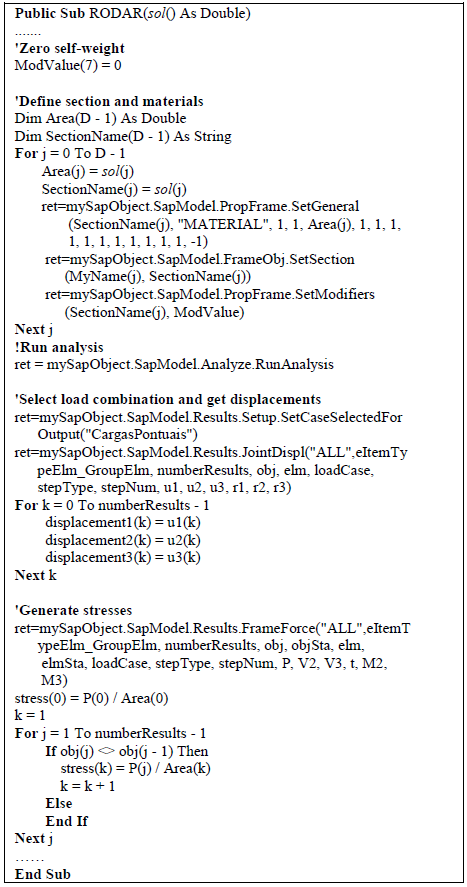
After the entire dataset is defined, the coupled algorithm is executed in sequence by means of the buttons displayed in Fig. 7. Firstly, the Open SAP 2000 button calls and opens the SAP 2000 program via macros, secondly the Generate Truss button is pressed to generate the geometry of the truss and the corresponding material properties are assigned to each element, see e.g., the created dome truss shown in Fig. 8. Next, the Run ABC button is pressed, and the ABC algorithm is executed following the flowchart depicted in Fig. 1. Finally, after all runs are executed, the SAP 2000 program is closed by pressing the Close SAP 2000 button. As an example, some sentences of the computer subroutine called RODAR used in Fig. 1 are listed next. This subroutine is permanently accessed by the ABC algorithm to evaluate the fitness function of the problem. Firstly, the solution vector sol(), which accesses as a double type variable, contains the randomly generated areas of the members according to eq. (1). This candidate solution sol() is assigned to the truss members during the first loop in the current iteration. Thereafter the SAP 2000 program is executed, and the corresponding displacements are computed for a given load case. Finally, internal forces are recovered and corresponding axial stresses are computed at each member in the final loop. Both displacements and stresses are then used to evaluate the constraints established in eq. (7), eq. (8) and eq. (9)
It should be highlighted that during the iterative process, the algorithm will call subroutine RODAR, n times at each iteration or cycle, with n being the total number of bees in the colony (NS). Thus, this subroutine commands the structural analysis of the truss by means of SAP 2000. For instance, the number of times that a given truss is analyzed in one computer run can be estimated by the following expression.
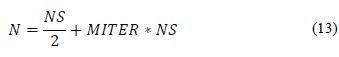
where N is the total number of analyses or evaluations of the fitness function in a given computer run for a predefined number of MITER iterations. Commonly, a given example is executed at least ten times [2-6] in order to verify the robustness of the algorithm, i.e., the obtained results should not change considerably from run to run. Furthermore, the total number of analyses in eq. (13) should be multiplied by the number of computer runs in order to assess the overall number of evaluations in a given optimization problem. During the analysis process, the coupled algorithm VBA-SAP 2000 proved to be time consuming, e.g., the optimization of a simple planar truss conformed by 10 bars with 400 iterations, and for one computer run took almost 4.5 hours on an average desktop computer. The excessive computational time reported by SAP 2000 is linked to the execution of other functions such as the creation of result tables, reports, display of deformed configurations, etc., all of which cannot be disabled during execution and are time consuming. This truly constitutes a limitation, which can be surpassed by means of parallel computing. Indeed, a similar conclusion is reported by Ghozi and co-workers [12], in which SAP 2000 was coupled to genetic algorithms for truss optimization. The advantage of the coupling is better highlighted when various PCs are used. It is inferred that the use of one single computer can still be allowed for some examples, but it can be forbidden for others. To speed up the validation process of the optimization tool, another conventional computer subroutine to solve truss structures was also coded together with the ABC algorithm. Corresponding comparisons and execution times for these two options are properly discussed in section 4.
3. Applications
In this section two examples with other numerical results for truss size optimization are analyzed to show the capability of the implemented tool. The first and second examples consider continuous and discrete variables, respectively, with the latter variables being defined within the internal dataset of SAP 2000. For all examples, the bee population is defined as 50 with a number of iterations equal to 2000 (MITER) and a scout limit of MITER /3
3.1. One hundred twenty-bar dome truss
The previous dome structure depicted in Fig. 8 is optimized in this section via continuous variables. The dome geometry can be described by three rings in the following manner. The first ring, which passes by all supports at the base of the dome, has a diameter of 1251.02 in (31.77 m) with zero elevation from ground surface. The second ring, which is located at 118.11 in (3 m) from ground surface, has a diameter of 984.252 in (25 m). The third ring has a diameter of 546.61 in (13.88 m) and is located at a height of 230.315 in (5.85 m) from the ground surface. The last node in the dome is the highest one with 275.591 in (7 m) in elevation and is submitted to a point load of -13.49 kips (-60 kN). Other point loads of -6.744 kips (-30 kN) and -2.248 kips (-10 kN) are applied at nodes passing by the third and second rings, respectively.
In total the dome has 37 nodes and 120 bar elements, all of which have been categorized in seven different groups. Bar elements of group one are defined by the connectivity of the highest node with those passing by the third ring. Groups two and five are defined by members located in the plane of the third and second rings, respectively. Members of groups three and four join elements from the second and third rings, respectively. Finally, elements from group six and seven join the supported nodes with those of the second ring. The minimum allowable cross section area of each member is limited to 0.775 in2 (5.0 cm2). The allowable tensile stress is 0.6 f y and the compressive stress is constrained by means of eq. (14).
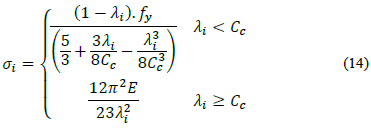
where f
y
is the yield stress of steel,E is the modulus of elasticity, λ
i
is the slenderness ratio (λ
i
=kL
i
/r
i
)k is the effective length factor, L
i
is the length of the member, ri is the radius of gyration and C =
 The material density is 0.288 lb/in2 (7971.81 kg/m3), f
y
= 58 ksi (400 MPa), E= 30450 ksi (210000 MPa) and ri =0.499Ai
0.677 for pipe sections, in which Ai is the cross section of the ith member. In this example, the displacement of all nodes is limited to ± 0.1969 in (±0.5 cm) for all directions. The results of the optimization are presented in Table 1, in which the best and worst results from ten independent runs are presented.
The material density is 0.288 lb/in2 (7971.81 kg/m3), f
y
= 58 ksi (400 MPa), E= 30450 ksi (210000 MPa) and ri =0.499Ai
0.677 for pipe sections, in which Ai is the cross section of the ith member. In this example, the displacement of all nodes is limited to ± 0.1969 in (±0.5 cm) for all directions. The results of the optimization are presented in Table 1, in which the best and worst results from ten independent runs are presented.
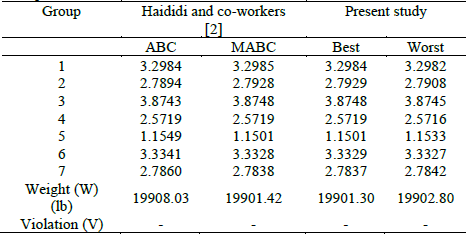
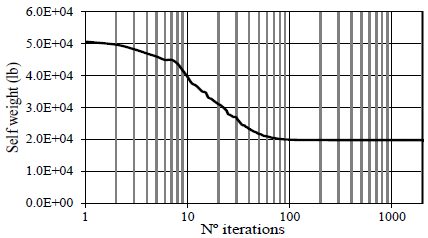
In addition, these results are also compared with other results [2], and then a good match is found for the final weight. The optimization history of the weight is depicted in Fig. 9. As may be observed, only 100 iterations are needed to practically obtain an optimized weight of 19901.3 lb (88.52 kN) without any violation of constraints.
3.2. Five hundred eighty-two-bar tower truss
In [5] the size discrete optimization of a tower truss of 582 bars is proposed. The geometry of this truss as created in a SAP 2000 environment is shown in Fig. 10. In total 32 groups are considered for size optimization. The tower has a total height of 3148.8 in (80 m), and its elliptical base defines two semi-axes of dimensions 10 m and 9.5 m. The steel has an elasticity modulus of E= 29000 ksi (200 GPa) and material density of p = 0.283 lb/in2 (7833.4 kg/m2). The maximum allowable stress in tension and compression is ±21.6 ksi (148.93 MPa), together with a limiting maximum displacement of ±3.15 in (8 cm) for all directions. Horizontal forces of 1.12 kips (5 kN) along the X and Y directions are applied to all nodes, meanwhile vertical forces of -6.74 (30 kN) and -3.37 kips (15 kN) are applied to all nodes in the upper and bottom part of the tower, respectively, along the Z direction. The solution is restricted to truss elements with slenderness ratios of 300 for tensile members, and 200 for compressive members.
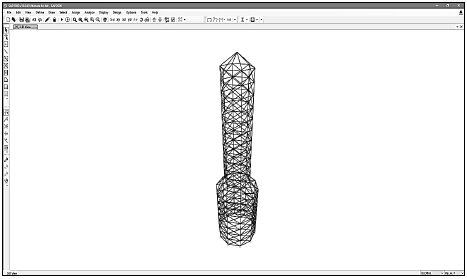
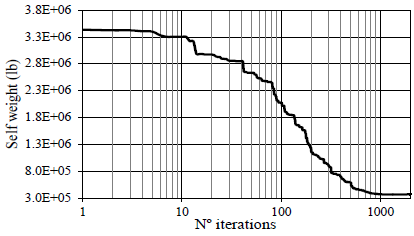
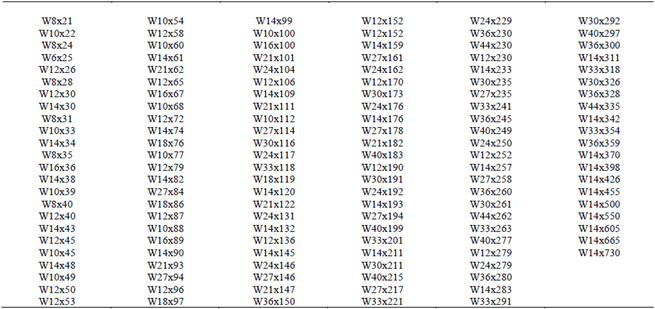
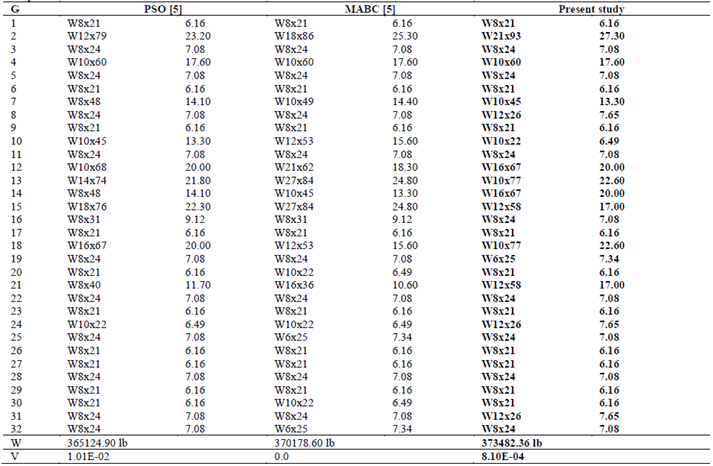
Table 2 displays 140 I-shape steel commercial sections obtained from the AISC database considered for the current optimization. The considered cross section areas are within the established minimum and maximum values of 6.16 in2 (39.74 cm2) and 215 in2 (1387.09 cm2), respectively. Fig. 11 displays the weight evolution of the tower with the increment of iterations. As may be observed, the convergence ratio to the optimal solution demands at least 2000 iterations to attain a stable solution. Meanwhile, the final optimized steel sections according to each group are listed in Table 3. Also, results of reference [5], in which a modified version of the ABC algorithm called MABC along with the results obtained from the Particle Swarm Optimization (PSO) algorithm, are presented for comparison. As expected, the current result of 373482.36 lb (1661.33 kN) is very close to the results reported in reference [5]. However, an excessive computational time is reported for the current example, in which only a single execution is performed. This resulted in a small violation of the imposed constraints of 8.1E-04. It is further believed that by using more iterations in the computation, this violation will be eliminated.
4. Discussion
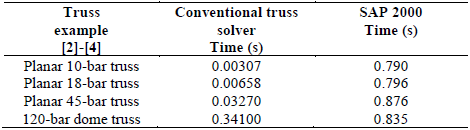
In this section, execution times for the coupled algorithm ABC-SAP 2000 are discussed for various benchmarks. For all examples a maximum population of 50 bees with a maximum number of 2000 iterations at each computer run is adopted. The efficiency of the numerical tool in terms of computational times is displayed in Table 4. All the analyses have been carried out in sequential executions by using a single computer with the following characteristics: Intel Core i5 processor with four cores of 3.10 GHz and 8GB RAM memory. The results correspond to the average times required for the evaluation of one objective or fitness function for various well-known examples found in the specialized literature [2], [4]. As can be seen, SAP 2000 computational times are greater than those from the conventional subroutine used to solve the truss problem. Nevertheless, SAP 2000 computational times are nearly constant independently of problem complexity. Conversely, the execution time increases for the conventional subroutine. This is explained because as the complexity of the problem increases, i.e., the number of unknowns augments, the SAP 2000 solver of linear equations is more efficient than the solver of the conventional subroutine. But, in general it is clearly stated that to take complete advantage of the implemented tool, parallel computing is required to speed up the process. For instance, the required computational time for the optimization of the dome truss for one single run in SAP 2000 is approximately (50/2+2000×50)×0.835/3600 = 23.2 hours (almost a day) for 2000 iterations and 50 bees according to eq. (13).
5. Conclusions
In this paper, a procedure is presented to combine the well-known optimization algorithm ABC with SAP 2000 commercial software via Visual Basic of macros in Excel. The resulting tool is then applied to size optimization problems of spatial trusses subjected to imposed constraints, which are expressed in terms of limiting stresses and displacements. The size optimization can be successfully applied to either continuous or discrete variables. The following conclusions can be drawn from this study.
In this initial stage of the study, the coupling between SAP 2000 and ABC proved to work well and seems to be promising because a real advantage of the commercial software potential can be exploited. Then, applications involving dynamic and plastic analysis can be further studied.
In order to improve execution times for challenger applications, parallel computing via several PCs certainly will speed up the optimization process. Thus, this task constitutes the natural step to be accomplished in future studies.
In its current form, the resulting tool certainly can be used in design offices by practitioners to optimize moderate trusses, thus, minimizing the costs of real projects.

