


 English (pdf)
 Article in xml format
 Article references
 Send this article by e-mail
 Cited by SciELO
  Cited by Google
  Similars in
SciELO
Similars in
SciELO  Similars in Google
 Permalink
1. Introduction
The need for increasingly diverse products has demanded increasing flexibility from companies in response to customer needs. Therefore, manufacturing industries, facing the trend of high variety and smaller production volume, have adopted the custom manufacturing mode. Therefore, they only start production after the order has been entered with the required characteristics. These industries usually have cut stocks and the production process starts from the arrival of a project on demand and individual characteristics. Thus, the inventory cutting step is the first operation that promotes subsequent ones [1].
An appropriate cutting plan can lead the company to reducing costs of material, waste as well as reducing order lead time. Losses in cutting processes are aspects that must be taken into consideration from both the environmental perspective, due to waste generation, and the economic one, regarding the reduction of waste in the production process [2].
According to Cherri et al. [3], harnessing waste from the cutting process is common for organizations due to the significant financial impact it can have, especially when the cost of raw material is a considerable part of the total cost of production composition. Thus, it is evident the need for a cutting planning, whose leftovers are avoided as much as possible and not discarded.
Several studies address the use of optimization models applied to the cutting problem [3-12]. In this context, this paper aims to apply and test a one-dimensional bar cutting optimization model in a company of the aluminum frame segment using three objective functions, in order to reduce the leftovers from the bar cutting, as well as the number of bars used for the door production process. The optimization model adopted in this work is the one proposed by Abuabara and Morabito [8] for the one-dimensional bar cutting problem, since it considers the leftovers of the process and allows classify them as reusable and leftover that becomes loss. In this study, the latter becomes aluminum scrap.
Three objective functions were used in simulations for the same model. The first one considers the minimization of the loss that is considered scrap. The second one considers the minimization of the amount of bars used. The third one combines both possibilities, seeking to minimize the amount of leftovers that is considered scrap, but offering an increase in the value of the objective function as the number of bars used rises. Based on the results obtained in the simulations, discussions were made about the advantages and disadvantages of each of the objective functions used during the simulations. Data were collected from a company that produces aluminum frames, where there is a need to establish cutting plans from a stock of bars.
Three scenarios were addressed in the simulation, where the number of necessary cuts varied, while the stock of bars remained fixed. Optimizing the use of bars directly impacts the company's performance, since aluminum is purchased per kilo, and what is not used is returned for extrusion, causing a loss.
2. Theoretical background
The problem of one-dimensional cutting is making an object available for production by making cuts on it in order to meet a specific dimension demand [4,13]. The cutting process refers to obtaining smaller items from cutting a larger matrix using cutting patterns or decision elements [5,14].
Cherri et al. [3] point out that the use of appropriate strategies and models for cutting problems enables the reduction of costs related to this process. Benjaoran et al. [4] mention that it is possible to minimize the stocks used and, consequently, reduce material loss. Several studies [6-9] address the cutting problem by using one-dimensional and two-dimensional approaches.
One of the common goals in the one-dimensional cutting problem is the reduction of leftovers. However, Wäscher et al. [15] point out that most cutting problems can be classified into input minimization problems, in which one seeks to minimize the amount of resources needed to achieve a goal, and production maximization problems, in which certain (limited) resources should be used to provide the best possible result.
The cutting problem has gained attention in various sectors such as the metal, paper and glass industry [1], and has been addressed from the viewpoint of both the problem [10,12] and the technique for its resolution [5,11].
Reinertsen and Vossen [10] dealt with the cutting problem by taking cutting stock and order lead time into account. Stadtler [12] presents a case of an aluminum profile manufacturer that provides its customers with the service of calculating the minimum number of aluminum profiles of a given standard length, so that the demand for lengths in orders is met. By using the Packaging-problem model, the manufacturer was able to generate optimal solutions for a large number of cutting-stock problems.
Yanasse and Lamora [5] adopted a Lagrangian approach aiming to solve a cut pattern sequencing problem, while Cui et al. [11] developed a heuristic algorithm for the one-dimensional cutting problem with usable leftovers.
3. Mathematical modeling
An ideal cutting plane is a key piece for companies working with aluminum profiles for door and window production. With a stock of bars, managing their use can help reduce leftovers in cutting planes. As much as leftovers can be sold as scrap again, the costs of included services rise and an amount of aluminum is lost. Thus, a cutting plane with minimal leftovers financially impacts the values lost with this material.
The one-dimensional cutting-stock problem occurs in various industries. The most common are metal, paper, textile and wood industries [16]. Mathematical Programming can be used to solve a number of real complex problems, allowing the integration of a mathematical model supported by computational tools, as highlighted by Leão et al. [17].
The mathematical model described here was used to create a cutting plane using data from a company that produces aluminum frames. Aluminum bars are purchased in large batches in predefined sizes. From the available stock, when an order is received by the project department, it is necessary to decide how many and which bars to cut. The model takes into account a technical design issue: there is a minimum lenght value from which a piece of leftover from a bar cut can no longer be used, becoming scrap.
In order to apply the model, the profile bar stock must have sufficient material to meet the demand. Since the bars are purchased in predetermined sizes, the length of the pieces to be cut is limited to the length of the bars. These features are present in the application scenario and, therefore, the model proves to be feasible.
3.1. Model parameters and variables
The model proposed by Abuabara and Morabito [8], applicable to the problem of one-dimensional bar cutting, takes into account the leftover bars after the cutting process, and allows to classify these leftovers into reusable parts or losses. By losses we refer to leftovers less than an N length. This lenght value is a parameter of the model. Scraps larger than N are considered parts that can be used in a new cutting process.
To understand the model, it is necessary to define the indexes presented below.
i= 1,…, m: demanded profile piece
j= 1,…, n:: stock profile bars
The model considers the following parameters:
b j : bar length j in stock;
d i : quantity of profile piece demanded i;
l i : length of profile piece demanded i;
M: very large value;
N: minimum length to be considered as surplus;
R: maximum number of leftovers.
The value of M assumes the value of a sufficiently large number, which in this article will be calculated by, M= max j {b j }- min i {l i },that is, the value of the largest bar minus the value of the smallest profile piece [8].
The decision variables used in the model are presented below:
δ j : bar leftover value ;
t j: bar loss value i;
z j : binary variable indicating whether bar j will be used (z j =1) or not (z j =0);
u j : binary variable that indicates whether bar j has leftover (u j =1) or not (u j =0);
x ij : quantity of demanded profile piece i allocated in bar j.
3.2. Functions purpose of the ILP model
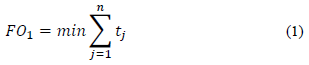
In this study, we chose to carry out a comparative analysis among three objective functions. The first function, F0 1, (Eq. 1), which is described below, is intended to reduce the amount of leftovers generated. As shown in Eq. (1), this objective function sums the amount of losses observed for each bar.
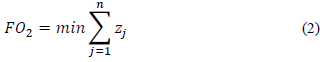
The second objective function F0 2, (Eq. 2) is characterized by the minimization of the number of bars used in the cutting plane, defined as follows:
The objective functions F0 1 and F0 2 can be combined into a single objective function. The objective function F0 1 remains the main objective of the model, that is, the reduction in material loss, while F0 2 enters the objective function with a penalty which, in this case, is the reduction in number of bars. As observed in a study [8], a multi-objective function which minimizes loss, while also providing a penalty for the number of bars used, generates the third objective function, F0 2Eq. (3), considered in this paper.
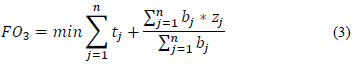
As for F0 3, as the input parameters of the model are assumed to be integers, the first term of this expression will always be an integer, that is, total compensation loss. Therefore, since the second term always generates a value between 0 and 1, this term disables minimal loss alternative solutions in favor of solutions that minimize the total length cut of the object [8].
3.3. Model Restrictions of ILP
Model constraints are described below.
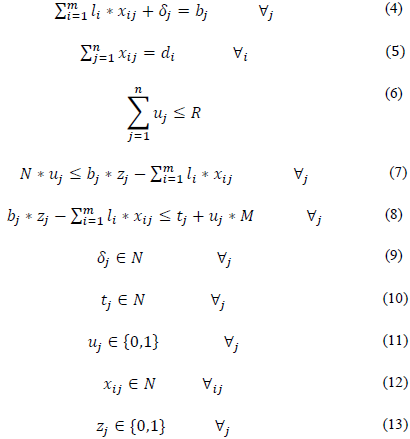
Eq. (4) ensures that bar length will be respected by determining that the sum of the amount of each profile piece added to the leftover is equal to the size of the bar. Eq. (5) ensures that the demand will be met, showing that the number of pieces from each bar is equal to the demand placed. Eq. (6) ensures that the amount of leftovers will be limited to parameter R. Eqs. (7) and (8) make up the set of restrictions related to leftovers. Eq. (7) verifies that the minimum size defined as N is less than or equal to the unused length. Eq. (8) ensures that the unused bar length is less than or equal to the sum of the loss with parameter M. Eqs. (9), (10), (11), (12) and (13) represent the domain of variables.
4. Results
4.1. Data collection
Data were collected from an industry of the metal-mechanical sector, which uses, among other items, aluminum profiles in the production of frames. The input is purchased prior to the orders due to supplier lead time. Thus, there is a certain number of bars stocked to be cut when an order is received. The raw material is purchased in predefined sizes and stocked to feed a make-to-order production system.
Production orders are issued according to purchase orders. When a production order or a set of grouped orders is released for production, one wants to optimize the use of stock inputs. Aluminum is purchased in bars of predetermined length. The problem is cutting the aluminum into smaller pieces, which will make it possible to assemble the frames. Loss is intended to be minimal. The cost of raw material, purchased per kilogram regardless of bar length is not considered as a parameter in this model. There is a production order with demands for items and lengths to be cut, as shown in Table 1.
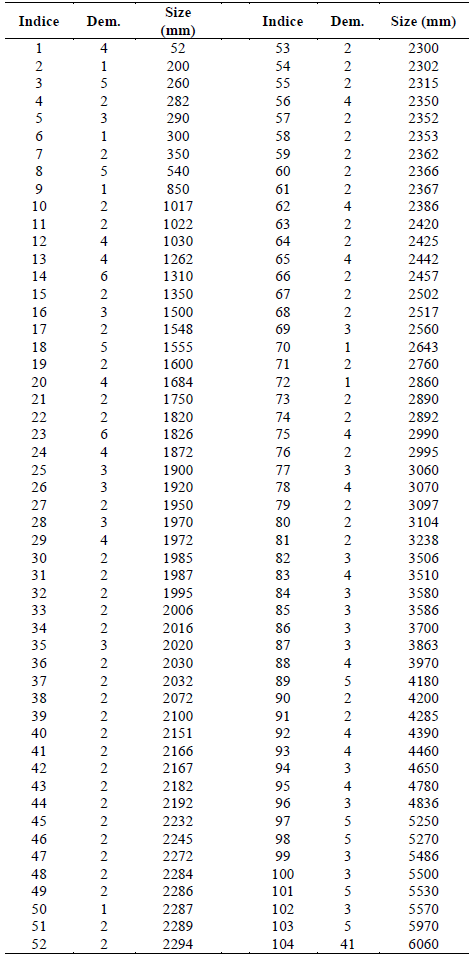
As the stock was large enough to meet the bar demand in the cutting process, we considered a case in which there were 170 bar units of 6.1 meters and 190 bar units of 5.1 meters, totaling 360 bars in stock. It is essential that the cutting pieces do not exceed 6 meters, which is the size of the largest bars in stock. For this study, reusable bars are those whose leftovers are larger than 500 mm, otherwise they are considered as scrap.
4.2. Model implementation
The model described was implemented with Solver Gurobi version 8.1.1, using the Anaconda Python Distribution 3.7. A 64-bit Microsoft Windows 10 operating system was used, operating on 4 GB RAM with an Intel Core I5-2450 processor, which has 2 processor cores, 4 threads, 2.50 GHz processor-based frequency.
4.3. Deployment scenarios
Three scenarios were considered to analyze the behavior performance of objective functions. In the first one, only the 52 smallest items were considered, keeping the demand. In this case, there will be a surplus of bars in stock to establish the cutting scheme, and it is important to observe the performance of the objective functions concerning the number of bars used and process losses. The R value, which represents the maximum number of bars to be used, was equal to the total of 360, thus allowing the free use of bars.
Next, we considered two new scenarios in which the demand approximates the totality of bars in stock. With that, we sought to analyze the performance of objective functions when the gap that exists between the available bars and the present demand in the production order is decreased.
The second scenario considers all 104 items, but the demand for each item has been halved. In cases where the demand value was odd, the next integer was considered higher than a half. The third scenario considers the actual production order contained in Table 1. In all scenarios the number of bars in stock was maintained.
For each scenario, the purpose of the optimization function was changed: minimizing total loss (F0 1) minimizing the number of bars used(F0 2) , minimizing both loss and the number of bars used at the same time(F0 3). (Then, the performance of the objective functions in each scenario was analyzed in relation to the number of bars used and the amount of loss associated with the cutting scheme.
4.4. Results and discussion
The structuring of the model allows the elaboration of a cutting plane, in order to identify which piece will be cut from each bar. It also provides information on the number of stock bars and bars required for production, the amount of total loss identified, as well as the sum in millimeters of the material that became reusable. The detailing of loss and reusable parts is in the cutting plane, which also specifies from which bar a particular piece will be cut.
Table 2 presents the results for the three proposed scenarios. For all scenarios, the Solver was able to find an optimal solution within the proposed parameters. However, each function can be applied to different situations depending on the company's objective and strategy.
Table 2 Proposed scenarios.
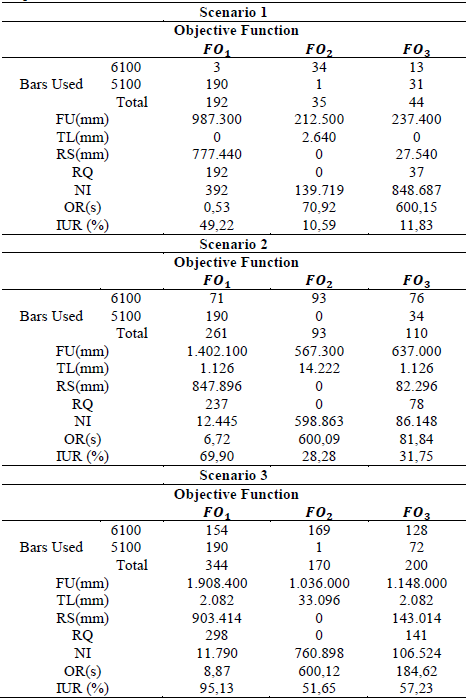
FU: Footage Used, TL: Total Loss, RS: Reusable Surplus, RQ: Reusable Quantity Surplus, NI: Number of Interactions,
OR: Optimization Runtime and IUR: Inventory Utilization Rate in mm.
Source: The Authors.
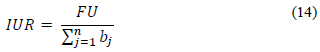
Inventory Utilization Rate IUR corresponds to the percentage of material used in stock, given by Eq. (14).
To analyze the performance of the objective functions in each scenario, four graphs were generated. Fig. 1 shows the number of bars used per scenario. In all scenarios, the largest number of bars used was observed in F0 1, with high quantity in relation to the other two F0 2 used less bars than F0 3 , and this difference tends to rise as the gap between the number of bars in stock and the demand for parts decreases. Fig. 2 shows the bar footage used in each scenario. In all scenarios, we noticed that F0 1 consumed larger footage than the other two.used less footage than F0 3 and this difference tends to rise as the gap between the number of bars in stock and the demand for parts decreases.
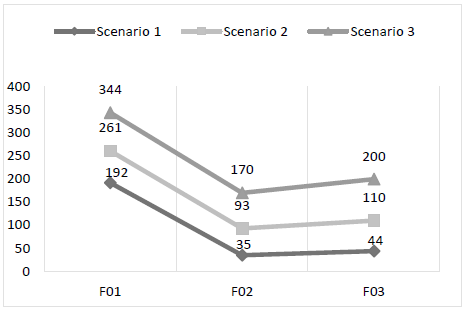
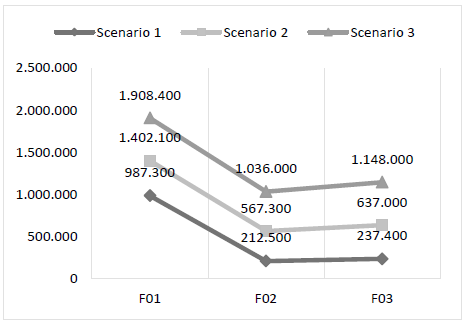
Fig. 3 illustrates the amount of interactions per scenario. In this case, F0 1 required the least amount of interactions; F0 2 increased the number of interactions as the gap between the number of bars in stock and the demand for parts decreased. F0 3 presented a higher number of interactions when there was a higher gap between the number of bars in stock and the demand for parts. Also, a decrease in the number of interactions was observed as the gap between the number of bars in stock and the demand for parts decreased.
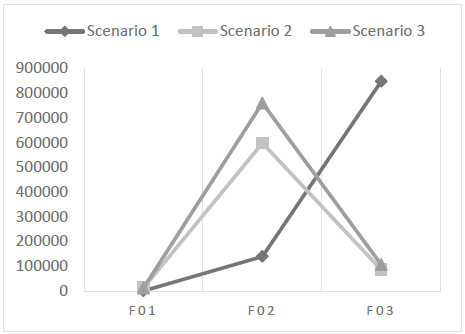
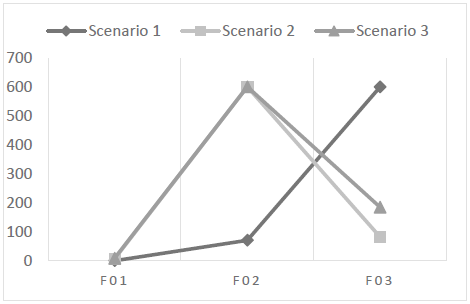
Fig. 4 shows the runtime per scenario.F0 1 required the shortest runtime. Runtime in F0 2 rose as the gap between the number of bars in stock and the demand for parts decreased. F0 3 had a longer runtime when there was a higher gap between the quantity of bars in stock and the demand for parts. A decrease in runtime was also observed when the gap between the quantity of bars in stock and the demand for parts decreased.
Objective function F0 1 demanded a significantly higher number of bars compared to the others in all scenarios, also consuming larger footage. This can be explained due to the fact that F0 1 is intended to minimize loss only. In all three scenarios, a null or almost zero loss was obtained, but it caused higher consumption of bars and footage. Consequently, the usable surplus was also high, which for the production process in question was considered a disadvantage, taking into account an analysis of future material needs. One advantage of this function is that, in all scenarios, it used fewer interactions and less runtime. One possible application of this function to the model is to determine if the cutting stock can meet demand.
Objective function F0 2 presented the best result when analyzing the quantity of bars consumed and footage used. On the other hand, it resulted in a larger amount of loss, or non-reusable material. For the production process, high material losses become monetary losses due to the amount paid to manufacture the profile, which acquires scrap value. The number of interactions rose as demand approached total bars in stock. The same happened with runtime. This function can be used in specific projects when one wants to keep in stock as many un-sectioned bars as possible.
Objective function F0 3, showed an equivalent loss compared to F0 1 but with significant advantage concerning the number and the size of bars used, which was smaller. Although F0 3 used more bars and larger footage than F0 2, it was able to distribute the cuts to minimize losses without using a high number of bars. The number of interactions was higher when there was a higher gap between the number of bars available and the demand. When the demand approached the total available bars, the number of interactions was well below the total identified in F0 2 The same applied to runtime.
For the production order in question, represented by scenario 3, F0 3 was adequate from the viewpoint of the quantity of leftovers and the amount of losses. When there are pieces that cannot be used, all unused material is turned into aluminum scrap and a monetary value is lost. The leftover bars, in this case, are large enough to be used in other projects, so they are not considered scrap. These leftovers come in a satisfactory quantity, thus, other projects can absorb them.
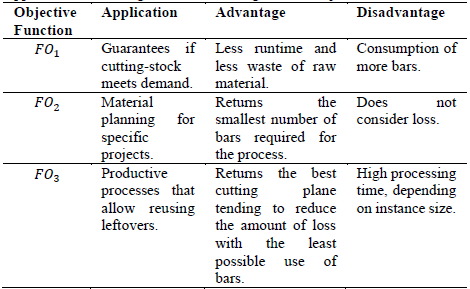
In some contexts where there is no certainty to use leftovers in further projects, F0 2 provides a contribution to the bar cutting plane that should be considered, since it minimizes the number of bars used in this process, even generating some losses. In any case, leftovers can be lost if not used at other times. Table 3 shows an overview of applications, advantages and disadvantages of the objective functions.
The penalty in the objective function of [8] guarantees two advantages in the bar cutting process when the intention is working with the use of leftovers, because it results in the least amount of losses. For the company, the first advantage ensures avoids the generation of waste considered losses during optimization, and generates reusable pieces for later production. The second advantage is that the sale price of the waste considered loss is relatively lower than the purchase price of the bar aluminum bar used in the process. Thus the smaller the material loss, the more effective the productive and financial process will be.
5. Concluding remarks
Mathematical modeling contributes to the optimization of one-dimensional cutting planes, increasing the efficiency and performance of the production process. In this work, the mathematical model by Abuabara and Morabito [8] was applied to a cutting plane of a metalworking company that needs to cut aluminum bars for the production of frames.
The mathematical model adopted allows the use of several objective functions. In this case, three distinct objective functions were analyzed. The adoption of a specific objective function depends on the rules, characteristics, and specific needs of the company. The comparative analysis of three objective functions showed that the combination of an objective function that minimizes losses with a penalty for the number of bars used provided more adequate results for the specific case of the plane studied than the individual use of these approaches.
Data on limitation of leftovers quantity, represented by the R value of the model, were not described in this study. This value tends to modify the objective functions performance, which represents a limitation for the analyses. The mathematical model proved to be feasible for the considered instances, and cutting planes with larger instances can have a significant impact on runtimes or on the number of interactions. Future research points to the need to consider the size of the cutting blade in process losses. Future work points to the need to consider the size of the cutting blade in process losses.

