


 Inglés (pdf)
 Articulo en XML
 Referencias del artículo
 Enviar articulo por email
 Citado por SciELO
  Citado por Google
  Similares en
SciELO
Similares en
SciELO  Similares en Google
 Permalink
1. Introduction
In Colombia, wild fruits such as agraz (Vaccinium meridionale Swartz) have important advantages and great potential to be part of free trade agreements as substitutes for illicit crops and in general a significant demand in the national and international market. This fruit has high technological potential due to its different industrial applications, such as antioxidants, natural aromas, and flavors, colors, etc. Certainly, Colombia could become one of the largest exporters of this product in the long term, considering that it is the only country with two harvests per year (June and December) [1]. In 2014, the production of agraz was approximately 1400 t, with a growth of 66% with respect to the previous year [2]
This increase in production demands special attention due to the development of already existing postharvest techniques and the application of new technologies to comply with consumer demands. The commercial quality of an agricultural product is a highly relevant factor, since it includes its sanitary aspect, organoleptic characteristics, nutritional value, and physical-mechanical properties. Consequently, the processes of classification and selection of fruits and vegetables are a necessity. Grouping the product in homogeneous batches has advantages such as: allowing the farmer and the seller to provide a product that meets the demands of the market; making the marketing system more efficient by allowing the consumer to choose the quality they want; making it possible for the product to be treated properly according to its state of maturity; and price management is more reliable [3].
Non-destructive techniques such as near-infrared spectroscopy turn out to be simple, versatile, with low-cost per sample and high response speed. These characteristics allow it to be incorporated into production lines, making the processes of selection and classification of different products more efficient [4]. Several studies have been reported, in which this technique is used for classification of grapes, kiwi, apples, orange, mango, among others, according to their state of maturity, phytosanitary status or presence of abrasions and mechanical damage [5-8]. However, these measurement techniques are accompanied by chemometric methods such as principal component analysis (PCA), partial least squares discriminant analysis (PLS-DA) and Soft Independent Modeling of Class Analogy (SIMCA) [8-10]. Considering the foregoing, the aim of this research is to evaluate the capacity of NIR spectroscopy as a classification tool for agraz, according to its state of maturity.
2. Materials and methods
2.1. Vegetal material
The vegetal material come from the Municipality of San Miguel de Sema (Boyacá) with geographic coordinates 5 ° 31'04 "N and 73 ° 43'22" W. 8 kg of agraz (Vaccinium meridionale Swartz) were used, from which 5 kg were harvested in the village Siatiba Alto and 3 kg in the village El Lirio. The area corresponds to an oceanic climate Cfb (Köppen classification). It was sought that the product was in a state of uniform maturity 3. Once in the Laboratory of Agricultural Products Postharvest of the Department of Civil and Agricultural Engineering of the Universidad Nacional de Colombia, the fruit were classified and selected considering their phytosanitary status. The product batch was distributed in 400 groups of 15g ± 5 g to take spectral measurements. All the groups were packed in air pack boxes, marked and stored at room temperature. These conditions were not controlled, however, an average temperature of 19.3 ° C and a humidity of 60% was recorded during the storage period.
2.2. Spectral data acquisition
To collect the spectral data in the VIS-NIR region (350-2500 nm), a spectroradiometer was used (FieldSpec 4 Hi-Res scans every 100 milliseconds a spectral resolution from 3 to 8 nm, USA), with an optical fiber of 10 mm of outlet diameter and a halogen light source. For each sample, three readings were made with the spectroradiometer.
2.3. Spectral data processing
The classification of agraz samples was carried out under states 3, 4 and 5 of maturity, according to the classification proposed by [11] where maturity state 3, corresponds to a 100% red surface, maturity state 4 to a 100% purple surface and maturity state 5 to a 100% dark purple surface. The calibration set was composed of 61 agraz samples for state 3 (measured on day 1), 125 samples for state 4 (measured on days 7 and 13) and 77 samples for state 5 (measured on day 17) for a total of 263 samples. The validation set had 91 agraz samples, among which there were 22 samples for the state of maturity 3, 46 samples for the state 4 and 23 for the state 5.
As a first classification tool among the three maturity stages, a principal component analysis (PCA) was generated, which allows identifying patterns of differentiation between the samples and evidencing different groups in the same population [8]. From this analysis, loadings were obtained as a tool to identify representative wavelengths in the components of the model and the score plot as a tool to visualize possible subgroups or similarities within the group of samples [12]. The cross-validation method and the external validation method were used in the construction of the PCA model.
The model in a PCA analysis corresponds to the matrix array according to the eq. (1) [13]:

where X is the PCA model, T is the scores matrix, PT is the transposed loadings matrix and E corresponds to the model error.
Once the three maturity stages were identified, a PCA model was developed for each of them in order to use the SIMCA methodology (Soft Independent Modeling of Class Analogy). This methodology corresponds to a supervised pattern recognition technique of a population where several PCA sub-models are created for each class and their limits are calculated. These sub-models are used to classify new samples and identify the discrimination capacity of the wavelengths for each group [14].
Prior to the construction of the models, the first and second derivatives were applied as pretreatment to the spectral responses, to correct dispersion and noise effects. All these statistical analyses for the spectral responses and the construction of models were made with the help of the multivariate statistical software The Unscrambler X 10.4 (CAMO Software AS, Oslo, Norway).
3. Results and discussion
3.1. PCA models
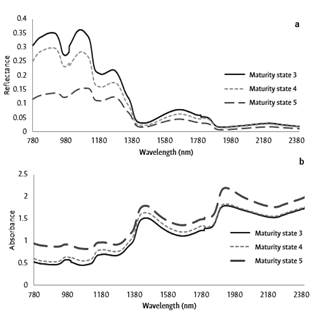
The spectral track for the three agraz maturity states is shows in Fig. 1. It was evidenced that all the maturity states have the same peaks around 900 nm, 1062 nm, 1258 nm and 1648 nm for the reflectance spectrum and in the case of the absorbance spectrum the peaks correspond to 962 nm, 1155 nm, 1425 nm, and 1906 nm; but with different intensities for the values of reflectance and absorbance depending on the state of maturity. Regions close to 970nm, 1400 nm, and 1900 nm correspond to the water absorption bands and regions around 1170 and 1300 nm are related to the presence of CH groups and sugars [15-17]. During the storage period, the fruits presented a loss of water in response to the respiration and transpiration processes, which means a loss of weight [18]. For agraz, between the states of maturity 3 and 5, there is a gradual and significant change in the epidermis coloration of the fruit going from a red to a dark purple color [11]. Thus, in the spectrum, it is possible to observe that the samples in state 3 reflect more light than they absorb, compared to those in state 5, which absorb more intensity of light for being darker (Fig. 1).
Source: The Authors.
Figure 1 Spectral responses for the three stages of maturity of the agraz fruit. a. Reflectance spectrum and b. Absorbance spectrum.
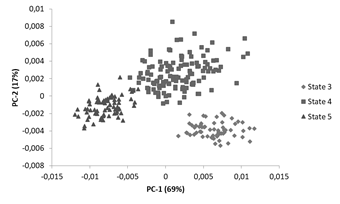
From the comparison chart of the first two main components for the agraz samples, it is possible to observe that the maturity stages 3, 4 and 5 are easily differentiable under 86% of the explained variance of the sample. With the first main component, it is possible to discriminate easily between states 3 and 5. For example, samples with higher moisture content, stiffer and reddish are found on the right (PC-1 positive) and fewer stiff samples, dark purple color and with lower moisture content are observed on the left (PC-1 negative). Similarly, with the second main component, it would be possible to distinguish in a certain way between state 3 (in the lower part, PC-2 negative) and state 4 (upper part, PC-2 positive) (Fig. 2). Results reported by [19] show similar behavior for samples of passion fruit in different stages of maturity under a principal component analysis.
Source: The Authors.
Figure 2 Score plot from the PCA analysis for the three maturity stages of agraz.
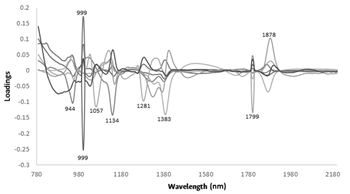
It is possible to know the contribution of each wavelength to each of the main components of the PCA model from the loadings (Fig. 3). The peaks are evident in the characteristic bands of water presence, around 999 nm and 1400 nm, and the peaks close to the absorption bands of groups C-H are around 944 and 1878 nm [17]. These wavelengths turn out to be significant in the change from the state of maturity 3 to the state of maturity 5 in agraz. Once again, the idea is reinforced that the fruit moisture content during the storage period decreases and that its content of total soluble solids - TSS increases [20].
3.2. SIMCA models
Table 1 shows the percentage of samples of the validation set that are successfully classified under the three maturity stages with the help of the SIMCA technique. In total, 3 models were built. The first one corresponds to a classification model that involves the three stages of maturity, which can be classified with 81.32% accuracy among the three maturity stages. However, this model is more accurate to classify samples in states 3 and 4 (with 81.82% and 95.65% respectively) than samples in state 5 (52.17%) (Table 1). For this reason, it is decided to elaborate two more models that classified only into two states of maturity. Model 2 corresponds to the classification of samples into maturity stage 3 and 4. In this case, it is possible to classify with 91.18% success in general and with greater precision samples at maturity stage 4 (95.65%) (Table 1). Model 3 corresponds to a classification model between states 3 and 5 with 93.3% success and with greater precision for samples in state 5 with 95.65% (Table 1).
Table 1 Percentage of correct classification for the three maturity stages of agraz.
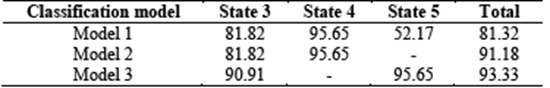
Model 1: State 3, 4 and 5, Model 2: State 3 and State 4 and Model 3: State 3 and State 5.
Source: The Authors.
In the classification of tomatoes according to their stage of maturity, [7] obtained models with better precision to classify tomatoes in green state individually, than classification models that involve the three stages of maturity (Green, pink, red), using SIMCA as a classification methodology. In the case of fruit discrimination models with some type of mechanical damage or abrasion, [8] report 86.49% accuracy to classify Longo (Dimocarpus longan) samples with some type of damage or change in their surface.
As an example of the agraz case, the practical use of the classification models could be as follows (Fig. 4): There is a batch of ungraded agraz, if the model 3 is used, samples in maturity stage 5 or not can be distinguished with a precision close to 100%. If this is not their maturity stage, model 2 is used to classify them in a state of maturity 4 with 95.65% accuracy, to finally know if this sample is in state 3 or state 4 of maturity.
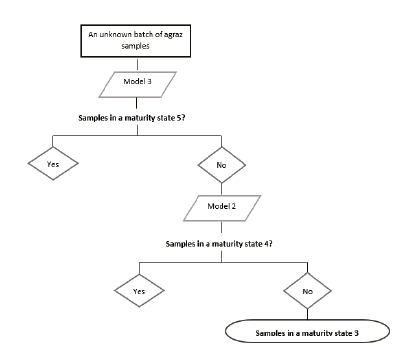
Source: The Authors.
Figure 4 Example of application of the classification models of maturity stages for agraz.
It should be noted that the methodology of discrimination of variables is one of the simplest and most basic and that there are others that involve partial least squares or neural networks.
It is possible that the use of these techniques and of a larger number of samples in the calibration set allow to improve the results of model 1.
4. Conclusions
The technique of NIR spectroscopy seem to work well as a classification tool according to the state of maturity for agraz. For states of maturity 4 and 5, it is possible to obtain 95.65% accuracy in the classification. However, it may be useful to use other classification tools to obtain more robust models of discrimination of agraz samples for the three stages of maturity.
Similarly, there are differences in the spectral signatures of the three maturity stages for agraz. The effect on the spectrum of the change of tone from red to purple turns out to be stronger than the change in the moisture content. The change in epidermis color is one of the most characteristic variables of the fruit in terms of classification parameters.
The construction of a classification model and the use of technologies such as NIR, encourage continued research in this type of fruit, however, to guarantee the reproducibility of the model as well as its robustness, it is necessary to consider agraz samples from different regions of Colombia and with different harvesting cycles.

