


 English (pdf)
 Article in xml format
 Article references
 Send this article by e-mail
 Cited by SciELO
  Cited by Google
  Similars in
SciELO
Similars in
SciELO  Similars in Google
 Permalink
1. Introduction
Concrete is the most popular material in civil engineering. Its applications include buildings, industrial structures, bridges and dams. Every day the concrete is improving, to reach better characteristics. In this line, French Company BOUYGUES first developed a new type of ultra-high-performance cement based composite material-known as reactive powder concrete (RPC)- with ultra-high compressive strength due to its ultra-dense structure [1,2]. Improved durability is another feature of RCP [3,4].This material, presented in the 90´s by Richard and Cheyrezy [1], contains over 800 kg/m3 of Portland cement (C), and high amounts of silica fume (SF), quartz powder (QP), silica sand (SS) with a maximum size of 600 μm, high-range water reducers polycarboxylate-ether-based superplasticizers (PCE), and sometimes steel fiber [1,5,6] In recent years, RPC has already been successfully applied in the field of engineering construction, due to its high mechanical properties and excellent durability.
However, because of the high contents of cement, quartz sand, and silica fume used, the cost of RPC is considerably higher than conventional concrete, which limits the extent of its application [7]. Therefore, considering that the high cost of RPC is a disadvantage that restricts its wider usage, some supplementary cementitious materials such as limestone powder (LP) and industrial by-products such as ground granulated blast-furnace slag (GGBFS), fly ash (FA), and glass powder (GP), inter alia, have been used as partial cement replacements. For example, the influence of the contents of blast furnace slag (BFS) on the microstructural and mechanical properties of RPC was investigated [8]. Mixtures exceeding 150 MPa of compressive strength had cement contents between 680 and 977 kg/m3. Another research [9] showed some mechanical investigation on RPC with around 650 kg/m3 cement, 420 kg/m3 GGBFS and 120 kg/m3 silica fume. Incorporating limestone powder in RPC improved the hydration process at the early-age, producing denser particle packing, and improving mechanical properties [10]. Other study used ano-CaCO3 as a component of binder [11]. It was observed a 17 % increase in compressive strength compared to the control specimens without nano-CaCO3. The behavior of dosages of RPC containing fly ash (FA), silica fume (SF) and fluid catalytic cracking residue (FC3R), a by-product of the crude oil industry, was analyzed [12,13]. The research showed the possibility of a partial replacement of cement and silica fume. However, the necessary amount of cement to reach 150 MPa compressive strength was higher than 740 kg/m3. Several researchers have reported their test results about the possibility of using rice husk ash (RHA) to replace silica fume (SF) in producing RPC [14,15]. The experimental results showed that the compressive strength of RPC incorporating RHA reaches more than 150 MPa. The results of the partial substitution of silica fume with fine glass powder (FGP) in RPC were analyzed [16]. The results demonstrated that compressive strength values of 235 and 220 MPa under 2 days of steam curing can be achieved when replacing 30% and 50% of SF with FGP respectively, with a mean particle size (d 50 ) of 3.8 µm. However, the amount of cement used exceeded 800 kg/m3. Also recycled glass powder was used to replace quartz sand, cement and quartz powder particles [5,17]. Even a RPC incorporating waste bottom ash (WBA) was developed [18]. The results showed that due to the existence of the metallic aluminum particles in WBA, the mechanical properties of the concrete could be reduced. None of the dosages reached a compressive strength of 150 MPa. These investigations show that it is possible to replace significant amounts of cement and silica fume in RPC dosages with other less expensive and more sustainable components without significantly affecting the compressive strength. However, how to find a reasonable balance between the proportion of these supplementary cementitious materials in the binder and the mechanical and rheological properties of RPC still remains an open question.
Furthermore, Portland cement, the principal hydraulic binder used worldwide in modern concrete, is not only a product of an energy-intensive industry (4 GJ/ton of cement) but also responsible for large emissions of CO2, thereby contributing to global warming. Manufacturing one ton of Portland-cement clinker releases nearly one ton of CO2 into the atmosphere, while nowadays the world’s yearly cement output of 1.5 billion tons of mostly Portland cement is responsible for nearly 7% of the global CO2 emissions [14]. Hence, one of the key sustainability challenges is to design and produce concrete with less clinker and inducing lower CO2 emissions than a traditional one, while providing the same reliability, and better durability. The RPC seems to be one of the candidates to reduce the global warming impact of construction materials. This is because it allows for thinner sections thanks to its excellent mechanical behavior. However, as shown before, when producing RPC, the cement or binder content is always relatively high [19]. This is why the partial replacement of cement in RPC, especially when made by locally available industrial by-products, is of great interest to the scientific community [3].
While striving towards a cost-effective and more sustainable RPC, the objective of this study is to effectively design and produce RPC with low cement amounts, with a maximum content of silica fume of 100 kg/m3. The design of the concrete mixtures is based on the aim of achieving compressive strength and rheological properties with minimum amounts of cement through a 3-factor Design of Experiments (DoE). To ensure a densely compacted cementitious matrix, the modified Andreasen & Andersen particle packing model (A&A mod ) [20] was used. Cementitious supplementary materials such as limestone powder, electric arc slag furnace and recycled glass flour were used as a partial replacement for cement and silica fume in the concrete.
In this work is presented a factorial-design procedure for reactive powder concrete (RPC) composite material with compression strength up to 150 N/mm2, with the minimum amount of cement possible, while using limestone powder (LP), recycled glass powder (RGP) and electric arc slag furnace (EASF) as partial substitution of cement and silica fume. For the mathematical optimization a multi-objective simultaneous optimization R-coded algorithm [21] was adopted. Finally, the mathematical-selected mixture was verified with experimental work.
2. Materials and methodology
2.1. Materials
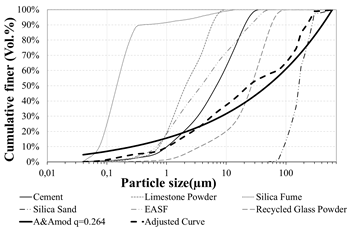
The RPC mixtures were prepared with raw materials locally available in Colombia. ASM Type HE cement (C) was used. The HE cement had a specific gravity of 3.15, and mean particle diameter (d 50 ) of 8 μm. The SF used in the mixture proportioning complied with ASTM C-1240 specifications and had a specific gravity of 2.20 and d 50 of 0.15 μm. The RPC was also designed with a SS of a specific gravity of 2.65, maximum particle size (d max ) of 600 μm, and d 50 of 165 μm. RGP with a specific gravity of 2.55 and d 50 of 28 μm was used, LP with a specific gravity of 2.73 and d 50 of 2 μm, and EASF with a specific gravity of 3.15 and d 50 of 2.1 μm were used as supplementary cementitious materials. EASF and RGP with the particle size distribution (PSD) depicted in Fig. 1 were obtained by grounding locally available raw waste materials with a jet mill to different degrees of fineness, by applying different grinding speeds. Table 1 shows the chemical composition of the materials used in this study. Fig. 1 provides the particle size distribution (PSD) of the cement, SF, LP, EASF, RGP and SS. Fig. 2 shows a photograph of the raw materials used in the research. A polycarboxylate (PCE)-based superplasticizer with a specific gravity of 1.07 and solid content of 40% was used.
Source: The Authors.
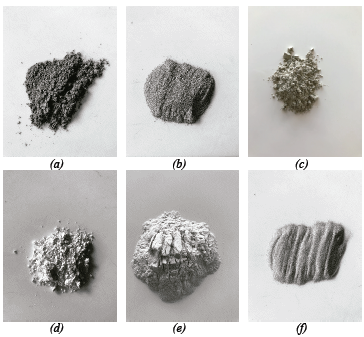
Figure 2 Materials used in this research: (a) Cement HE; (b) condensed silica fume; (c) EASF; (d) micro limestone powder; (e) recycled glass powder; and (f) silica sand.
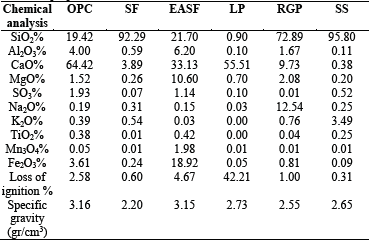
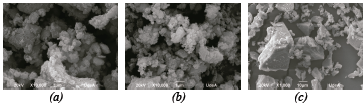
The supplementary cementitious materials (EASF, LP and RGP) used as partial substitution of cement and silica fume were analyzed by scanning electron microscopy (SEM) as depicted in Fig. 3. Results point out the lack of porosity of the recycled glass powder.
2.2. Preparation and test of specimens
The amount of cement, water, and superplasticizer were established by the DoE. The other components were ruled by the A&A mod using a q value of 0.264, according to eq. (1).
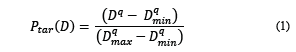
where D is the particle size, P tar (D) is the weight fraction of total solids that are smaller than D, D max and D min are the maximum and minimum particle sizes, respectively, and q is the Distribution Modulus. The q value determines the ratio of aggregate/cementitious paste content needed for achieving the densest possible particle packing, which likely achieves the greatest compressive strength. A lower value of q implies a high content of cement and SF, increasing the packing density and strength but also the final cost of concrete The value of q was determined in a previous research [22].
After the dosage was established, a liner mortar mixer was used to produce the concrete. At the end of mixing, the fresh properties of the UHPC mixtures were measured to determine the static slump flow diameter in accordance with ASTM C1437 specifications [23] by taking the spread diameter of the mini-slump cone in the flow-table test, filling the truncated conic mold with the concrete and lifting it away. The spread flow of the concrete (Ø m ) was obtained as the average diameter of the measure in four perpendicular directions.
After performing the static flow test, the concrete was cast in 50 mm cube molds. To improve the packing density of concrete a vibrating table was used after pouring the molds. The samples were demolded approximately 24 h after casting, and then cured in a moisture room at 20 ºC until the day of the test. Concrete compression machine with 3000 KN in capacity was used, following ASTM C109 [24]. For each different age, i.e. 24 hours, 7 days, and 28 days, three samples were tested.
2.3. Response Surface Analysis (RSM)
The response-surface methodology comprises a body of methods for the exploring of optimum operating conditions through experimental methods [25]. It is a collection of mathematical and statistical techniques for the modeling and analysis of problems based on the statistical design of experiments and least square error fitting. It is used extensively where several input variables influence the process [26]. RSM usually involves an experimental design, a response surface model and an optimization [27,28].
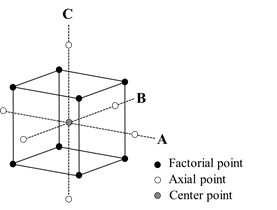
A Central Composite Design (CCD), an efficient experimental design, was chosen for its ability to estimate second-order effects, to analyze a response surface with a relatively small number of trials, to determine the interrelationships between factors, to model the response data, and to locate the optimal response [29]. The second-order model is widely used in this methodology for the following reasons: (i) the quadratic model is very flexible as an approximation to the real response surface. It can take on a wide variety of functional forms, so it will usually work as an approximation to the real response surface; (ii) it is not complicate to estimate the parameters - the a’s in eq.(3) - in the second-order model; and (iii) there is considerable amount of experience indicating that second-order models work well in solving real response surface problems.
A central composite design is the most commonly used response surface designed experiment. Central composite designs are a factorial or fractional factorial design with center points, augmented with a group of axial points (also called star points) which increase the variable space and allow for the estimation of the second-order terms. The design used in this work involves 2N factorial points (which are in the corners of cube), 2N axial points at a distance ± α from the origin and 4 central point, as depicted in Fig. 4. Hence, a total of 18 set point, 4 center points (2 Axial plus 2 Cube), 2 blocks (Cube and Axial) and α =± 1.78885, was used in this research.
The statistical analysis was carried out on the coded data sets in order to simplify the interpretation of the results. The coding was as according to eq. (2).
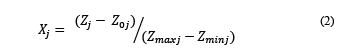
where X j is the coded value of factor j, Z j is the real value of factor j, Z 0j is the real value of factor j at the center point and Z maxj and Z minj are the maximum and minimum values of the factor j in the domain space respectively.
To estimate each response a second-order polynomial equation calculated according to eq. (3) was used.
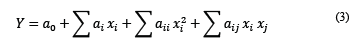
where Y was the estimate of the response (i.e. dependent variable), a 0 is the overall mean response, a i are linear coefficients, a ii are quadratic coefficients, a ij are coefficients of the interaction, and x i , x j represent the factors (i.e. independent variables). The factors defined for this experiment are fixed at the levels shown in Table 2.
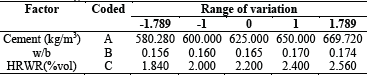
In this work, three independent factors, namely, cement content in kg/m3, water binder ratio (w/b), and volume of superplasticizer to total dosage ratio (PCE), were chosen. To determine the proportion of the rest of the concrete components, the A&A mod curve was used. Four responses were also considered, including compressive strength with standard curing conditions at 24 hours (R1), 7 days (R7), 28 days (R28), and spread flow (Ø m ).
3. Results and discussion
3.1. Adjusted model and validation
In this research, a central composite design with 18 design points was chosen to fit the response in domain space for the 3 design variables at 3 levels. Table 3 presents the factorial set point combinations and their corresponding values obtained experimentally. R, a language and environment for statistical computing [30], for experiment design and analysis, was used to plan the experiment.
Table 3 The set point combinations and the corresponding experimental responses.
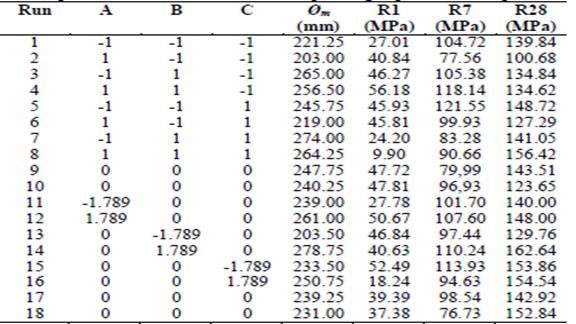
Source: The Authors.
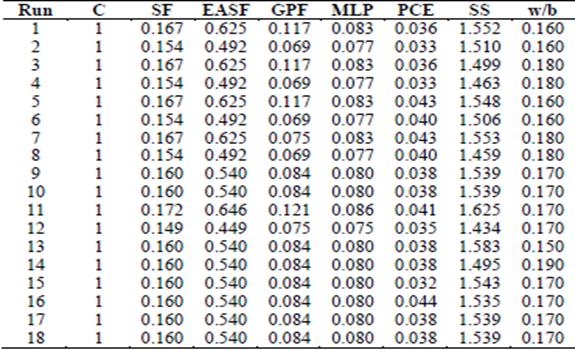
The corresponding mixture proportions of this DoE, adjusted according to the A&A mod curve, are presented in Table 4.
Table 4 Proportion of mixing components expressed as a function of the weight of the cement.
Source: The Authors.
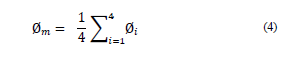
The Ø m parameter was measured on spread test and calculated according to eq. (4), in which: Ø i is the mean value for each i of the four perpendicular diameters, in mm.
According to eq. (3) a quadratic polynomial regression model was adjusted for each response (R1, R7, R28, and Øm,). There were two steps involved in this process: first calculating a proper model, and then verifying the accuracy of the selected model. In this study, a backward stepwise process was used to achieve an accurate model for each response. It starts with the full second-order polynomial model, eq. (3), performed to estimate the relationship between the variables and the responses based on experimental results from CCD. Then, the process is followed by removing the variable with the largest P-value. The procedure continues until only those variables which are significant (P-value<0.05) remain in the model. Once the non-significative term was removed, the adjusting model process is repeated until all the non-significative terms have been removed from the equation. The first-order variable with no significant P-value must remain in the model only if any of its second-order variables is significant. When the model has been created, residual analysis was performed to check its efficiency. The latter includes statistical calculation such as residual plots and residual standard deviation, in which the accuracy of the selected regression can be graphically appraised. The response surface graph can be drawn once the accuracy of the model is validated [31].
The significance of the model was determined by performing an analysis of variance (ANOVA) using the language for statistical computing R [30], where the results are given in Table 5. F-test and P-value were used to determine the significance of the model. P-values lower than 0.0001 were obtained for all the models, implying that the models are significant.
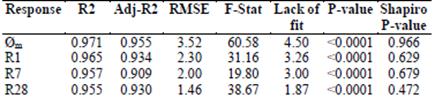
The validation of the regression models included the determination coefficient (R2), the adjusted coefficient of multiple determinations (Adj-R2), the root means square error (RMSE), the F Statistic value, the lack-of-fit P-value, the model P-value, and the Shapiro-Wilk P-value given in Table 5. The models presented a high determination coefficient (R2), explaining 97%, 96%, 96% and 95% of the variability in the responses Ø m , R1, R7, and R28, respectively. This indicates an appropriate fit for the model and high statistical significance of the model. It shows that a high correlation exists between the experimental and predicted values. Furthermore, the adjusted R2 values are very close to the R2, which shows that the unnecessary terms are not added in the model. Lack-of-fit test was run to check the goodness of the regression model. The optimal value of lack-of-fit is zero. All the P-values calculated in the ANOVA process purported that the lack-of-fit is not significant compared to the pure error. In addition, the Shapiro-Wilk test showed P-values higher than 0.05 in all cases.
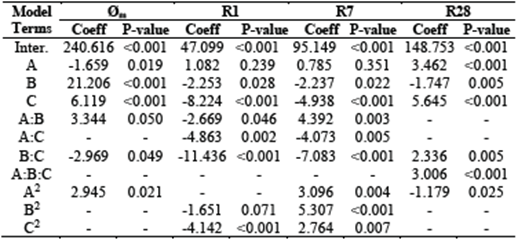
3.2. Analysis of factors using response surface methods
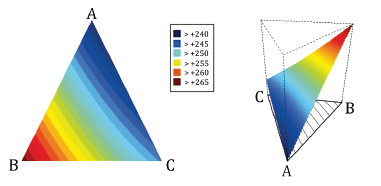
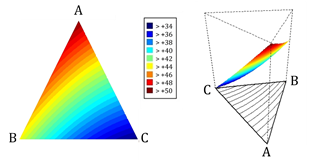
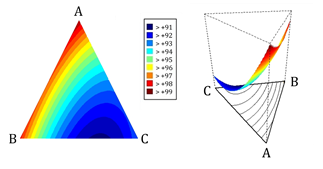
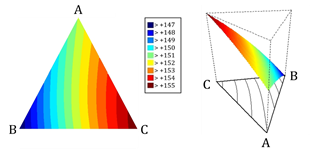
The developed response surface methodology models are checked through ANOVA by analyzing the effect of individual parameters and their interactions on responses. The significant parameters were detected by t-test by determining which of them had P-value below the threshold value of 0.05, which indicates that their contribution improves the model. Table 6 depicts the estimation parameter of the models (model terms) and their corresponding P-values. Parameters with a P-value higher than 0.05 were not considered in model, except for the aforementioned exception. The response surface can be plotted by presenting the response as a function of three factors, in triangular graphics. Figs. 5-8 shows the contour and the response surface plots in the domain region in function of factors A (Cement content in kg), B (water to binder ratio) and C (superplasticizer content in volume). These plots provide information on the effect of the three independent components on average spread (Ø m ) and compressive strength with standard curing conditions at 24 hours (R1), 7 days (R7), and 28 days (R28).
Source: The Authors.
Figure 5 Response surface 2D-3D plots indicating interaction effects of the amount of cement (A), w/b ratio (B) and superplasticizer content (C) on the spread flow.
Source: The Authors.
Figure 6 Response surface 2D-3D plots indicating interaction effects of factors A, B, and C on the 1-day compressive strength.
Source: The Authors.
Figure 7 Response surface 2D-3D plots indicating interaction effects of factors A, B, and C on the 7-day compressive strength.
3.3. Spread flow
The effect of variation of factors A, B and C on average spread (Ø m ) is shown in Fig. 5. According to ANOVA results, presented in Table 6, a linear relation was obtained between the spread length and the water to binder ratio, which is the most significant factor. According to EFNARC [32], a spread flow value from 240 to 260 mm is considered adequate for a plain self-consolidated concrete (SCC). The addition of cement and powders generally resulted in a higher viscosity of the mixtures and, therefore, the value of spread flow decreased with the increase of cement (factor A). As expected, the water to binder ratio (factor B) and superplasticizer content (factor C) have a positive effect on the spread flow value. Water to binder ratio has the most influence in this field, however, its implications in compressive strength, and superior threshold, forces us to limit its use.
3.4. 1- day compressive strength
The effect of three-factor on 1-day compressive strength is monitored as a contour plot and 3-D plot in Fig. 6. The maximum value corresponds to the maximum level (1) of cement (A). According to ANOVA results, presented in Table 6, a nonlinear relationship was obtained between the 1-day compressive strength and the three factors. As shown in Fig. 6, the early compressive strength increases with the increase of cement (A) but increases much more with a decrease in water to binder ratio (B) and superplasticizer content (C). The negative effect of the increasing water in the compressive strength is a well-known effect. Even the negative effect of polycarboxylate on early strength development has been demonstrated by several researchers [34,35]. The polycarboxylate based ether superplasticizer slows down the hydration of silicates (especially the alite phase and also affects the formation of ettringite) [33].
3.5. 7- day compressive strength
Fig. 7 shows the contour and 3D plot of the effect of factors A, B, and C on the 7-days compressive strength. The maximum value of 7-day compressive strength could be seen when factor A value is at its maximum level (1) and factor C is at a minimum level (-1). As for 1-day compressive strength, according to ANOVA results, presented in Table 6, a nonlinear relationship was obtained between the 7-day compressive strength and the three factors studied.
3.6. 28- day compressive strength
The effect of variables on 28-day compressive strength is shown in Fig. 8 as a 3D plotting. It shows the positive effect of variables on the 28-day compressive strength of UHPC as cement and superplasticizer in the highest level (1) while water to binder ratio remains in the lower level (-1), giving the maximum 28-day compressive strength.
The effect of superplasticizer content on 28 compressive strength is provided in Fig. 8. It shows that, contrary to what happens with early strength, by increasing the superplasticizer content, the 28-day compressive strength rate increases.
Once again, the nonlinear relationship was obtained between the 28-day compressive strength and the three factors studied.
3.7. Model Checking
Generally, a model’s adequacy is investigated through the examination of residuals. For the model to be adequate, the pattern of residual plots should be structureless.
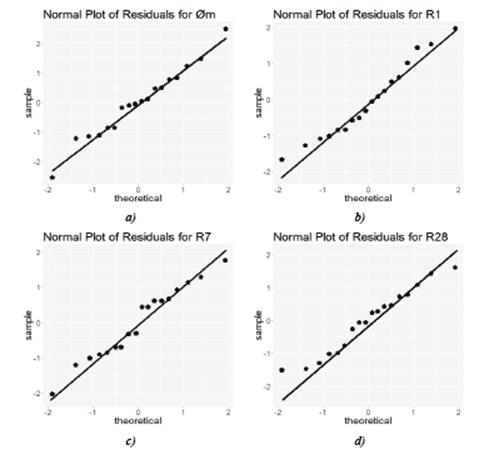
The normal probability plot of the residuals of each RSM (Fig. 9) shows that the residuals lie reasonably close to a straight line, implying that errors are distributed normally and supporting the claim that the terms mentioned in the model are significant.
Source: The Authors.
Figure 9 Normal Plot of residuals for each response’s model: a) Øm; b) R1; c) R7; and d) R28.
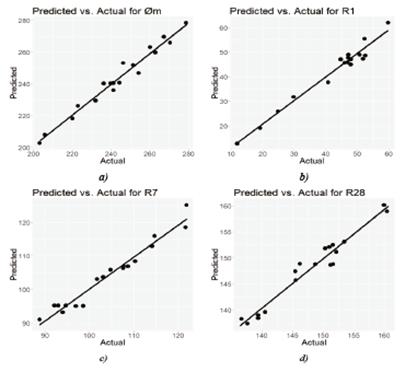
A graph of the predicted response values versus the actual response values is shown in Fig. 10. It helps to detect a value, or group of values, that are not easily predicted by the model.
Source: The Authors.
Figure 10 Predicted versus Actual values for each response’s model: a) Øm; b) R1; c) R7; and d) R28.
The figure also shows any abnormalities in response.
4. Multi-objective optimization of RPC
4.1. Methodology
A multi-objective optimization R-coded algorithm [21] was employed, aimed at settling the optimum values for the independent variables that can reach the best value for the response. The algorithm was based on the multiple response optimization introduced by Derringer and Suich in 1980 [35]. The methodology translated each response function into a desirability function and maximized the geometric mean of the desirability of each response by using single objective optimization technique. First step is establishing a numerical model between factors and responses. Then all independent variables were sorted simultaneously and independently to optimize the objective responses. This optimal solution aims to accomplish the requirements for each of the responses keeping a balance among them [27].
The geometric mean of individual desirability is shown in eq. (5) [35].
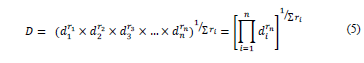
where d i . is a desirability of each response, r i is the weight or importance of each response, and n is the number of responses included in the optimization. Weight (r i ) varies from 1 (least important) to 5 (most important). d i is the individual desirability function of a response, which ranges from 0 (undesired response) to 1 (fully desired response). Thus, the individual desirability function can convert the value of a response into a value between 0 and 1. The final value of D is a value between 0 and 1. For perfect accomplishment of the target values, the value of D is unity
Due to the nature of eq (5) if any of the responses is outside its desirability range, the overall function becomes zero.
The individual desirability function form of each response for minimization, maximization and in range cases is shown in in eqs. (6), (7) and (8), respectively.
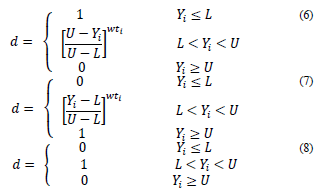
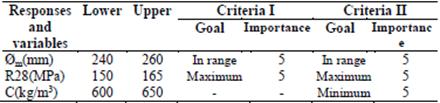
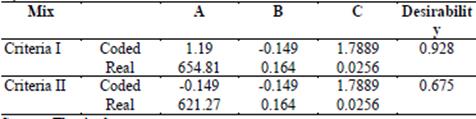
where U is an upper limit, L is a lower limit for a response, and wt i is the weight or shape of the function. Using different weights, the shape of the individual desirability for each target can be changed. The wt i value varies between 0.1 and 10. Values greater than 1 give more importance to the goal, having the weight values lower than 1 prompt the opposite effect. A weight of 1 implies that d i varies in a linear way. In this work, the multi-objective optimization process was performed in two consecutive steps, in which responses and factors were defined as a specific target by assigning a specific level of importance. Table 7 shows the goals of both optimization criteria for each response. Criteria I has been presented for selecting the optimum factor values to obtain a self-compacting mixture according to EFNARC criteria [32] with the maximum 28-days compressive strength. In this study, the slump flow was defined as ‘in range’ goal, while 28-days compressive strength was defined as ‘maximum’ goal. Once the optimization process is finished, one optimal solution, accomplishing the specified constraints was obtained. Criteria II adds to Criteria I the desire for minimum content of cement, maintaining a 28-days compressive strength over 150 MPa. In this work, the three responses: compressive strength, slump flow and cement content are considered equally important. Both optimized mixtures are shown in Table 8.
Table 7 Optimization of the individual responses for a self-compacting UHPC mixture with high 28 days compressive strength (Criteria I) and with minimum cement content (Criteria II).
Source: The Authors.
4.2. Experimental validation
The efficiency of the mathematical-selected dosages was evaluated by carrying out the experiment under optimal conditions and by comparing obtained predicted values with the two mixtures presented in Table 8. Table 9 shows the absolute relative deviation between model and experimental values, ARD (%), which is used as a measure of predictability a toll for validation. The results confirmed that the experimental values are close to the values predicted by the multi-objective optimization.
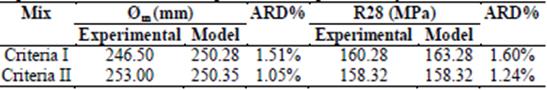
It is important to note that the mixture designed under Criteria II and tested experimentally, resulted in a reduction of cement content of approximately 22%, and of silica fume by over 50%, compared to the typical dose of RPC proposed by Richard and Cheyrezy [1]. These partial substitutions for less expensive materials such as recycled glass, EASF and limestone powders, leads to a reduction in the final cost of the mixture of approximately 20%, while maintaining the compressive strength above 150 MPa.
5. Conclusions
In this work, a reactive powder concrete using by-products as cementitious supplementary materials, such electric arc slag furnace, and recycled glass powder, in addition to limestone powder was obtained through a multi-objective simultaneous optimization. In this model, the factorial design and the response surface method (RSM) were incorporated. Five responses, spread flow, the compressive strength at 1,7 and 28 days, and cement content, were studied, while using three of them (compressive strength, slump flow and cement content) in the optimization mixture design method. Based on the results of this experimental investigation, the following conclusions were drawn:
An optimal mixture was designed to reach 150 MPa at 28-days compressive strength with only 621 kg/m3 of HE cement and 100 kg/m3 of silica fume. This provides an RPC, which incorporates by-products in its dosage such as electric arc slag furnace and recycled glass flour.
The proposed numerical models provide an accurate examination of RPC properties over the selected range of cement content, water to binder ratio and superplasticizer content. The high values for coefficients of multiple determinations (R2) combined with lack-of-fit test results demonstrated the accuracy of the second-order model to predict the behaviour of RPC in relation to compressive strength at 1, 7 and 28 days, as well as spread flow value. ANOVA tests also confirmed the inclusion of all model’s parameters which are statistically significant, due to their low P-value.
Regarding rheological properties, water-to-binder ratio has a positive effect, nevertheless it has negative effect on strength of all ages of concrete. The superplasticizer content has a positive effect on the slump flow. However, polycarboxylate content has a negative effect on the early-strength but a positive effect on the 28-day compressive strength.
The study of results predicted by the model compared to those obtained in the experiments leads to the conclusion that the statistical model can be used to predict properties for new mixtures with good accuracy.

