


 Inglés (pdf)
 Articulo en XML
 Referencias del artículo
 Enviar articulo por email
 Citado por SciELO
  Citado por Google
  Similares en
SciELO
Similares en
SciELO  Similares en Google
 Permalink
1. Introduction
Plastics are increasingly used in everyday life as they offer advantages such as low production cost, light weight, corrosion and chemical resistance, toughness and durability. Because of their versatility, and the fact that they can be tailored to suit specific demands, they have found a broad range of applications in the transportation market [1,2]. It has been reported that the use of both thermosets and thermoplastics in passenger vehicles has grown from approximately 30 kg per vehicle in 1960 to about 180 kg in 2010 with a potential to increase up to 400 kg in 2050, which represents about 10-12% plastic’s weight in a midsize vehicle and up to 50% in volume [3-5]. Engineering plastics are used in instrument panels, knee bolsters, interior trims, fuel tanks, bumpers and other vehicle applications.
Simulations of crash events or crashworthiness predictions for the automotive industry are now a common practice. However, finite element modeling developed by the Federal Motor Vehicle Safety Standards, and other safety related procedures, were initially developed to fit more traditional materials, such as metals [6-9]. Plastics have very different properties to metals. For crashworthiness predictions, the effect of the strain rate on the deformation behavior of the polymer is a key concern, as the stress-strain curves are the main required input in dynamic finite element analyses, and they are very dependent on strain rate. Vehicle crashworthiness simulations on plastic components cover a wide range of strain rates from 0.01 to 500 s-1, and therefore, developing experimental methods for generating stress-strain curves at these strain rates is of great technological importance [8,10-13].
Nowadays, the behavior of materials subjected to high strain rates can be studied using five types of testing systems: the conventional screw drive load frame and servo-hydraulic systems can provide strain rate dependent data up to 1 s-1, the high rate servo-hydraulic system and impact tester up to 1,000 s-1, while the Hopkinson bar may be used to generate data at the high end, up to 10,000 s-1 [7,14-20]. Although the high rate servo-hydraulic system has been used to generate data in this range of strains (0.01-500 s-1), it has been reported that specific parameters such as the strain rate sensitivity, temperature sensitivity and strain distribution have to be considered in order to obtain accurate results when dealing with plastics. For the case of the Hopkinson Bar, the experimental techniques to obtain stress- strain data at the medium strain rate range of 1-100 s-1 are not well established [19,21,22].
In this paper a Charpy machine is modified and instrumented with the aim of acquiring displacements and accelerations to obtain the conventional stress-strain curves of three thermoplastics in the range of 300-400 s-1.
2. Experimental procedure
2.1. Materials
Three different thermoplastics provided by Formosa were analyzed in this study: poplypropylene-copolymer 6610A (PP-Co), polpropylene-homopolymer 4100N (PP-Ho) and high-density polyethylene LH5320 (HDPE). Further comparison based on experimental results of laboratory tests will be presented at section 3.1.
2.2. Quasi-static test
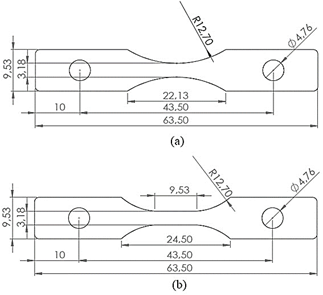
Specimens of ASTM D638 type V tensile dumbbell-shape samples (Fig. 1a) were die cut from 3 mm thick injection molded plates. Quasi-static uniaxial tension was conducted on an INSTRON 3343 universal testing machine at a constant displacement rate of 5 mm/min and at room temperature (27°C). Five replications per material were performed. The elastic modulus, E, yield strength at 0.2% offset, σ y , maximum strength, σ max , and percent elongation at break or rupture strain, e break , were calculated (see section 3.1). Because the specimen of Fig. 1a there is no a gage length zone, it was taken as the initial length equal to the specimen of Fig. 1b to facilitate comparison.
2.3. High-strain rate tests
2.3.1. Apparatus description
In the ASTM D1822 tensile-impact energy standard test method [23] for breaking plastics and electrical insulating materials, the energy to fracture a specimen by shock in tension is determined by the kinetic energy extracted from the pendulum of an impact machine in the process of breaking the specimen. Qualitatively, it is reported to present intermediate strain rates when compared with the high rate of the Izod test (ASTM D256 standard [24]) and the low rate of the common tension test (ASTM D638 standard [25]), and thus, its principle was selected as the basis of this research.
The head pendulum of a Charpy machine was modified in agreement with ASTM D1822 standard for tensile-impact testing. One of the specimen’s end is attached to the pendulum head with a bolt as shown in Fig. 2. In the other end, a longer bolt is attached. When the pendulum is released, the longer bolt hits the anvil at the bottom of the pendulum trajectory, and at that point the tensile-impact event starts: one end of the specimen is tensed by the pendulum head that continues its travel and the other end is constrained by the anvil.
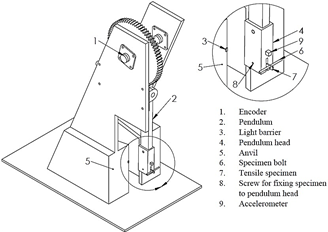
The machine is instrumented to acquire acceleration and displacement data, enabling to obtain the stress-strain curve. A Dytran 2W033 accelerometer with a frequency response of 51.2 kHz was used to record the instantaneous accelerations with which the forces were calculated. An encoder with 1000 pulses per revolution was used to record the displacements in terms of the angular position. Because the pendulum trajectory is much longer than the deformation region of the specimen, which is hit at the bottom of the pendulum trajectory, a light barrier was used as an initial filter in order to save only the tensile-impact region data. The information transmitted by the sensors was acquired by an NI cDAQ 9174 and a SMT32Discovery, while the light barrier information was attained by a NI 6212 DAQ with a sampling frequency of 400 kHz. The data acquired by the acquisition cards were filtered with a low-pass filter in LabVIEW, following the recommendations of the SAE J2749 standard [26], so that experimental tests of resonance were performed on the modified Charpy machine giving results between 10-12 kHz, so that the resonance frequencies of the Charpy machine do not interfere with the obtained results. Eliminating these frequencies is more complex to achieve in dynamic tests than in quasi-static tests [19,27].
Additionally, a Phantom V9-3072MC high-speed camera was used to record the test in such a way that the precise moment of impact between the bolt in the specimen and the anvil could be determined. The camera has a speed of 1016-23391 fps with 1632x1200 and 480x120 resolution. The camera began recording 100 ms after the light barrier was activated, setting this time as the initial (zero) time of the test.
2.3.2. Specimens
Because there are no standard procedures for obtaining stress-strain curves during tensile- impact tests on plastic materials [1], two specimen types were used: 1) ASTM D1822 type S specimen (Fig. 1a), the same used for quasi-static tests, and 2) ASTM D638 type V specimen (Fig. 1b). Both specimens were die cut from 3 mm thick injection molded plates. Although the ASTM D1822 standard has another type of specimen, the type L, it is almost identical to the D638 specimen and therefore, type S was selected.
2.3.3. Test conditions
Tests were performed at temperatures between 29°C, similar to those of the quasi-static tests. The pendulum head was released from an initial position of 45°, reaching a speed of 3.1 m/s at the bottom of its trajectory where the specimen hits the anvil. Twenty replicate samples per material were used. The elastic modulus, E, yield strength at 0.2% offset, σ y , maximum strength, σ max , and percent elongation at break or rupture strain, e break were calculated from the stress-strain curves according to Annex 1 of ASTM D638 standard [25].
3. Results
3.1. Quasi-static test
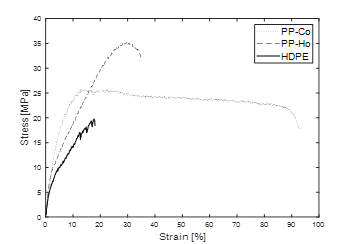
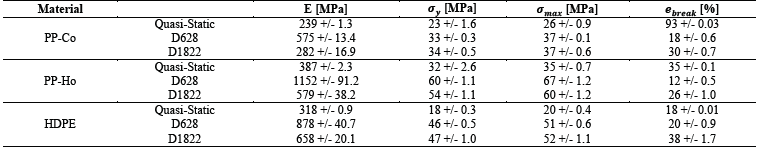
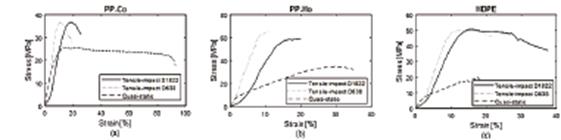
Fig. 3 shows the average stress-strain curves for PP-Co, PP-Ho and HDPE. Table 1 summarizes the properties obtained from these curves. It is observed that PP-Ho has the break. Results agree with data supplied by the provider, in highest modulus as well as yield and maximum strength. On the other hand, PP-Co presents the largest elongation at which a yield stress of 22 and 33 MPa for PP-Co and PP-Ho is reported. However, for the HDPE obtained result for yield strength is much lower than the one reported by the provider (27 MPa).
3.2. High-strain rate test
3.2.1. Repeatability tests
Once the tensile-impact machine was instrumented, tests were performed in order to evaluate the repeatability of the acquired data. These tests consisted on positioning the pendulum at an initial position of 90°, and then leaving it in free fall, acquiring angular position and acceleration data with the encoder and accelerometer, respectively (Fig. 4). Ten tests were performed. A 99.46% and 81.48% of repeatability was found for angular position and acceleration, respectively, which, according to Belingardi [28] and Chapra [29] are adequate for this type of dynamic testing.
3.2.2. Stress-strain curves
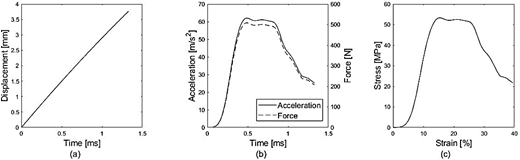
Linear displacements were calculated from the angular displacements through the pendulum arm length (69 cm). Fig. 5a shows the displacement vs time curve during a tensile-impact test, the angular displacement from the impact to the fracture of the specimen was 0.3 degrees which represents linearly 3.6 mm, for this reason it was assumed that the movement was always linear and approximate the calculation of the force to Newton's second law, which represents for this study, a difference of 4x10⁻⁴% from the linear to the rotational. At each time step the engineering strain (e) is calculated as the equation 1

Source: The Authors.
Figure 5 (a) Displacement vs time curve obtained from the encoder, (b) acceleration vs time and force vs time curves obtained from the accelerometer, and (c) stress-strain curve.
where ∆L is the elongation and L0 the initial gage length. For the D638 specimen L0 is 9.53 mm. However, for the D1822 type S specimen there is no gage length zone so 9.53mm was also used for comparison between the different specimens, because equation 1 requires a L0 it was decided to be the same as the test specimen to be compared for ease of calculation. Note that the rest of the specimen dimensions are very similar to the D638 standard.
From the acceleration (a) vs time curve (Fig. 5b) the force (F) was estimated as the eq. 2. A program in LabVIEW obtained the accelerations (see section 2.3.1) and following Newton's law, the acceleration multiplied by the mass of the body which was assumed totally inelastic at the time of impact. Because the mass of the anvil is much bigger than the specimen, it was assumed that during its deformation until the fracture it is a single body.
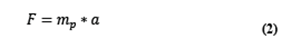
where m p is the mass of the pendulum arm and head (8.2 kg).
Stresses (σ) were calculated as the equation 3
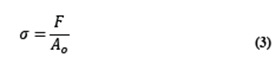
where A 0 is the initial area of the cross-section (9.54 mm2). Fig. 5c shows the obtained stress-strain curve for this case.
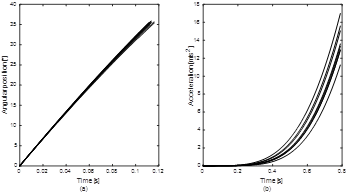
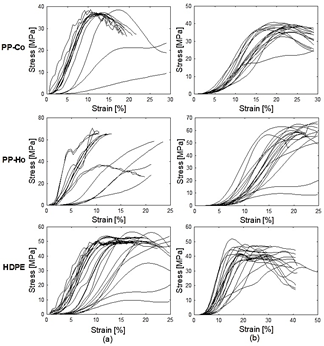
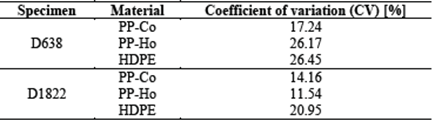
The engineering stress-strain curves obtained from the tensile-impact tests at an initial arm position of 45° on PP-Co, PP-Ho and HDPE are shown in Fig. 6 for both types of specimens (D638 and D1822). Note that for tests with the D1822 specimen’s dispersion in the curves seems to be lower. Coefficients of variation were calculated for each test and are shown in Table 2. Effectively, the variation in tests with D1822 is lower than with D638 specimens, which has been reported in other studies [30,31].
Source: The Authors.
Figure 6 Stress-strain curves of PP-Co, PP-Ho and HDPE obtained from tensile-impact tests at an initial position of 45° with specimens (a) D638 and (b) D1822 specimens.
Table 2 Coefficients of variation for tensile-impact tests with specimens D638 and D1822.
Source: The Authors.
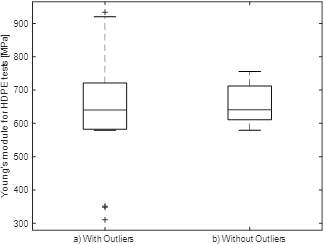
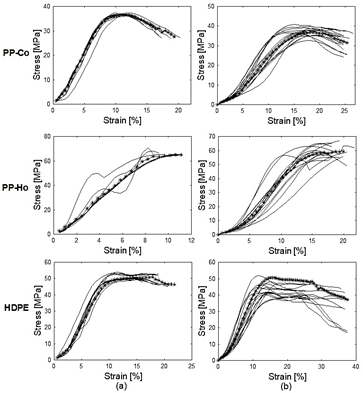
To obtain the average stress-strain curve for each test, outliers were eliminated (Fig. 8) with a boxplot analysis. A repeatability higher than 75% was found for all the tests. A boxplot analysis was used because the distribution was not normal, since the average (
 ) and the median (Me) is very far and the sizes of the boxes were not symmetrical as shown in the Fig. 7. Also, analysis of variance (ANOVA) was performed to find the repeatability of the data with a confidence level of 95%. The standard deviation and mean are a function of the sample time. As a result, a repeatability of approximately 75% was found. The average stress-strain curves for each material during the quasi-static and tensile-impact tests with both specimens are shown in Fig. 8 for comparison. Fig. 7 shows Young's module for HDPE tests with specimen D1822 in a boxplot analysis, where a) we can see outliers that after being removed become b), and thus obtained the values of the mechanical properties of each material. In Table 1 the mechanical properties obtained from these curves are summarized.
Source: The Authors.
Figure 7 Boxplot analysis for HDPE tests with specimen D1822 a) with outliers where Me = 639.76 MPa and = 646.73 MPa; b) without outliers where Me = 655.66 MPa and = 658.00 MPa.
Source: The Authors.
Figure 8 Stress-strain curves of PP-Co, PP-Ho and HDPE obtained from tensile-impact tests after outliers were eliminated with a boxplot analysis for (a) D638 and (b) D1822 specimens, the average curve is indicated with x marks.
It is observed that at higher strain rates the elastic modulus is upper. Curves from specimen D638 presented the highest values. As expected, opposite behavior is observed for rupture strain, which decreases as strain rate increases. Yield and maximum strength also increased, but in this case, values are very similar for both specimens D638 and D1822. At the beginning of the curves presented in Fig. 9, the results show that the stresses values of quasi-static data exceed those of high speed by a fraction of 5% deformation, after many observations this value was attributed to the adjustment of the specimens in the head pendulum at the moment of impact.
Source: The Authors.
Figure 9 Average stress-strain curves at low and high strain rate for (a) PP-Co, (b) PP-Ho, and (c) HDPE.
The conventional or engineering strain rate is expressed in terms of engineering strain as the equation 4 [32]

where 𝑣(𝑡)=𝑑L/𝑑t
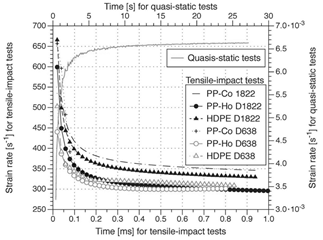
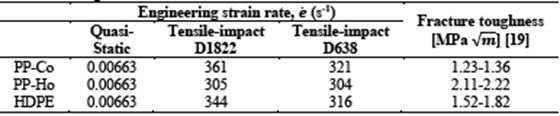
In Fig. 10 the strain rates during quasi-static tests and tensile-impact tests with specimens D638 and D1822 for PP-Co, PP-Ho and HDPE are shown. For the quasi-static tests an average strain rate of 6.63x10⁻³ s-1 was found. This corresponds to a crosshead speed of approximately 4 mm/min rather than 5 mm/min as programmed in the machine. Analyzing the data, it was found that the maximum crosshead speed reached during the tests was 3.9 mm/min. Note how the strain rate increases from zero until it reaches a constant value once the inertia of the system is overcome. For the tensile-impact tests an opposite behavior is observed: when the specimen hits the anvil and its deformation starts, there is a significant drop in the strain-rate, which then converges to certain value. Note also the difference in the time scale, while the quasi-static tests ran for more than 100 s, the tensile-impact tests are in the range of 2 ms. Strains rates were estimated according to equation 4. In Table 3 the strain rates of PP-Co, PP-Ho and HDPE during the quasi-static and tensile-impact tests are summarized. It is observed that with PP-Co the highest strain rate is achieved, followed by HDPE and PP-Ho. If the fracture toughness of each material (Table 3) is analyzed, it can be observed that the tougher the material is, the more energy it is absorbed, and thus the lower strain rate during the test.
Source: The Authors.
Figure 10 Strain rates during quasi-static tests (right and upper axes) and tensile-impact tests (left and lower axes) with specimens D638 and D1822.
4. Tensile-impact simulation with LS-DYNA
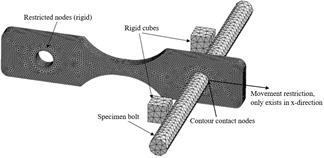
Non-linear finite element simulations using LS-DYNA and LS-PrePost 4.5.18 were performed to model the tensile-impact behavior of PP-Co, PP-Ho and HDPE. Simulations were performed with both D638 and D1822 specimens. 3D solid models of each specimen, according to Fig. 1, were created in SolidWorks 2019 and then exported to LS-PrePost. The mesh element type used in this analysis is tetrahedron with a size of 0.50 mm for the specimen and 1.5 mm for the other components (Fig. 11). The element size was chosen to ensure the analysis convergence.
Source: The Authors.
Figure 11 LS-DYNA model of the tensile-impact test simulation. When t > 0 the specimen bolt transmits a deformation in the specimen where the nodes move freely.
4.1. Boundary conditions
To simulate the tensile-impact test, where one end of the specimen is being tensed by the pendulum head while the other end is constrained by the anvil through the bolt, nodes at the left borehole were restricted or fixed as shown in Fig. 10 while the other end is hit by a rigid body through a rigid bolt. At the beginning of the simulation there is no contact between any bodies, only until the bolt is hit with two rigid cubes and this transmits a displacement to the specimen. An initial velocity (3.1 m/s which was the experimental velocity before impact) in the x-direction was applied to two rigid cubes with a total mass equivalent to that of the pendulum head 8.2 kg. The translation movement was only in the x-direction as explained in section 3.2.2. These cubes hit the rigid bolt that is connected to the right borehole. Material 020-RIGID of the LS- PrePost 4.5.18 was assigned to the rigid bolt and cubes. Impact simulations were performed to compare the effect of loading quasit-static or high-speed curves (obtained from the experiments tests) to the simulation. Results with both curves were compared with experimental results.
The stress-strain curves obtained, from the quasi-static tests and the tensile-impact tests with both specimens (D638 and D1822), were assigned to the specimen’s material in order to compare the accuracy of each simulation. The material was defined using the 024-PIECEWISE_LINEAR_PLASTICITY model of the LS-PrePost 4.5.18. The materials used in the model were considered isotropic, homogeneous and free of residual stresses.
4.2. Simulation results
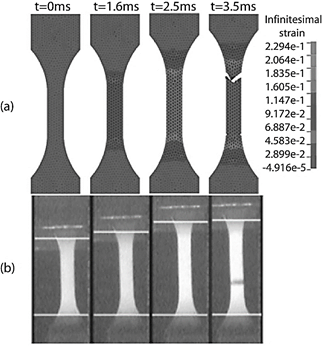
Fig. 12a shows the elongation of a specimen at different times during the simulation. For a qualitative comparison, a series of images of the impact-deformation-fracture process captured by the high-speed camera (Fig. 12b) in the same device but with a different pendulum head [33] that allows recording are shown. As observed, the simulation emulates the deformation process of the specimen during the tensile-impact test. The case presented in Fig. 12 is PP-Co and a D638 specimen, where strain can be predicted at different time intervals. In this order, the information that was acquired to compare was the force at break and the elongation. It is important to mention that for D638 specimens the simulation does not necessarily predict fracture at the middle of the specimen. However, for D1822 specimens, fracture was always predicted at the middle, where the width is the narrowest. Similarly, all simulations performed were made with their respective specimens and loading the appropriate experimental curves.
Source: The Authors.
Figure 12 Elongation and fracture of a D638 specimen under tensile-impact (a) simulation in LS-DYNA and (b) test using the modified Charpy machine.
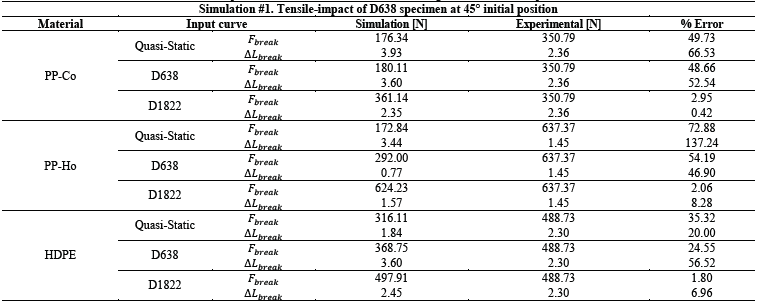
To quantitatively compare the simulation results with the experimental tests, the elongation and force at break were compared. Results are summarized in Table 4.
Table 4 LS-DYNA simulation results for the tensile-impact test of PP-Co, PP-Ho and HDPE using D638 and D1822 specimens.
Source: The Authors.
Results in Table 4 show that the specimen with the best fit has an average percent of error of 2,9% and 4,1% for force and elongation, respectively. These simulations were modeling the D1822 test. Therefore, this type of specimen can acquire a useful and reliable information by a modified Charpy machine. As expected, the error of the simulations using the quasi-static curves is very high: on average 56 and 65% for force and elongation, respectively. As expected, the error of the simulations using the D638 tensile-impact curves was also high: 38% and 52% for force and elongation, respectively.
Takekoshi [30,31] concluded that the D1822 specimen is more effective for determining failure or rupture strain by taking advantage of its shape, as the load tends to concentrate in its center where the width is the narrowest and where rupture occurs. In the case of D638 and other dog-bone or thumb bell specimens, failure strain cannot always be determined due to differences of localization during necking: sometimes specimens show uniform deformation, and other times they deform locally resulting in early failure.
Also, Takekoshi [30,31] concluded that D1822 type S specimen is ideal for high-strain rate tests, even when the specimen has no gauge length to measure strain, as it allows a greater reproducibility of rupture displacements. If the coefficients of variance in Table 2 are compared, it is observed that effectively, tests with D1822 specimens presented lower values of variation when compared with D638 specimens. This allowed to have a better fit when obtaining the stress-strain curves.
5. Conclusions
A Charpy impact pendulum was modified and instrumented to obtain conventional stress- strain curves at high strain rates (300-400 s-1). Stress-strain curves of three thermoplastics were obtained using two types of specimens: ASTM D638 type V and ASTM D1822 type S. Simulations in LS-DYNA of the tensile-impact tests were performed using the different curves obtained at high strain rates as well as curves from quasi-static tests. These results were compared with experimental ones. The following conclusions were determined:
A 99% and 81% of repeatability for angular position and acceleration, respectively, was obtained in the tensile-impact machine. A repeatability higher than 75% was found for the stress-strain curves obtained with both specimens (D638 and D1822) after the boxplot analysis.
Mechanical properties are very dependent on strain rate. Elastic modulus, yield strength and maximum strength were significantly higher during tensile-impact tests that during quasi-static tests. Elongation showed the opposite effect: it decreased with higher strain rates. This could be verified by the modification of Charpy machine, since with conventional testing machines, which are based on the D638 standard, it is not possible to achieve the high-strain rate used in crashworthiness simulations.
The error of the impact simulations using the curves from the tensile-impact tests with the D1822 specimens resulted in average errors of 2.9% and 4.1% for rupture force and elongation, respectively, while for the quasi-statics curves it was on average 56 and 65% for rupture force and elongation, respectively. This exposes a clear advantage of the D1822 sample over the D638 when subjected to high-strain rate impact, since it presents much smaller errors in the simulation. This is because the type of sample is suitable for the high-rate impact phenomenon.

