


 Inglês (pdf)
 Artigo em XML
 Referências do artigo
 Enviar este artigo por email
 Citado por SciELO
  Citado por Google
  Similares em
SciELO
Similares em
SciELO  Similares em Google
 Permalink
1. Introduction
Clay minerals are a vital source of economy in the different areas of the building industry. Clay minerals are specifically used in cosmetics, manufacturing of bricks for masonry construction, ceramics, and pharmaceutical applications including the development of functional solid catalyst [1-4]. Clay minerals are natural materials mainly composed of hydrated aluminum silicates, generally referred to as phyllosilicates with particle size of less than 2 μm [2,5]. These materials are layered structures mainly composed of SiO4 tetrahedral sheets linked by oxygen atoms to XO6 octahedral sheets (X=Al, Fe, Mg) [5]. According to their layered structure, clay minerals are classified in seven groups: kaolin-serpentine, pyrophyllite-talc, smectite, vermiculite, mica, chlorite and interstratified clay minerals [2]. The clay minerals structure and chemical composition determine its corresponding application [6]. Natural clay minerals contain impurities and are not homogenous, which cause their use to be difficult for technological applications [2]. Therefore, in order to improve their properties, it is necessary to prepare mixtures [7-10] or to enhance them with the use of additives [11]. Some of the relevant properties for brick masonry have to do with color and brightness [12,13], which ultimately depend on the clay’s mineral content and the firing temperature it is subjected to [12]. This means that adequate characterization of raw materials and control of firing processes are key for technological processes such as manufacturing of bricks.
In Colombia, Boyacá is one of the largest clay mineral producers for building industry use. However, the preferred use of empirical knowledge to process clay materials, together with shortfalls in the characterization of raw materials and firing processes are preventing the industry to increase the profitability of the final product.
In this study, two clay minerals with different colors were selected to prepare mixtures and to study their morphological, structural, thermal and magnetic properties by using common characterization techniques such as scanning electron microscopy (SEM) with elemental analysis (EDS), X-ray diffraction (DRX), differential scanning calorimetry (DSC), and color measurement. In addition, unconventional techniques including magnetization measurements and positron annihilation lifetime spectroscopy (PALS) techniques were also used. The results evidence that the mixture of clay minerals contributes to the production of colored-refined materials, even though, no significant changes regarding structural properties are exhibited.
2. Materials and methods
Yellow and white clay, labeled as Clay A and Clay B respectively, were extracted from clay deposits in Socha, Boyacá-Colombia to prepare clay mixtures in several weight ratios (Fig. 1). These clay minerals were sieved by 16, 200 and 325 mesh, afterwards, dried at 160 °C for two hours. Clay A and B were mixed to obtain 10 g of mixture varying the weight percentage between 10 and 90 % of the clays. All clay samples were weighed with an analytical balance with an accuracy of 0.0001 g. The resulting mixtures were grinded for two hours and pressed into pellets with pressure of about 95.5 kg/mm2. This was followed by sintering at 650 °C for 16 hours.
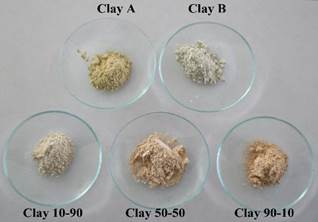
Source: The Authors.
Figure 1 Photography of: Clay A top-left position, Clay B top-right position- and clay mixtures at10-90 bottom-left; 50-50 bottom-middle; and 90-10 bottom-right.
The colorimetric values of the precursor clay minerals and the obtained mixtures were measured using a NH300 High-Quality colorimeter by the Commission Internationale de l’Eclairage (CIE) 1976 L∗, a∗,b∗ colorimetric method where L∗ is the lightness axis (0 for black and 100 for white). The parameters of a∗ (negative values for green and positive values for red) and b∗ (negative values for blue and positive values for yellow) denote hue or color dimensions.
The clay minerals structure and composition were analyzed using X-ray diffraction (XRD). All patterns were collected with an X’Pert PRO diffractometer (PANalytical) with CuKα radiation source in the range of 10° to 90° and at a step interval of about 0.02°. Differential scanning calorimetry (DSC) was conducted using TGA Q-500 equipment. Sample accurately weighed of 30 mg was placed into an aluminum cup. The experiment was conducted under argon atmosphere in a range of 25-1200 °C at 10°C/min heating rate. The SEM images were acquired in a JEOL JSM 6490-LV instrument with an acceleration voltage of 20 kV. Magnetic measurements of the samples were performed using a magnetometer of vibrating sample VSM-Versalab. The magnetic field and temperature range was about -30-30 kOe and 50-330 K, respectively. Temperature dependence of magnetization was measured in constant magnetic fields ranging between 0.2 and 5 kOe.
Positron annihilation lifetimes (PALS) were measured for the Clay A, Clay B, 10/90 and 90/10 samples. This helped us to gain some insight regarding the nanopores size of the samples in order to compare this variable against each of the samples, since information of both extremes (A and B clay minerals) and two mixtures was available. Hence, the 50/50 mixture sample was not of our interest in that sense. For each spectrum, 3×10⁶ events were accumulated. The time resolution of the system was 225 ps. For these measurements, a conventional sandwich arrangement was made. However, as this arrangement requires two identical samples, the Clay B, 10/90 and 90/10 samples were measured with a Si wafer on one side (only Clay A was available twice), so when fitting the lifetime spectra for these, the contribution for Si did not have any variation (218 ps). PALS measurements were carried out with the mono-energetic positron beam ‘‘SPONSOR’’ at Rossendorf which a variation of the positron energy E from 30 eV to 35 keV with a smallest step width of 50 eV. The energy resolution of the Ge detector at 511 keV is (1.09 + 0.01) keV.
3. Results and discussion
The color-values of the mixtures were determined by CIE-L*a*b* colorimetric method [14, 15]. Fig 2, shows the b*, a* and L* parameters for raw clays and mixtures. The a* and b* values for sample A are greater than those for sample B, the parameter L* for sample A is lower than the one for sample B.
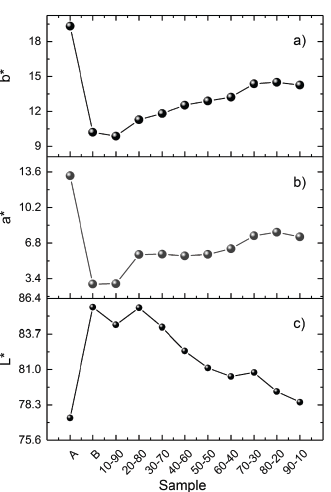
The greater values of a* and b* are related to the yellow color appearance, while the greater value of L* is related to the white appearance. Parameter a* and b* increase when the A content increases, and, similarly, the value of L* decreases when the A content increases. This behavior corroborates the change on color appearance of clay mixtures observed in Fig. 1. The results show that color appearance in clay mixtures can be controlled by mixing the accurate quantity of raw material.
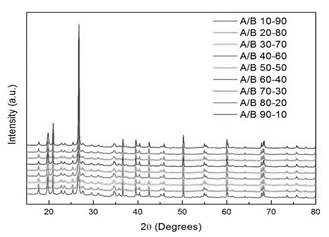
Fig. 3a shows the XRD pattern taken at room temperature for clay B. The main reflections were indexed with kaolinite (PCD 1803036), quartz (PCD 1520590) and montmorillonite (AMCSD 0002868) crystallographic phases. In contrast, the XRD pattern of clay mineral A (Fig. 3b) exhibits additional peaks around 25 ° and 27.5 ° in comparison with that of clay mineral B. The clay mineral B exhibits additional peak around 38 ° in comparison with that of clay mineral A (insets in Fig. 3b), remaining peaks in both clay mineral A and clay mineral B are common. All clay mineral mixtures display the same peaks observed on clay minerals A and B without rise or vanish of peaks (Fig. 4), A slight shift is observed in the peak positions between clay A and clay B, the 2θ values are lower in clay A than in clay B, i.e. the three greater peaks are located at 19.88, 20.88 and 26.66 ° for clay A and 20.06, 21.06 and 26.82 ° for clay B indicating greater lattice parameters values for phases in clay B. For all mixtures the values of 2θ lies between values of that of clay A and clay B due to contribution of both raw materials. The XRD results demonstrate that firing at 650 °C does not induce the degrade of mineralogical phases, being the clay mineral mixtures of high chemical stability.
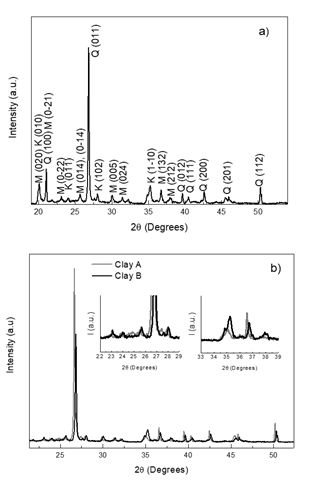
Source: The Authors.
Figure 3 XRD patterns at room temperature for a) Clay B with indexed peaks, M montmorillonite Q quartz K kaolinite, and b) clay minerals A and B.
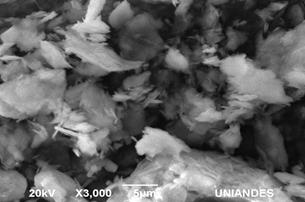
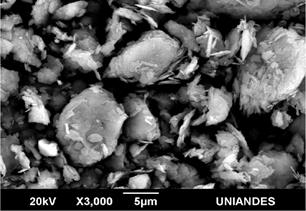
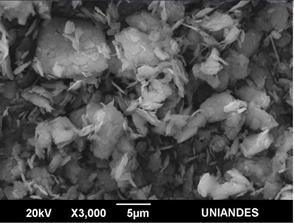
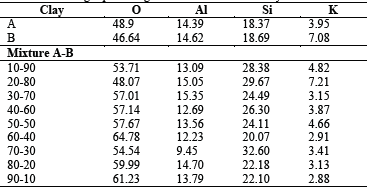
The morphology of the samples was analyzed by SEM and PALS techniques. SEM images of 10/90, 50/50 and 90/10 are shown in Figs. 5, 6 and 7, respectively. The clay minerals mixtures present a similar morphology, they are flake-like and flake-aggregated shaped. The results of the elemental analysis, carried out with EDS, in terms of weight percentage, are listed in Table 1. For Clay minerals A and B, analysis evidences low content of Na, Mg, Fe and C. These elements were not detected in clay mixtures due to, probably, their low quantity, minor than 1.6 % for Na, Mg, and Fe, as well as the heating treatment for C, which comes from organic content.
The positron in crystal lattice is strongly subjected to repulsion from the positive atom core. Because of the locally reduced atomic density inside the open volume defects, with a lower local electron density, positrons have high probability to be trapped and to annihilate with electrons in these defects. In this case, the positron lifetime mirrors the electron density of its surrounding, where positron annihilation takes place. In bigger open-volume defects, electron density decreases linked to a decreasing positron annihilation probability. This effect is measured with longer positron lifetimes.
Positron annihilation lifetime results are listed in Table 2. Clay mineral samples A and B were fitted independently and the resulting lifetime contribution was not altered for the clay mineral samples 10/90 and 90/10. For visual indication, the fitting results are shown, only for the sample 10/90, presented in Fig. 8.
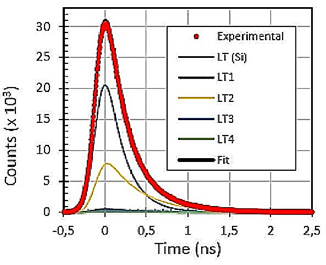
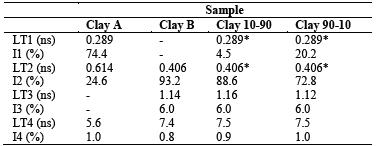
In Table 2, the LT4 component is not attributed to the samples and its contribution is negligible. This effect is probably caused by a small gap in the sandwich configuration between the 22Na source and samples.
For all the samples, the other lifetime components are attributed to annihilation of positrons inside the grains and at the grain borders. A large free volume is seen in the SEM images. For this reason, very long lifetime components should be expected in the positron lifetime spectra. Despite of that, the results exhibit a different behavior. Both clay A and B exhibit saturation trapping. This means that nearly all positrons are trapped in defects and only a small amount of about 1% annihilate at grain borders with long lifetime. Two short lifetimes with 289 ps and 614 ps are found in clay mineral A, whereas clay mineral B shows only one short lifetime component of 406 ps. Thus, in clay mineral A two open-volume defects of different sizes were identified, and on the other hand, Clay mineral B contains only one defect size whose size ranges between both defect sizes found in clay A. A rough estimation of the size of the open-volume can be given for defects with 289 ps as an agglomeration of about 10 vacancies and for longer lifetimes as small voids with radius below 0.1 nm.
The intensity results from LT1 evidence a higher concentration of Clay mineral A in the sample 90/10 than in the sample 10/90. Likewise, LT2 results reflect a higher concentration of Clay mineral B in the sample 10/90 than in 90/10. This result was not detected with the other implemented techniques, which proves the sensitivity of this technique in the field of clay minerals. In this way, it could be possible to establish differences between samples obtained from different deposits, or from different places in the same deposit, or a mixture of them.
Special attention, however, should be given to LT3 in the Clay mineral samples B, 10/90 and 90/10. That long lifetime component (higher than 1 ns) is known as positronium (Ps), a hydrogen-like bound state between the electron and the positron. When calculating the pore size diameter for Ps by using the Tao-Eldrup model [16,17], the results suggest that it should be 0.188 ± 0.009 nm for Clay mineral B, 0.90 ± 0.006 nm for Clay 10/90 and 0.184 ± 0,006 nm for Clay 90/10.
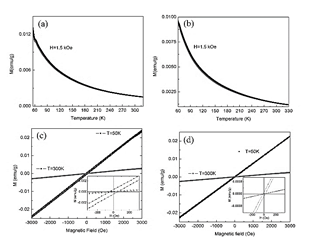
Fig. 9, illustrates the temperature and magnetic field dependence of magnetization for clay minerals A and B. Both clay minerals show a typical behavior for a paramagnetic material (Fig. 9a and Fig. 9b). For clay mineral A, a peak at 61 K is noticeable (Fig. 9a). Fig. 9c and Fig. 9d show the magnetization as a function of applied field which confirms that the clay minerals A and B exhibit a paramagnetic behavior at room temperature. At a temperature of 50 K, clay minerals present a weak irreversible behavior which is more evident in Clay mineral A, this indicates the presence of a small amount of ordered phases or the enhancement of magnetic elements as indicated by the slight peak observed in curve of Fig. 9a.
Source: The Authors.
Figure 9 Magnetization in function of: a) temperature for Clay mineral A, b) temperature for Clay mineral B, c) magnetic field for Clay mineral A and d) magnetic field for Clay mineral B.
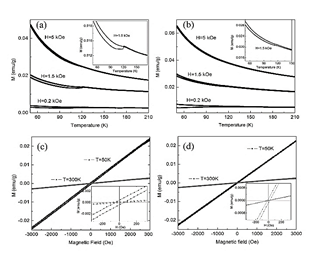
Fig. 10 illustrates the magnetic response as a function of the temperature for mixture 10/90 at three different magnetic fields and the curves of magnetization as a function of the magnetic field. The M vs T curve exhibits a peak near 120 K, this peak arises between 116 K and 248 K for all the mixtures, Fig 10a and Fig 10b. On inset of the Fig. 10a and Fig. 10b an irreversibility behavior is evidenced. From the curves of magnetization as a function of the magnetic field at 50 K, Fig. 10c and Fig. 10d, it is possible to observe a low value of coercive field (Hc) and remnant magnetization (Mr). In these curve, saturation magnetization is not observed, this implies a major paramagnetic-like phase. For clay A and clay B the behavior at 300 K is linear and at 50 K is closer to linear, which indicates a paramagnetic behavior (Fig. 9c and Fig. 9d). From these results, it is confirmed that there is not presence of ferro or ferri-magnetic phases including that of iron as metallic iron, magnetite or maghemite. Further studies are necessary to confirm the nature of the evidenced magnetic peak.
Source: The Authors.
Figure 10 Magnetization in function of: a) temperature for A/B 10/90 mixture, b) temperature for A/B 90/10 mixture, c) magnetic field for A/B 10/90 mixture and d) magnetic field for A/B 90/10 mixture.
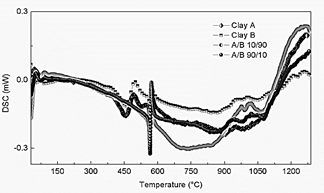
Fig. 11 displays the DSC curves for 10/90 and 90/10 weight ratios and the DSC curves for Clay minerals B and A which are similar. All the mixtures exhibit the same behavior. Comparing the curves, there is a step of loss of humidity between 36 °C and 94 °C for Clay B, and in the range of 36 °C to 111 °C for all the mixtures. A loss of chemisorbed water can be observed between 392 °C and 580 °C for clay B and between 547 °C and 595 °C for all the mixtures and a phase transition between 945 °C and 1063 °C for clay B and, between 930 °C and 1079 °C for all the mixtures. The DSC measurements, which do not present a structural phase transition below 700°C confirm the results obtained from the DRX measurements, thereby the thermal treatment carried out to produce the mixtures does not induce structural changes.
4. Conclusions
The results of XRD and DSC show that the thermal treatment at 650°C does not change structural property at room temperature in the different compositions of the mixtures. Furthermore, morphology in the mixtures is alike.
The results display that color appearance is tuned by mixing the accurate quantity of raw material, thus, it is evident that the mixture of clay minerals contributes to the production colored-refined materials, even though no significant change regarding structural properties are exhibited
The magnetic response in the mixtures and raw clay minerals predominantly is paramagnetic.
The positron results evidence the sensitivity of the technique to detect the differences among all the samples, which suggests that it is possible to establish variances between samples obtained from different deposits, or from different places in the same deposit, or a mixture of them. The use of the different and no conventional techniques of characterization applied on clay minerals as the ones implemented in this work, allows us to obtain differences in their physical properties and therefore, to evaluate the quality and the potential use of a product in a better way.

