


 English (pdf)
 Article in xml format
 Article references
 Send this article by e-mail
 Cited by SciELO
  Cited by Google
  Similars in
SciELO
Similars in
SciELO  Similars in Google
 Permalink
1. Introduction
According to the International Labor Organization (ILO), approximately 380,000 workers die worldwide every year. In addition, 374 million non-fatal occupational accidents also occur annually [1], with around 30% of these figures resulting from the construction sector [2]. Additionally, it is known that the working days lost owing to these accidents account for a loss of 4% to 6% of the world's gross domestic product (GDP) [1,3]. In the case of Brazil, according to the digital observatory of occupational safety and health (observatório digital de segurança e saúde no trabalho - ODSST), approximately $ 20 billion was spent on accident benefits during the period 2012-2018. In addition, 4.5 million occupational accidents and approximately 16,500 accidental deaths were reported [4]. Of these, according to the data from the Secretary of Forecast, 7.30% of accidents and 14.85% of deaths occurred in the civil construction sector alone [5-7].
It should be noted that the construction industry is characterized by its influence on movement and economic growth, because of the close relation between infrastructure and development [8]. According to Brazilian Chamber of Construction Industry (Câmara Brasileira da Indústria da Construção - CBIC) [14,15], this sector contributed, on an average, 6.06% to Brazil’s gross value added (GVA) for the period 2010-2016. It should be noted that the sum of GVA and production taxes is equal to the gross domestic product (GDP). Thus, it can be seen that the construction industry makes an appreciable contribution to the national economy of Brazil. Furthermore, this is a sector that can generally hire workforce with little or no prior training [9,10], thus helping the employers save the cost of training the employees. In addition, this sector can also hire employees from other industries in times of crisis, such as adverse economic conditions or large-scale unemployment. Thus, this sector helps in reducing the unemployment levels with a low level of investment [11]. Notwithstanding this favorable perspective, the low demand for specialization and the informal nature of the sector leads to the occurrence of occupational hazards [12], resulting in a major socio-economic problem [13].
Based on the above information, the main objectives of this study are to analyze the trends in the instances of accidents in the Brazilian civil construction industry during the period 2010-2016 and create an annual classification (ranking) using the analytical hierarchy process (AHP) and technique for order of preference by similarity to ideal solution (TOPSIS) methods. The rankings would reveal the approach adopted to address the problem. The analysis was conducted region-wise, whereby the regions follow the same delimitations as the Brazilian states. The present study was based on correlating the figures of the occupational accidents to some significant socio-economic indicators, such as GVA, human development index (HDI), economically active population (EAP).
This academic research is justified from the following three fundamental perspectives: (i) even though studies on this subject are widely available in the literature, an effective monitoring of the findings is necessary to identify the trends by statistically evaluating and demonstrating the risks that still exist in the Brazilian construction companies and help them make necessary decisions for preventing accidents; (ii) owing to the significant financial and social costs of the accidents, a firm management of the construction works, it is necessary to establish a risk management model; (iii) it can provide essential knowledge to manage work-related risks and hence, is extremely critical for developing strategies for risk mitigation in the construction industry.
This study is also important for Brazilian government agencies because its findings can help them acquire a clear understanding of the country’s approach to addressing work-related accidents in the construction sector. Furthermore, it can provide a basis for future preventive activities and formulation of occupational safety and health (OSH) legislations and strategies, specifically for the construction sector. In addition, this study can help fill a gap that still exists in Brazil on the usage of TOPSIS and AHP multi-criteria models to solve problems in the construction industry.
2. Literature review
2.1. Work-related accidents in Brazil’s civil construction industry
Article 19 of Law 8213 of the 1991 Brazilian legislation [16], defines “occupational accident” as any incident that occurs during a period of work that causes a bodily injury or functional disturbance to the worker, resulting in the reduction or loss of the worker’s ability to work either temporarily or permanently, including death or accident resulting from the displacements necessary to carry out the work. In Brazil, the accident rates in civil construction sector are high, and more number of workers have died in civil construction activities than any other sector [5-7,12,17]. Furthermore, considering that in Brazil, approximately half of the EAP is engaged in the informal sector, it can be deduced that many accidents are not registered, and the magnitude of the problem of work-related accidents could be even greater [18].
The considerable number of accidents in civil construction arises mostly from the dangers inherent in the sector's activities [9,19]. In addition, the informal nature of work, outsourcing, lack of training, and sometimes, negligence, are entrenched factors in the nation, which also contribute to the creation of an accident-prone environment [20].
The problem at hand has several social and economic consequences. The workers and their families are the most affected, primarily due to the impact of an occupational accident on the quality of life and psyche of the worker, in addition to the physical consequences [21]. On the other hand, the employers also face consequences as they carry the financial burden in terms of direct and indirect costs of their projects, as well as the consequential impact on their reputation. Similarly, the government is also not exempted because the aforementioned problems lead to high operating costs of the social systems, resulting in an adverse impact on the national finances, which are often divided between the state and its inhabitants [20].
To address the above-mentioned adverse effects, Brazil has implemented a set of 36 regulatory standards (Normas Reguladoras - NR) related to OSH, which are mandatory for both public and private sectors. Non-compliance of these standards is punishable by legal sanctions, usually economic [22]. Among these standards, NR-18 stands out because it is a specific OSH standard that pertains to civil construction. In this standard, administrative, planning, and organizational guidelines have been established for preventive safety and control measures [23]. Additionally, Brazil is a member of the International Labor Organization (ILO) and any standards formulated by the ILO should be implemented in the country [24].
Unfortunately, even though there are numerous regulations, and it is more cost-effective to adhere to these regulations than paying the penalties resulting from non-compliance [25], employers in the country still face difficulties in following the OSH guidelines. Therefore, it is crucial to understand the importance of analyzing the occurrence of accidents in civil construction. To this end, the present study approached this problem from a comparative and descriptive point of view, with the objective of assessing the performance of various Brazilian regions. This was accomplished by means of a quantitative analysis of the accident numbers offered by the social welfare organization.
2.2. TOPSIS method
The TOPSIS multi-criteria decision-making method was first proposed by Ching-Lai Hwang and Paul Yoon in 1981, to evaluate the performance of several alternatives based on the importance or weights of a set of criteria. This evaluation is made through indicators obtained from a combination of the Euclidean distances to the ideal and non-ideal solutions. This method yields the best alternative, i.e., a decision that is closer to an ideal solution and farther from a non-ideal solution. Owing to its characteristics, this method presents a good basis for the creation of rankings, using only a series of successive steps, and does not need any advanced software [26-28].
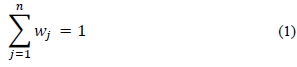
In a multi-criteria decision problem with m alternatives (Ai, i = 1, …, m), evaluated based on n criteria (C j , j = 1, …,n), let the weights of the criteria be determined by a vector W = (w1, w2, …, wn) that satisfies eq. (1), given below.
Step 1 - Construct a decision matrix (DM) according to eq. (2), given below [27].
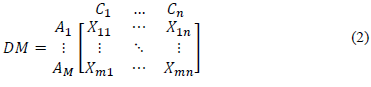
Where X ij indicates the performance of alternative A i based on criterion C j .
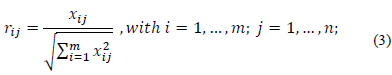
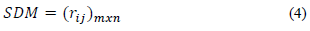
Step 2 - Calculate the standardized decision matrix (SDM). The data of the DM usually have different origins; therefore, it should be normalized and transformed into a dimensionless matrix, which would allow a comparison of from the perspective of various criteria. There are different forms of DM normalization; however, in this study, vector normalization, which is one of the most widely used forms of normalization in the literature [26-28], was applied. The DM is normalized for each criterion C j as:
Thus, the SDM is described as:
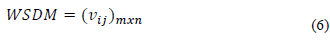
Step 3 - Calculate the weighted standardized decision matrix (WSDM). Here, the SDM is multiplied by the weights vector W of the criteria. These weights are typically defined according to the perceptions of the decision makers based on their knowledge or through other multi-criteria methods, such as the AHP method. Each element of the WSDM is calculated as [26]:

Thus, the WSDM is described as:
Step 4 - Determine the ideal solution (S+) and the non-ideal solution (S-). For the ideal solution (S+), choose from the WSDM, the best value obtained for each of the criteria; that is, the values that provide the best solution for the problem being analyzed are chosen. For the non-ideal solution (S-), the same procedure is followed, with the difference that the most unfavorable values for the set of criteria are chosen. In this step eq. (7) -(10) are used [26-28].
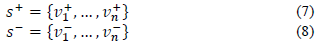
In which:
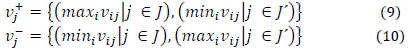
Here, J is associated with the benefit criteria and J´, with the adverse criteria.
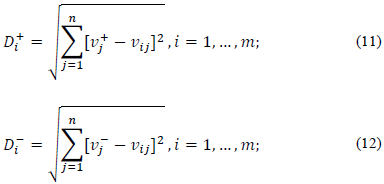
Step 5 - Calculate the distances between the alternatives and the ideal and non-ideal solutions. For each alternative (Ai), two separation measures are calculated, one from the ideal solution (D+) and another from the non-ideal solution (D-). These separations are derived from the Euclidean distance formula [28], and are calculated using eq. (11) and (12).
Step 6 - Calculate the proximity relative to the ideal solution (φi) and create the classification. In this step, the proximity distance of each alternative relative to the ideal solution is calculated using eq. (13), and this indicates which results are further from the non-ideal solution and closer to the ideal solution. An alternative with a value closer to 1 is closer to the ideal solution and hence, is the best alternative [26-28].
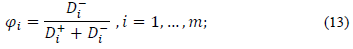
Finally, the rankings of all the alternatives are enumerated. This is done by sorting the values of φi from the highest to the lowest, wherein the first place corresponds to the best alternative and the last to the least preferred.
2.3. AHP method
The analytic hierarchy process (AHP) was first formulated in 1977 by Professor Thomas L. Saaty [28]. It is a technique for arriving at negotiated decisions for problems with multiple scenarios, factors, and criteria. This method reduces a multi-dimensional problem into a one-dimensional problem and the decisions are determined by a priority vector, which orders the alternatives by evaluating them in line with their level of importance [30]. Furthermore, this method has the ability to transform empirical data into a mathematical model, and this characteristic is the main difference between this method and the other techniques [29]. Therefore, owing to its effectiveness, it is currently one of the best known and widely used multi-criteria methods in complex decision-making, and in the analysis of benefits offered by a group of alternatives [28]. The application of the AHP method comprises a series of steps as described below:
Step 1 - Decompose the problem. This involves evaluating the problem, defining the goal to be achieved, and identifying the criteria and sub-criteria to be analyzed.
Step 2 - Evaluate the alternatives in pairs. In this step, a comparative matrix (CM) is prepared, in which evaluated sub-criteria are placed in both rows and columns as shown in Fig. 1. The purpose of the CM is to establish the relative importance of each sub-criteria vis-a-vis the others. This importance is established by decision makers with subject matter experience, based on Saaty´s fundamental scale (Table 1) [29].
Step 3 - Normalize the CM. A normalized comparison matrix (NCM) is obtained by dividing each element of the CM by the sum of all the elements in its respective column [29].
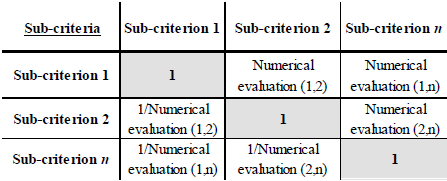
Table 1 Saaty fundamental scale.
| Scale | Evaluation | Explanation |
|---|---|---|
| Equal importance | 1 | Both criteria contribute equally to the objectives. |
| Moderate importance | 3 | Experience and judgment slightly favor one criterion over the other. |
| Strong importance | 5 | Experience and judgment strongly favor one criterion over the other. |
| Very strong importance | 7 | A criterion is favored very strongly over the other and it can be demonstrated in practice. |
| Extreme importance | 9 | A criterion is favored over the other with high degree of certainty. |
| Intermediate Values | 2, 4, 6, 8 | They are used as values to reach a consensus when the judges have different opinions. |
Source: Adapted from [28].
Step 4 - Determine the contribution of each sub-criterion to the overall objective. The contribution of each sub-criterion is determined through the priority vector, also known as the Eigen vector. This vector represents the relative weights of the participations of the sub-criteria. The Eigen vector is obtained by means of the arithmetic values associated with each row of the NCM, in which each row corresponds to a sub-criterion [29]. Together, the sum of all the weights of the sub-criteria is equal to 1, which is equivalent to 100% participation of the sub-criteria to reach the objective.
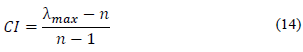
Step 5 - Verify the consistency of the data. As a final step of the AHP method, it is important to validate the analyzed data. This is carried out by verifying if the decision makers have been consistent in the opinions provided by them towards decision making [29]. This verification depends on the consistency index (CI), which is deduced by eq. (14), proposed by Saaty. Here, the main number of Eigen vector (λmax) and the number of sub-criteria evaluated (n) are related; λmax is calculated as the sum of the results obtained by multiplying each element of the Eigen vector by the sum of the CM column elements associated with the corresponding criterion [29].
Once CI is calculated, the consistency rate (CR) is calculated by eq. (15), as the ratio of the CI to the random consistency index (RI) from Table 2. Furthermore, the decision matrix is considered consistent with the results, if the CR is less than 0.10.
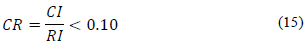
Table 2 Random CI.
| Number of sub-criteria | 3 | 4 | 5 | 6 | 7 | 8 | 9 | 10 |
|---|---|---|---|---|---|---|---|---|
| (RI) | 0.52 | 0.89 | 1.11 | 1.25 | 1.35 | 1.40 | 1.45 | 1.49 |
Source: Adapted from [28].
3. Methodology
This study, owing to its characteristics, fits in as a non-experimental quantitative and descriptive investigation, because it seeks to characterize the problem of occupational accidents in the civil construction sector in Brazilian regions, by observing and relating different factors, without manipulating the natural conditions or the variables analyzed. Likewise, the investigation can be classified as a long-term data-based investigation, because the annual data from the years 2010 to 2016 were analyzed [31].
This academic research was carried out with secondary data; the population under study comprised civil construction workers in Brazil, and covered 21 activities that make up the sector, according to the national classification for economic activities (Classificação Nacional de Atividades Económicas - CNAE), subclass 2.3, section F [32]. This sample consisted of workers formally linked to the construction sector and registered under the Ministry of Labor in 27 Brazilian states. The sample for each year included 50% of the total population under study. According to the estimates from other studies, 50% of Brazilian EAP works informally and hence, is not part of the statistics [10,18]. This implies that the data pertaining to the formal workers only are relevant and the only real numerical reference for the problem. Then, for each year analyzed, the samples contained 2-3 million workers and these annual samples were larger than are required for an infinite population, with a sampling error of 5% and a confidence level of 95%.
At the beginning of the study, economic, social, and accident variables were collected from different regions of Brazil, and were grouped and classified in a database for determining its normality at a later stage. Subsequently, correlations were determined among the three groups of variables to establish the numbers that were most associated with the base accident data (total number of accidents, deaths, and permanent disabilities). For the determination of normality, the Shapiro-Wilk test was used and, in the correlations, the Spearman method was used.
Based on the highest correlation indices obtained, the variables that were used during the study included GVA, GVA of the construction sector (GVAC), EAP, HDI, average annual number of formal workers registered in construction (AAWC), total number of accidents in civil construction with and without work accident communication (TACC), total number of people with permanent disabilities from work-related accidents in construction (TDCC), and total number of deaths from occupational accidents in construction (TLCC). Here, the first five variables represent the socio-economic conditions, while the last three variables are related to the number of accidents. These data were collected from official statistical sources to guarantee their reliability. The sources of the data used are summarized in Table 3.
Based on the 3 accident-related variables (TACC, TDCC, and TLCC) and AAWC, four additional variables were calculated, namely accident index (AI), permanent disability index from accidents at work (PDI), death index (DI), and lethality index (LI). These variables were calculated using eq. (16) - (19).
Table 3 Source of study baseline data.
| Variable | Source |
|---|---|
| GVA, GVAC | (CBIC) based on the coordination of national and regional accounts in association with state statistical bodies [14,15] |
| AAWC | Brazilian Chamber of Construction Industry (CBIC) based on the Ministry of Labor's annual social reporting [34] |
| EAP | Economics (CESIT) based on the national household sample survey of the Brazilian Institute of Geography and Statistics (IBGE) [33] |
| HDI | Atlas of Human development in Brazil, MHDI radar - United Nations Development Program (UNDP) [35] |
| TACC, TDCC, TLCC | Social security - Statistical yearbook of accidents at work (AEAT) 2011, 2014 to 2017 [5-7]. |
Source: The Authors.
Here, eqs. (16)-(18) were evaluated on the basis of 100,000 workers, while eq. (19) was evaluated on the basis of 1000 accidents.
The above-mentioned four variables were chosen because they are used by the ILO, the European Statistical Office (EUROSTAT), the Ibero-American Social Security Organization (OISS), as well as renowned authors on the subject of occupational accidents [3,39] to correlate accidents to the number of workers. This allows these indicators to conform to an international harmonized system and facilitate comparisons between countries, regions, and cities. The correlations for these four accident variables with the five socio-economic variables mentioned earlier were also analyzed.
For all the variables defined, the analysis was conducted using the basic descriptive statistics of the variables AI, DI, PDI, and LI to identify trends and generalities, and realize the evolution of each Brazilian state during the analyzed period.
One of the main objectives of this study is create a regional ranking of the work-related accidents in Brazil, through implementation of TOPSIS and AHP multi-criteria decision methods as described in the bibliographic review. The TOPSIS method was used to create a classification based on five variables initially chosen, and four variables calculated subsequently, i.e., a total of nine variables. These were chosen as they are most relevant to the construction sector and the number of accidents. These variables were GVA, GVAC, EAP, HDI, AAWC, AI, DI, PDI, and LI. The AHP method was used to determine the percentage weights assigned to each criterion implicit in the TOPSIS method. The application of the AHP method involved collaboration among civil engineering and OSH professionals. This study was implemented in SPSS 15.0 and Excel 2016 software applications.
4. Results and discussions
4.1. Correlations among variables
Correlations among variables are typically used to determine if there is a mathematical relation among these variables and to ascertain the degree of their relation [36]. Presently, there are numerous methods to calculate correlations, in which the application of the methods is conditioned to the type of variables evaluated, and the distribution pattern of the data that comprise them. For this study, the Spearman's method was used, which studies correlations among different types of quantitative variables, without requiring the variables to be following a normal distribution [37]. This was especially significant because after performing a normality test for each of the 12 variables in the methodology mentioned, it was determined that only HDI followed a normal distribution. This made the Spearman method the most appropriate to correlate the variables. The normality was evaluated in the annual samples by the Shapiro-Wilk test because each sample contained only 27 observations, and each observation associated with each region was studied [38]. In this sense, the variables that fulfilled this condition in the years studied were considered normal variables.
The results obtained in the correlation analysis are summarized in Table 4, which summarizes the correlation coefficients between the variables and their type. [40]. Between the socio-economic variables (columns) and the gross accident variables (first three rows), positive correlations were obtained, indicating that the gross accident variables grew along with the socioeconomic variables, albeit at different rates. Furthermore, the majority of correlations were high or very high, except for the correlations with the HDI, which were moderate and low. Considering the high degree of correlations presented and the importance of the HDI in the characterization of development in the country and regions, it was decided to include the five socio-economic variables in the determination of the work-related accidents ranking.
Table 4 Types and correlation coefficients between variables.
** Correlation is significant at 0.01 level (2-tailed).
* Correlation is significant at 0.05 level (2-tailed).
Source: The Authors.
On the other hand, it was observed that all significant correlations between the socio-economic variables and accident indices were negative, and mostly were low, indicating that as the socioeconomic variables grew, the accident numbers tended to decrease, albeit at a slower pace. Considering that the variables, GVA, GVAC, EAP, and HDI presented a tendency to increase, it may be inferred that there was a reduction in the accident number indices. The four accident indices analyzed in the correlations are used in the work-related accidents ranking determination because they characterized the problem in the best possible way.
4.2. Trend of civil construction accident numbers
During the period 2010-2016, 379,348 accidents occurred in Brazil according to official data, out of which 67.35% were typical, 11.81% were due to a shift to the workspace and 20.84% were without work-related accident communication (Comunicação de Acidente do Trabalho; CAT), which makes it impossible to establish the type of accident. On the other hand, 399,426 accidents were indemnified, with 9,358 of them resulting in permanent disabilities and 2,907, in deaths. These two represented, respectively 2.34% and 0.37% of the total indemnified accidents. The rest of the indemnified accidents resulted in medical assistance or temporary removal from work. The number of accidents occurred was lower than the indemnified accidents, because the indemnified included incidents that occurred in a previous period and their processing was concluded during the analyzed period [7]. It should be noted that for the gross numbers linked to accidents, disabilities, and deaths, there was a generally declining tendency.
The regional accident indices related to civil construction, offer the most significant representation of the problem because the number of gross accidents number is related to the number of workers linked to the sector. For example, 10 accidents in a region with 1,000 registered workers is not equivalent to 10 accidents in a region with 100,000 registered workers. Hence, an analysis of the general trends of the indices (AI, DI, PDI, and LI) in different Brazilian regions considered in the study are presented.
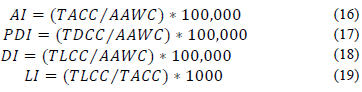
Initially, it could be seen that AI ranged between 1,000 and 6,000 accidents per 100,000 workers, with Rondônia, Roraima, and Mato Grosso regions having the highest, and Ceará and Paraíba regions, the lowest. A clear downward trend can be noted in this index over the years (see Fig. 2).
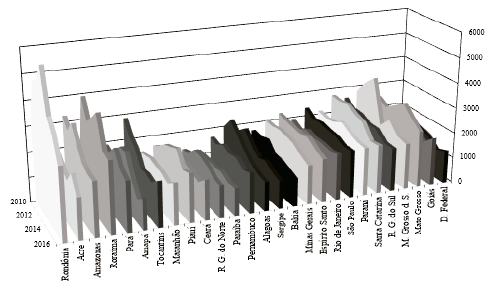
DI exhibited a generally declining tendency, with values ranging from 0 to 85 deaths per 100,000 workers. The highest indices were seen in Tocantins, Mato Grosso, and Amazonas regions, while the lowest, in Paraíba and Pernambuco regions (see Fig. 3).
The analysis revealed that PDI exhibited a decreasing tendency from 2010 to 2015. Then, from 2015 to 2016 there was a slight increase; however, the general tendency throughout the period was one of a decline. Finally, LI was stable, with no marked decreases or increases during the review period. The stable tendency of the LI only indicates that both deaths and accidents were reducing in a similar proportion. From this perspective and according to Martinelli and Pontes [24], it can be affirmed that for the period 2010-2016, the trend of accidents in the Brazilian civil construction industry was remarkable, given that both the gross work-related accident numbers and the representative indices, displayed an evidently decreasing tendency.
4.3. Brazilian regional ranking of work-related accidents in the civil construction industry
In this section, eight regional classifications of accidents at work are presented, one for each year of the period 2010-2016. Furthermore, an average rating that synthesizes the general behavior of the regions during these seven years is also presented. To create these classifications, the TOPSIS and AHP methods were used, and nine criteria were implicitly considered, as described in the methodology section. The choice of the methods used was mainly based on factors, such as means for the application, familiarity of the authors with the methods, ease of execution, and speed of obtaining the results.
4.3.1. AHP method
In the AHP method, the objective was to determine the percentage weights of the nine variables used in the creation of the ranking of the work-related accidents. These variables were of two types, socio-economic (GVA, GVAC, AAWC, EAP, and HDI) and work-related accidents (AI, DI, PDI, and LI). The problem was decomposed as explained in step 1 of the method, and the CM was determined as described in step 2.
The CM was determined by the opinion of eight professionals with experience in civil engineering, and occupational health and safety. To create this matrix, each professional developed an initial CM based on his/her experience and, then with the eight CMs determined, the average of each matrix element was calculated, resulting in the final CM. This is presented in Table 5.
Table 5 Final comparative matrix (average).
| DI | PDI | AI | LI | AAWC | GVAC | EAP | GVA | HDI | |
|---|---|---|---|---|---|---|---|---|---|
| DI | 1 | 2.17 | 1.81 | 2.31 | 4.75 | 5.00 | 6.50 | 6.25 | 7.75 |
| PDI | 0.46 | 1 | 1.06 | 1.56 | 4.50 | 4.50 | 6.00 | 5.75 | 7.00 |
| AI | 0.55 | 0.94 | 1 | 1.57 | 4.50 | 5.00 | 6.00 | 6.00 | 7.25 |
| LI | 0.43 | 0.64 | 0.64 | 1 | 3.75 | 4.00 | 4.75 | 5.25 | 6.75 |
| AAWC | 0.21 | 0.22 | 0.22 | 0.27 | 1 | 1.00 | 2.25 | 2.17 | 3.50 |
| GVAC | 0.20 | 0.22 | 0.20 | 0.25 | 1.00 | 1 | 1.67 | 2.00 | 3.25 |
| EAP | 0.15 | 0.17 | 0.17 | 0.21 | 0.44 | 0.60 | 1 | 0.83 | 2.00 |
| GVA | 0.16 | 0.17 | 0.17 | 0.19 | 0.46 | 0.50 | 1.20 | 1 | 1.75 |
| HDI | 0.13 | 0.14 | 0.14 | 0.15 | 0.29 | 0.31 | 0.50 | 0.57 | 1 |
Source: The Authors.
Once the definitive CM was established, the normalization stage begins (stage 3). Consequently, the Eigen priority vector was calculated (stage 4), in which the value of each of the vector components would represent the final percentage weight of each variable involved. Here, the criterion associated with work-related accidents had an importance of 80.37%, while the socio-economic criterion had an importance of 19.63%. The percentage weights of each variable are in Table 6.
Table 6 Percentage weights of the variables used in the elaboration of rankings.
| DI | PDI | AI | LI | AAWC | GVAC | EAP | GVA | HDI | |
|---|---|---|---|---|---|---|---|---|---|
| % | 26.72 | 19.00 | 19.51 | 15.14 | 5.65 | 5.20 | 3.27 | 3.31 | 2.20 |
Source: The Authors.
As the final step of the AHP method, step 5 was executed, in which the solidity of the CM used was verified. In this verification, eq. (14) and (15) were used; the former was associated with the CI, while the latter was associated with the CR. For this case, after the application of eq. (14), the value of CI was obtained as 0.0386. Then, based on the values of the variables used in the method, the value linked to the CI was divided by 1.45 to obtain CR as 0.0266. Therefore, according to Saaty [30], the CM matrix was considered consistent with the results derived from the application of the AHP method, because the value of the CR was less than 0.10 [29].
4.3.2. TOPSIS method
For a concrete use of the TOPSIS method in the determination of each classification, the process described below, as well as in the literature review was executed. Firstly, the decision matrix DM was established. This matrix had 243 elements, in which the columns were linked to the nine classification criteria originally chosen (GVA, GVAC, AAWC, EAP, HDI, AI, DI, PDI, LI) and the rows were associated with the alternatives, represented in this case by the 27 regions of Brazil. Subsequently, the norm of each column vector was calculated, and the SDM was established in accordance with step 2. Then, the percentage weights obtained by the AHP method (Table 6) were assigned in the criteria columns. Next each component of the SDM column vector was multiplied by the corresponding weight to obtain the WSDM (step 3).
Subsequently, after determining the WSDM, the ideal and non-ideal solutions were calculated (step 4). The ideal solution was formed with the maximum values associated with each socioeconomic variable, and the minimum values associated with each work-related accidents variable. This means that the ideal solution assumed that the best behaviors related to work-related accidents would be achieved by regions that had the best overall economy, the largest number of workers, the highest EAP, the highest HDI, and at the same time the lowest work-related accident indices, based on the correlations obtained in Table 4. The higher the values of the socioeconomic variables, the higher the production in construction, and higher the probability of accidents. However, based on the same reasoning for the non-ideal solution, values inimical to the ideal solution were considered.
With the values of the ideal and non-ideal solutions already defined, the distances of the ideal and the anti-ideal solutions for each region were determined (step 5), which allowed the calculation of proximity relative to the ideal solution φi. This is a value dependent on the distances previously calculated, as described in step 6 of the TOPSIS method. To conclude the application of this method, the classification of the regions was performed by sorting the φi values from the largest to the smallest. The regions in the top positions possessed values of φi closer to 1 and presented better trends in relation to work-related accidents in construction. In contrast, the regions in the bottom positions presented an undesired trend. The eight classifications obtained by applying the TOPSIS method are summarized in Table 7.
Table 7 Work-related accidents ranking in Brazilian regions for the period 2010-2016.
| Ranking | 2010 | 2011 | 2012 | 2013 | 2014 | 2015 | 2016 | Average |
|---|---|---|---|---|---|---|---|---|
| 1 | São Paulo | São Paulo | São Paulo | São Paulo | São Paulo | São Paulo | São Paulo | São Paulo |
| 2 | Rio de Janeiro | Rio de Janeiro | Rio de Janeiro | Rio de Janeiro | Rio de Janeiro | Minas Gerais | Amapá | Rio de Janeiro |
| 3 | Minas Gerais | Minas Gerais | Rio de Janeiro | Minas Gerais | Amapá | Pernambuco | Rio de Janeiro | Minas Gerais |
| 4 | Roraima | Amapá | Pernambuco | Bahia | Minas Gerais | Rio de Janeiro | Acre | Pernambuco |
| 5 | R.G. do Norte | Pernambuco | Paraíba | Amapá | Paraíba | Ceará | Roraima | Bahia |
| 6 | Paraná | Alagoas | Distrito Federal | Goiás | Acre | Bahia | Paraná | Distrito Federal |
| 7 | Distrito Federal | Ceará | Bahia | Pernambuco | Distrito Federal | Goiás | R. G. do Sul | Paraíba |
| 8 | Sergipe | Paraná | Ceará | Paraíba | Pernambuco | R. G. do Sul | Goiás | Goiás |
| 9 | Acre | Pará | Paraná | Roraima | Bahia | Distrito Federal | Minas Gerais | Pará |
| 10 | Bahia | R. G. do Norte | Mato Grosso | Distrito Federal | R. G. do Sul | Pará | Pará | Ceará |
| 11 | Pernambuco | Espírito Santo | Goiás | Pará | Ceará | Espírito Santo | Distrito Federal | R. G. do Sul |
| 12 | Espírito Santo | Bahia | Pará | Ceará | Pará | Sergipe | Bahia | Paraná |
| 13 | Pará | Goiás | R. G. do Norte | R. G. do Sul | R. G. do Norte | Paraíba | Espírito Santo | R. G. do Norte |
| 14 | Paraíba | R. G. do Sul | Espírito Santo | Espírito Santo | Mato Grosso S. | Roraima | Pernambuco | Espírito Santo |
| 15 | Goiás | Distrito Federal | Sergipe | Mato Grosso S. | Paraná | Alagoas | Alagoas | Sergipe |
| 16 | R. G. do Sul | Acre | R. G. do Sul | Maranhão | Alagoas | Piauí | Paraíba | Alagoas |
| 17 | Maranhão | Sergipe | Alagoas | R. G. do Norte | Sergipe | Tocantins | Sergipe | Roraima |
| 18 | Rondônia | Paraíba | Maranhão | Sergipe | Maranhão | Paraná | Santa Catarina | Amapá |
| 19 | Santa Catarina | Amazonas | Mato Grosso S. | Piauí | Piauí | Mato Grosso S. | Rondônia | Acre |
| 20 | Alagoas | Piauí | Santa Catarina | Amazonas | Tocantins | R. G. do Norte | Mato Grosso S. | Mato Grosso S. |
| 21 | Mato Grosso S. | Santa Catarina | Rondônia | Mato Grosso | Santa Catarina | Maranhão | Mato Grosso | Maranhão |
| 22 | Ceará | Rondônia | Piauí | Santa Catarina | Goiás | Mato Grosso | Ceará | Piauí |
| 23 | Piauí | Roraima | Amazonas | Paraná | Espírito Santo | Acre | Piauí | Santa Catarina |
| 24 | Amazonas | Mato Grosso S. | Acre | Amazonas | Rondônia | R. G. do Norte | Mato Grosso | |
| 25 | Mato Grosso | Maranhão | Amapa | Alagoas | Mato Grosso | Santa Catarina | Maranhão | Amazonas |
| 26 | Tocantins | Mato Grosso | Roraima | Tocantins | Rondônia | Amazonas | Amazonas | Rondônia |
| 27 | Amapá | Tocantins | Tocantins | Acre | Roraima | Amapá | Tocantins | Tocantins |
Source: The Authors.
With regard to classification, it can be seen that the regions of São Paulo, Rio de Janeiro, and Minas Gerais presented the best trend with respect to the problem. They are the regions in the top positions of the resulting rankings of this study during the evaluated period. This fact also positions them as benchmarks in the country owing to their excellent trend. It is emphasized that these regions also have the highest GVA, GVAC, and number of workers in the sector, which implies that they have the largest number of projects, due to their higher levels of development. This fact justifies their good trends, as reported in the study by Pereira Gomes [41]. Places with larger construction projects tend to be more stringent with the OSH standards.
Furthermore, Tocantins, Amazonas, and Rondônia are the regions that appeared in the bottom positions of the rankings. In other words, they are the regions with the worst trends among the Brazilian regions. It is worth mentioning that the southeast zone of the country exhibited good trends. Areas, such as the south, northeast and central-west zones presented stable behavior in the rankings through the analysis period. In the case of the northern zone, there was a lot of variability in the positions of the rankings, especially for the less privileged locations.
Finally, it should be kept in mind that the numbers studied may not be very accurate because of the problem of under-reporting of work-related accidents in the construction industry. Numerous eventualities were reportedly not recorded [18,42], which made this problem certainly more complex than what could be gauged from the available numbers.
5. Conclusions and recommendations
Based on the results obtained in this study, it can be inferred that irrespective of the positions of various regions in the rankings, the general trend in Brazil with regard to the problem of work-related accidents in the civil construction industry is favorable. It has been displaying a declining trend in accident, disability and death indices over the studied period. Considering that Brazil has a good legislative base and the country adheres to the ILO international treaties, it is recommended to the government agencies that OSH be monitored at regional and national levels more rigorously to enforce laws, and continue to reduce the number of contingencies. There are still significant gaps between what the law stipulates and what really might happen in the workplace.
Although the overall situation is favorable, the accident indices should still be considered seriously, because they imply significant loss of human lives with an impact on the quality of lives of those involved and their relatives. Furthermore, they also affect the economy of the family, business, regions, and the nation, resulting in a transcendental socioeconomic problem. Future studies should continue to focus on this problem. It should be noted that there is still a long way to go to completely eliminate work-related accidents. Therefore, it is necessary to continue the study of this theme and integrate better quality data to establish models that are closer to reality. For this to fructify, it is vitally important that government agencies work to reduce the potentially dangerous nature of the sector. This issue has been one of the main barriers to including more workers in official indices.
The work-related accidents problem stems, in part, from the great risk inherent in the civil construction activities; however, the majority of accidents can be prevented (i) if companies comply with the laws and offer basic means of prevention, (ii) the state implements stricter controls and (iii) the workers comply with preventive measures, respecting safety standards and knowing that physical integrity and life are at risk.
Finally, it is suggested that this work be continued by dividing the sample into subsectors of the construction industry to identify those with the highest number of work-related accidents. Similarly, it is also recommended to extend the study period to observe the trends of accident indices and verify if the improvement noticed in the period from 2010 to 2016 will continue in the following years.

