


 Inglês (pdf)
 Artigo em XML
 Referências do artigo
 Enviar este artigo por email
 Citado por SciELO
  Citado por Google
  Similares em
SciELO
Similares em
SciELO  Similares em Google
 Permalink
1. Introduction
Although the Latin-American energy matrix has traditionally been hydraulic and thermal, several companies have begun to introduce Non-Conventional Renewable Sources (NCER) installed at lower capacities. Currently the installed capacity of centrally dispatched plants of the Colombian National Grid (SIN) is 93% hydraulic and thermal generation, while 7% is made up of cogeneration, self-generators and wind power plants, among others, connected to the SIN. In total, the installed capacity in NCER (minor Hydro, Wind and Solar PV) amounts to 5% of the national SIN capacity. [1]
Moreover, off-grid areas (ZNI in Spanish) which cover 51% of the country, have a approximate operational capacity of 227.439kW of which 6.787kW are NCER (values currently being updated according to [2]). The Institute for Planning and Promotion of Energy Solutions for ZNI (IPSE) currently monitors 81 stations ranging from 11.14 kW (Chocó) to 28.783,7 kW (San Andrés). According to [3], the country has an approximate potential of 30 MW in wind energy, a multi-year average solar radiation of 4.5 kWh / m2 (mainly in La Guajira) as well as 448,706 TJ / year in biomass. Tax incentives proposed by Law 1715 of 2014 and the mechanisms of integration and sale of surplus NCRE energy in the SIN and ZNI (resolutions 030 and 038 of 2018 of the Energy and Gas Regulation Commission - CREG, respectively) have incentivized the increase of installed capacity in these kinds of sources.
The monitoring and management of backup systems or low-capacity solar power generation is a strategic component for the development and operation of systems such as hospitals, hotels, banks, buildings, among others, and in general all entities dedicated to the maintenance of generation assets, given that in order to diagnose the condition of devices, an adequate measurement and orderly reporting of variables is necessary; additionally, it becomes a tool for planning (assessment of the condition) and execution of maintenance (post-maintenance assessment). The telemetry allows for the identification of inadequate operations in the plant or abrupt changes in demand, when deviations of the variables measured outside the standard conditions are seen and therefore, the need of actions that mitigate these deviations can be foreseen.
Currently, most backup or small-scale solar power generation systems do not include telemetry equipment for monitoring, control and follow-up. When they have been installed, they represent a significant investment cost for the end users. This leads to the lack of real-time knowledge of the team's performance, associated with the following considerations:
Real-time lack of knowledge of the state of low-capacity solar generation and backup generation systems.
Imprecise knowledge of the amount of Electric power generated. Impossibility of remote intervention in backup and solar generation systems.
Difficulty in determining the precise location of damages that occur.
More resources and time consumed for the restoration of generation systems when outages occur.
This project aims to develop a comprehensive and complete solution for the management and monitoring of backup systems or power generation performance at a very low cost, compared to current solutions currently available. Initially, the project contemplated the coverage of equipment such as: generators smaller than 200 kW, UPS, renewable resource-energy generation systems such as photovoltaics, with the capability of enabling functions for pumps, elevators and fire-control systems.
1.1. Technical oversight
In [4], a monitoring system for grid-connected PV power systems is described. It allows for the measurement of environmental variables (temperature, wind speed, illumination, radiation intensity and altitude control), electrical variables in the set up (current, voltage and temperature) as well as inverter variables. The three main layers of the architecture are: sensor and actuator elements; PLC site monitoring and remote network diagnostics.
Notable protocols include: Zigbee, for communication and control between the sensing and action layers, PROFIBUS-DP for distributed on-site control and GPRS for communication between the PLC and remote analysis layers. For failure analysis, the system uses a deviation-based process. Among the types of failure that can be reviewed with the help of systems such as this are: the appearance of bubbles, the discoloration of cells and the breaking of cable lines between cells.
In [5], a voltage-monitoring system on the DC side (each of 4 panels arranged in series to 45V per panel) and current on the DC side (Up 9A) is described. The size of a voltage data set is the number of panels in the PV chain. For current measurement, a shunt resistor and a linear amplifier are used. Also, for voltage measurement, four voltage dividers are used. This measurement is performed with a sampling period ranging between every 15, 10 or 5 minutes. Fig. 1 shows its general architecture.
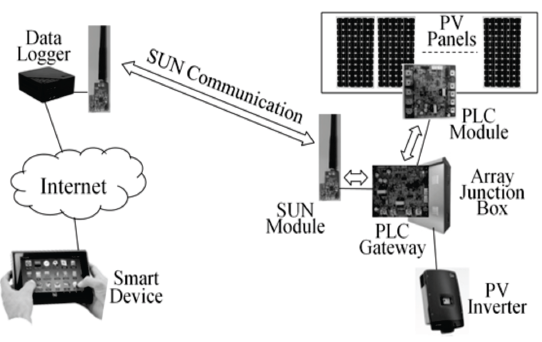
Source: Han, Jeong, Lee and Kim, 2017
Figure 1 Configuration of field installation for test in a real PV system..
For calculation of representative values of each panel between the set of panels the following simple equations are used:
v 1, v 2, v 3, v 4 are the voltages measured in each resistive divider. The failure analysis consists of detecting, during a day, if v PVi <(m-∆v) frequently, then PV i is in fault (m represents the average value of the measurement).
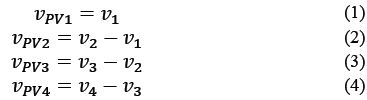
The results of a project that designs and implements a system to monitor and control UPS, based on the Megatec protocols, optimized TCP / IP and Ethernet medium, are presented in [6].
The model for monitoring the UPS system is based on embedded web servers, as well as device servers that receive and send information to the hardware interfaces. Finally, Web browsers and control web pages are used for the reception, data visualization and execution of user orders. Fig. 2 shows the client and server of UPS monitoring system.
Source: Adapted from Fu and Zhang, 2013.
Figure 2 Structure of client and server of UPS monitor system.
As it was possible to identify in the search that was carried out, the telemetry systems designed have hardware architectures and planimetries whose requirements are often based on properties of each generator system and not functional and aesthetic characteristics shared between the different backup systems: photovoltaic, gensets and UPS.
To increase the acceleration of the energy transition and fulfill the task demanded by the critical path of a smart system present in the electricity sector, it is necessary to develop flexible telemetric systems available for prosumers of low nominal capacity.
1.2. Regulatory and standards and analysis
In the following, two reference standards are identified and described.
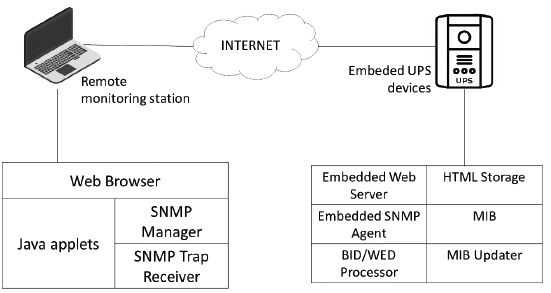
1.2.1. IEEE 1547
This standard refers to distributed resources (DR) connection in power systems. According to [7] the 1547.3 standard chapter gives you a guide for the monitoring, information sharing and control of on-grid DR.
Although guide authors said that “just power systems from 250kVA must be monitored”, relevant characteristics for any monitoring system are described, such as:
a) General Information
b) Characterization of a MIC system (monitoring, Interchanging and control)
c) Parameters for monitoring
d) Information interchange Scheme.
e) Protocols
Fig. 3 shows the reference diagram for data interchange.
1.2.2. RETIE update project - chapter 27.6.20
Furthermore, the project to update the Technical Regulation of Electrical Installations-RETIE [8] includes in chapter 27.6.20 "Equipment for measuring electrical energy, including active energy meters, reactive energy meters, potential transformer (PT), current transformers (CT), enclosure cabinets.
The elements used in the measurement of electrical energy must meet the requirements indicated in international technical standards, international recognition or applicable NTC, such as: IEC 61869-5, IEC 60044-3, NTC 2205, NTC 2207, NTC 2147, NTC 4440, NTC 4052, NTC 4569, NTC 5019, NTC 4540 and prove it by means of product compliance certificate, issued by an accredited certification body. The measurement equipment used in activities of the public electricity service must meet the requirements indicated in the Measurement Code issued by the CREG, according to the type and condition of measurement that is required. The active and reactive energy meters, potential transformers and current transformers, in addition to product compliance, must have a calibration certificate. In the selection of measuring equipment and its installation, the environmental conditions of the particular location must be considered.
1.2.3. Off-grid monitoring regulation
Monitoring activity in off-grid zones is regulated by Resolution CREG 161 of 2008. This resolution defines it as the "activity consisting of the information regarding the collection, administration and centralized processing of the quantity, quality and continuity information of the electric power generation service in the Non-Interconnected Zones, through equipment and information systems.”
IPSE National Monitoring Center (CNM) is a mission area of the IPSE that performs fundamental activities for monitoring the provision of electric power service in the ZNI, helping the responsible entities to ensure the provision and quality of service to the users of said areas; It also provides timely information on electrical parameters for planning, decision making and the elaboration of structural energy solutions.
The IPSE answered to a CIDET’s request for information in document Radicado No. 20151600090631 of July 2015, in which it details the functions of the IPSE Center.
Information flow: Communication is developed through Satellite media with a 99.5% of availability.
Protocols: Variable depending on location and technology.
CNM Activities: Monitoring center must collect, monitor, validate and send generation information to public institutions such as: superintendence, net operator and Energy and Mining Ministry.
1.3. Current LAP Real Time Monitoring system
The real time monitoring system developed by LAP for EQUITEL big gensets is called ARTIMO [10,12]. At this time, the ARTIMO platform focused on both stationary and mobile machines. It is composed of five main sections: Operation, Maintenance, Control Tower, Reports and Management. Table 1 describes the main functionalities of the sections.
The ARTIMO (previously called RTD), allows to receive the ComAp control signals to be received from stationary and mobile Cummins Gensets (EQUITEL) and transmits them to the platform for remote management by ARTIMO team [10].
Although at least three monitoring systems were identified for Gensets or UPS or photovoltaic systems, a developed system was not identified in the review for the three types of systems nor oriented to low power. The Front End and Back-End sections of the ARTIMO platform present the possibility of integrating data reception of other types of low-capacity generator systems, as it is an intuitive design and has an equivalent and affordable language and protocol for the different types of system, an outstanding feature compared to currently known technologies, which presents designs oriented to a specific group of energy generation or backup technology.
Table 1 ARTIMO current functionalities.
| Section | Function |
|---|---|
| Operation | Visualization of location and route of monitored machines in a Google Map. |
| Maintenance | Evaluation of performance of different machine analog/digital variables. |
| Control Tower | Virtual space that centralizes the operation (alarms, alerts, events and tickets) of all assets monitored by the ARTIMO solution, with the aim of being managed by a group of technical experts who are 24 hours a day, 7 days a week, ensuring availability and correct operation of assets. |
| Reports | Execution of special report to plant chief or executives, selecting some indicators and historic periods of variables. |
| Management | Security and general settings characteristics (clients, machines, groups) |
Source: The Authors.
2. Prototype development
Protype development was carried out in the following phases: the identification of requirements, design and elaboration of both hardware and software. The following sub-section contains a description of these activities:
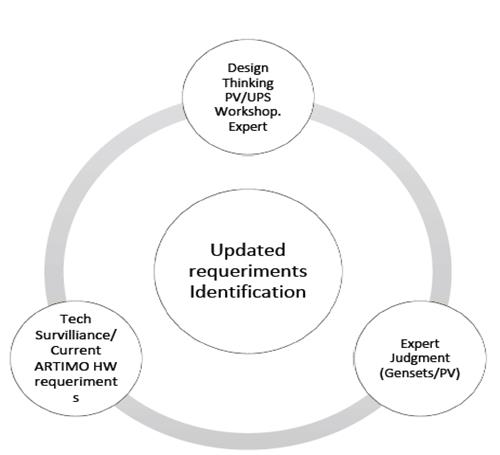
2.1. Updated requirements identification
To fulfill the scope of the project, information was used from three sources: a) Design Thinking Workshop for UPS / PV systems, b) Master workshops with assessment by experts (Generating sets, PV). c) Technological Surveillance (for gensets, PV and UPS) (See Fig. 4).
Starting with the training and structured workshops developed, some common variables of low power PV/UPS systems which could be measured through hardware required input ports designed for first prototype were identified. These include environment/panel surface temperatures and input irradiance.
Additionally, front-end software requirements were identified for the platform to allow for monitoring and maintenance of photovoltaic systems. No needed changes were detected for current tabs and access control rules since new systems currently have the same asset management needs. The need for change in types of variables, alarms values and their visualization iconography for mentioned in the existing Maintenance and Report modules was identified. Table 2 shows recommended icons for visualization for these new variables.
Table 2 Visualization requirements for low power PV system variables.
| Variable | Recommended Icon |
|---|---|
| DC/AC Voltages/Currents | Gauge display/XY display (adjusted variable according to frequency of sampling as is shown in the current maintenance Module) |
| Temperature (Environmental/panel surface/UPS Batteries) | Thermometer with a numerical value. |
| Digital Variable Status (ON-active/OFF-inactive | Digital pilot. |
| Irradiance | Sun icon with a numerical value. |
| Management | Security and general settings characteristics (clients, machines, groups) |
Source: The Authors.
2.2. Design and manufacturing of device
Device manufacturing was iterative, based on different tests. Hardware for the first prototype was composed of three terminal blocks for analog and digital signals along with a terminal block for DC/AC power supply and finally one for Modus Protocol (RS-232 or RS-485 inputs). Fig. 5 and Table 3 show and describe the developed.
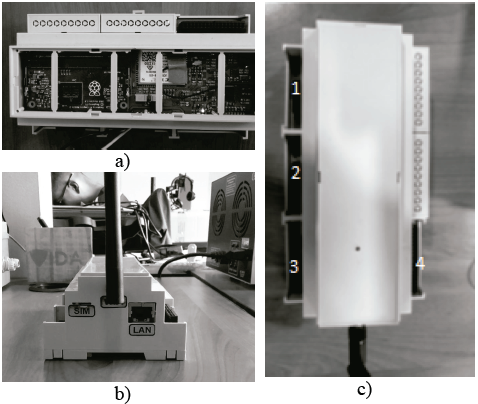
Source: The Authors.
Figure 5 Developed Prototype views: a) Top board b) Right Side c) Terminal blocks identification.
Table 3 Input description of monitoring device.
| Terminal Block | Correspondent Input |
|---|---|
| Terminal Block 1 | AC Supply DC Supply Input 1 and 2: AC Voltages up to 500 Vac |
| Terminal Block 2 | Line A RS485; Line B RS485; GND; RX; TX; GND Relay Output 1; Relay Output 2 |
| Terminal Block 3 | Digital Inputs 1 to 4 |
| Terminal Block 4 | Analog Inputs 1 to 3 (0-5 Vdc or 4-20mA) |
Source: The Authors.
In Fig. 5 a) the top side of the uncovered device is presented where the processor and communication signal adaptation board are visible; 5-b) shows the right-side view where Sim card, Wi-Fi Antenna and RJ-45 LAN ports are disposed. c) Top side of covered device, that shows the numbering and location of terminal blocks. (See Table 3)
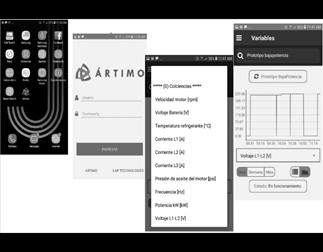
2.3. Mobile app development
Likewise, a mobile app for system management was designed and tested. The user could employ this application for getting into the same system that is on the ARTIMO web [10 ] and watching the state (value and dynamics) of the variables of any system-under-monitoring. This app was initially designed only for Android operating system. Fig. 6 shows the mobile's desktop screen as well as sign-in screen shoots, list of variables and trend graphs in the application.
3. Field tests
This section describes the test planning and execution processes, and the design and visualization of the report dashboards both for a genset and a photovoltaic system.
3.1. Test planning and execution
Finally, the lab and field tests were developed for two different kind of generation systems of interest: a genset diesel 250kW system located in the installations of EQUITEL in Mosquera, Cundinamarca [12] and a hybrid PV-Wind 1kWp system located in CIDET Laboratory in Ancon Sur, Sabaneta, Antioquia, both in Colombia.
For both kind of systems, a test protocol was developed, which consists on the following activities:
a) Firmware configuration test of the device according to the condition of the generator.
b) Hardware device instrumentation test according to the condition of the generator.
c) Connection test.
d) Operation Test.
In Table 4, the main characteristics of the genset in testing are described. Fig. 7 shows the prototype installed in the cabinet of a 250kW genset during data transmission.
Table 4 Technical data of genset system where the CAMKIT telemetry prototype was tested.
| System | Manufacturer | Module | CM version | Serial Number |
|---|---|---|---|---|
| Engine | Cummins | QSL-9 G5 | Stationary | 36546311 |
| Electrical Plant | Cummins | C250 - D6 | 1 | h16t038639 |
| Rules System | Comap | GEN220Vac24Vdc 60Hz3P_RTM | - | - |
Source: The Authors
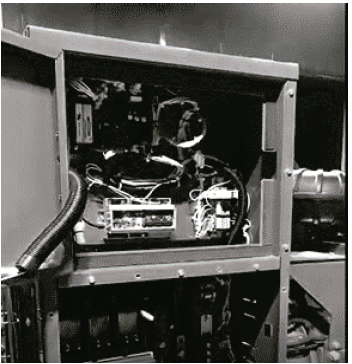
Fig. 8 shows the ARTIMO web platform reporting engine speed and L1 line current variables data. As was observed, the transmission of the variables was reported in real time correctly during the day in the ignition, operation, off and stand-by modes.
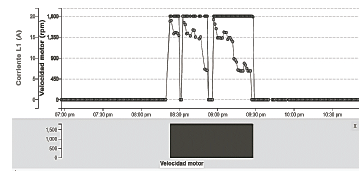
During the test it was also possible to verify the simultaneity between the data displayed in the application and those reported in the web platform.
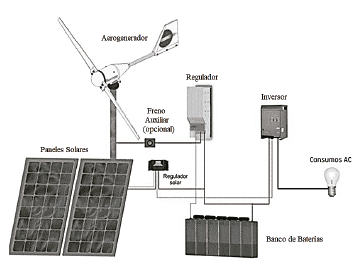
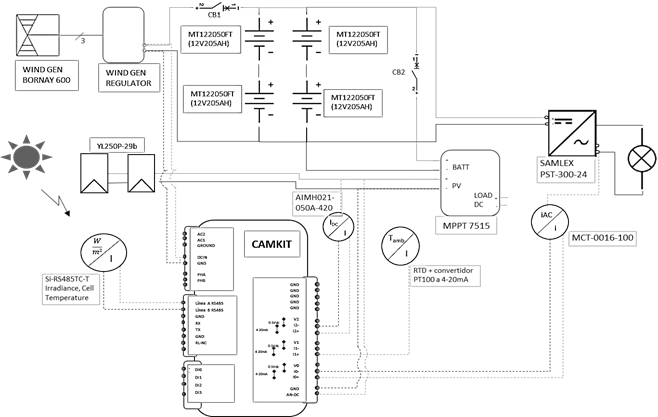
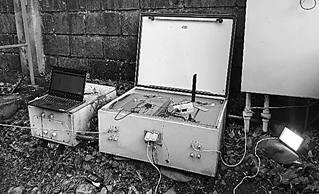
On the other hand, in Fig. 9, a scheme of the hybrid photovoltaic-wind system being tested is shown. Fig. 10 presents the wiring diagram including the PV instrumentation sensors and the CAMKIT device while the instrumentation developed in the real hybrid generation system is presented in Fig. 11
Source: The Authors.
Figure 9 Scheme of hybrid generation system (PV-Wind) under which the telemetry prototype is tested.
Source: The Authors.
Figure 10 Wiring diagram of PV-Wind system including the instrumentation with PV KIT sensors and CAMKIT device.
Source: The Authors.
Figure 11 CAMKIT device installed in the enclosure of the photovoltaic hybrid system during transmission testing.
The temporal location of the telemetry device on the battery bank inside the enclosure, whose GPRS antenna is initially in vertical position. In this session, the following sensors were installed: ambient temperature, irradiance/panel temperature, DC current and DC voltage (before inverter), AC current and AC voltage (after inverter) as well as the wiring such as planned.
Monitoring of data between the sensors and device, and between device and ARTIMO server was performed starting with the installation [10]. The transmission of the data fell between 1 and 3 hours approximately from the time it sarted (similar to a problem of intermittence that came up during the trial of the electrogene group), which meant less than 20% of day availability. as well as a variable unexpected sampling rate in the platform. Likewise, a problem of unpredictable variation was identified. Finally, the firmware was modified in order to not store the data queue with each frame sent to the mobile network, solving the transmission fall situation.
Also, it was discovered that changing the antenna angle solved the variable sampling rate problem as programed in the firmware. After several test sessions, it was observed that the CAMKIT system stays at the programmed sampling rate when the antenna is disposed in the horizontal plane, a 90° with respect to main axis of device, as long as it is more than 20 cm from the metallic enclosure walls.
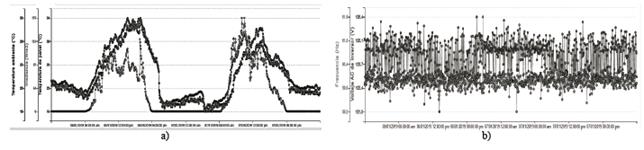
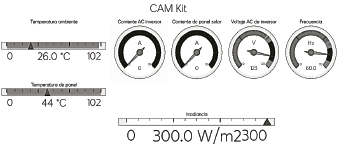
In Fig. 12, the variables report shows a continuous transmission from January 06 to January 08-2019. There it is observed the daily dynamics of solar irradiance, its correlation with the temperatures as well as the AC Voltage and frequency variables in the inverter output, which are stable between 120/127 Vac and 59Hz and 61Hz throughout the period of observation. Fig. 13 shows the bar and gauge diagrams which indicate the values of the variables of the PV system values in the platform in order to have a real time monitoring.
Source: The Authors.
Figure 12 Variables data reported from January 06 to January 08 - 2019: a) Irradiance, Ambient Temperature and Panel Temperature.; b) Frequency and Voltage AC.
3.2. Platform reports
Finally, a series of control panels were designed for allowing the plant managers and employees in charge of plant monitoring to have summary information about performance and output energy of telemetered systems.
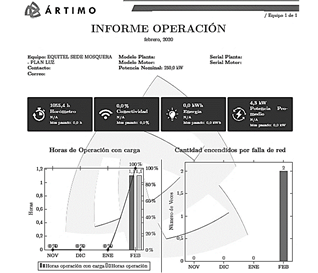
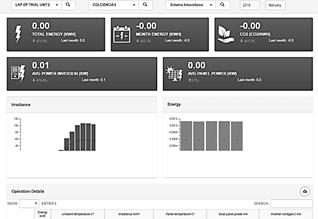
Fig. 14 shows an example of virtual control panel, in which the real accumulated data of main variables are reported relative to generator operation, such as operational hours, connectivity percentage, generated energy and average power, as well as other operational details. Additionally, Fig. 15 displays a preliminary control panel design delineated for photovoltaic systems.
The procedure of integration of data into this reporting dashboard is currently in the testing process.
4. Conclusions
It was possible to develop a telemetry system as a management and monitoring solution for the following backup or low capacity power generation systems: gensets, UPS and photovoltaic systems; This was done by performing a requirement survey, hardware, firmware and software development, and laboratory and field validation tests.
To achieve the general objective, it was possible to adapt and create new modules in ARTIMO that allow users to manage and supervise their low capacity energy generation or backup systems [10]. This allows, through a versatile platform, to accelerate the introduction of enabling technology to leverage the IoT in the road map of an intelligent Colombian electrical sector.
It was possible to verify through the test protocol performed at different input power voltages, the correct operation of the device up to the permissible limits power inputs limits. Thusly, the correct registration of each one of the states of the inputs and outputs recorded in the logs was validated. They were stored in the memory of the device during each test
It was possible to verify the correct transmission of data to the LAP server through the 3 different types of connectivity offered by the device (GSM / GPRS, ETHERNET and WIFI); in each of the tests it was possible to track the corresponding data frames, coherently with the state of the inputs and outputs of the device.
The configuration tests had a successful result using the two methods provided in the prototype (LAN configuration using ETHERNET and via Wi-Fi), in all the tests the correct sending of the configuration file from the software destined for this purpose has been verified. The corresponding reception in the device has also been checked.
The device approves the protocols that validate its general operation by means of the proposed conditions in its design.
It was possible to verify the expected behavior of analogue, digital, and MODBUS inputs both in its acquisition by the device and in its correct transmission to the LAP Technologies server, as well as the correct registration of the data on the ARTIMO platform and its proper presentation on this platform [10].
It was possible to verify the correct visualization of variables monitored through the prototype created for the project within the ARTIMO platform [10]. By means of a trend graph it was possible to immediately verify the changes of magnitudes and states of each one of the variables acquired within the last 6 hours; in the same way it is possible to perform a historical query that allows to review trends much broader trends.
Graphic indicators can be read in an easy and intuitive way if the real-time value of each of the variables is within the admissible limits or is within values for revision or failure.
The generation of events was verified based on changes in the state of the device variables, as well as the functionality of managing each of these events, generating alerts, closures or necessary changes.
Additionally, it has been possible to verify the correct development of an application for Android mobile devices that accounts for the correct treatment of the variables monitored through the prototype created for the project.
It was possible to corroborate the correct linkage and parallel operation of the mobile application with the ARTIMO platform, all the information between the web platform and the mobile platform agrees and is consistent with the operation of the device. [10].
Two field testing and instrumentation tests were carried out on the CAMKIT telemetry prototype: one in a 250kW generator set in Cummins de los Andes, Mosquera, Cundinamarca and another in a hybrid PV-Wind generation system of 1kWp in CIDET Laboratory of Sabaneta, Antioquia.
The Front End could be evaluated correctly according to the design parameters of this, and from an external access to LAP Technologies, as are the user credentials assigned to CIDET.
During the testings in Mosquera, using the gen-set as test system, the correct report of the test variables could be evidenced: Motor speed (rpm), phase current L1. (A), Battery Voltage (V) and Coolant Temperature (° C).
During the days of remote monitoring of the photovoltaic system tests in the CIDET Laboratory, it was possible to demonstrate the correct report to the ARTIMO platform of the following variables: Irradiance (W / m2), Panel temperature (° C), Ambient temperature (° C), DC current of solar panel and AC current of the inverter.
It was possible to correct the intermittence of communication and the instability in the sampling rate, making a firmware update and optimally locating the antenna, thus being monitored permanently from December 13 - 2018 (date of the test in the PV-Wind system) to presentation date of this article.
Issues were clearly identified in both tests which will allow for feedback the CAMKIT monitoring product manufacturing in terms of hardware, firmware and software.
Finally it was possible to move forward in the level of technological readiness of the system, due to the fact that the gaps identified in the introduction of this document were impacted: Situational awareness is increased in real time in the state of the backup generation systems and low capacity solar generation, which allows the optimization of resources and time for the restoration of generation systems in the event of failure.

