


 Inglês (pdf)
 Artigo em XML
 Referências do artigo
 Enviar este artigo por email
 Citado por SciELO
  Citado por Google
  Similares em
SciELO
Similares em
SciELO  Similares em Google
 Permalink
1. Introduction
The technique of cathodic arcs applied to the growth of thin films is very attractive by high deposition rates achieved by the properties of the plasma generated in the discharge, because of its high degree of ionization, high ion density and simplicity of the method compared to other methodologies. The cathodic arcs are pulsed or continuous electrical discharges of high current (~ 100 A) and low voltage (~ 20 V), which are held between two electrodes immersed in a vacuum chamber [1]. Since the cathode surface is ejected, a plasma jet is formed by metal ions with energies between 20 and 100 eV and an ionization degree higher than 4 in some of these ions. The ionic current carried by the plasma jet is about 10% of the total current. By Placing the magnetic field parallel to the direction of propagation of the plasma jet, will allow to concentrate the ions and thus to increase the density of them [2].
The uniformity of the coating thickness depends upon the technique used; the deposition profile, and radial distribution of deposited film thickness, It is the plasma density profile (radial distribution of the plasma density in the region immediately adjacent to the substrate). The radial density profile is generally bell-shaped, with a distribution that depends on the details of plasma generation and transport (magnetic concentrator geometry, for example) [3]
The main disadvantage of vacuum arc deposition is the emission of macroparticles (MPs) from the cathode. MPs in the coatings produce protuberances and depressions on the surface that not only increase the roughness, but also degrade mechanical properties3. Employing a magnetic field, parallel to the propagation direction of the plasma jet, the ions concentrated on this direction and the plasma density increases. Thus, the deposition rate increases and the fraction of MPs decreases [4], Other studies, show that increasing the frequency and width of the pulses decreases the number of macroparticles [5]. Deposition of MPs into the substrate was significantly decreased after 1 min of processing at bias [6], applying short-pulsed bias leads to a 250-fold decrease in total macro particle number [7].
The cathodic arc technique yields a high deposition rate, about 60 nm/min [8]. Due to the high energy consumption, higher hardness is obtained than that resulting from using the sputtering technique [9,10].
In this study, we use the technique of continuous arc and mechanical and morphological characterization of thin films deposited with white copper and titanium. The results allow comparing the characteristics of the films, the different profiles, and the hardness, according to the sample position in the magnetic concentrator (variation of the magnitude of the magnetic field). Thin Ti films grew on stainless steel AISI 316 with a DC cathodic arc by using a magnetic concentrator. Substrates were placed facing the cathode at different distances with respect to the entrance of the straight duct. The morphological and tribological features of the coatings were studied. SEM examined the film surface; a profilometer allowed studying the uniformity of the films. Hardness measurements were performed using a Nanovea nanoindenter and wear tests by a CSEM tribometer.
Titanium used in biomaterials has been taken as a reference, considering the most recent advances in surface modification techniques and coatings for antibacterial applications [11,12]. In contrast, copper was chosen for the behavior of plasma in its evaporation and deposition on 316 or 304 steels [13].
2. Experimental procedure
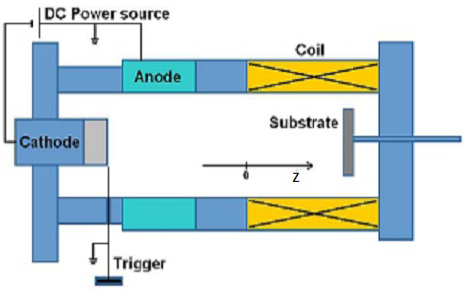
The continuous arc system consists of two electrodes: a cylindrical cathode with a 60 mm diameter and a copper anode, connected to the ground, placed coaxially. The electrodes were water cooled during the operation of the instrument. At the exit of the anode is a straight cylindrical tube, electrically isolated from the electrodes around, which was a coil that allowed applying an axial magnetic field [2]. The arc generated by a DC source of 18 kW and the vacuum system is composed of a mechanical pump and a diffuser, with a pressure of the order of 10-8 bar. The substrates, located in an electrically isolated sample holder, can be left floating or polarized with respect to the plasma and moved along the axis of symmetry of the system. The cathode, negatively polarized with respect to the anode earthed, the electrode system was refrigerated during the measurements. Fig. 1 shows a schematic drawing of the configuration used.
Titanium and copper were used as cathodes, with a discharge current of 120 A. 316 stainless steel substrates of 30 mm diameter were used and placed in an electrically insulated sample holder system left floating or biased at -40 V with respect to the plasma. The sample holder was placed along the straight tube and facing the exit of the two electrodes system. The magnetic field generated by the coil in the center of the tube was set at 120 Gauss. To control the temperature, samples were placed in an oven.
The substrates were 316 stainless steel disks. They were placed at different axial distances (towards the cathode) from z = -5cm, z=0 cm, z==5cm and z = 10 cm, where z = 0 the start of the coil in the straight duct where B=0; this is mounted on a heater that holds the temperature at (210 ± 10) ºC. The exposure time to the discharge for growing the films was 150 s. The axial magnetic field in the center of the coil was 120 G, being uniform for z> 5 cm. The substrates were polished to the mirror, initially cleaned with isopropyl alcohol and then with ultrasound for 20 minutes.
Regarding the measurements, the magnetic field was characterized with a non-commercial Hall probe, previously calibrated and the average thickness of the coatings determined by gravimetry measuring, from the weight of the substrates before and after growth of the films. Thickness was also measured using a Calotest with a steel ball of 22.2 mm and diamond paste; thickness was measured at 10 points along the diameter of the coating; characterization was made using an Olympus BX60M optical microscope to find deposition rates and specific thickness. It was also measured with a profilometer a KLA Tencor ALPHA STEP profilometer was used to find the deposition profiles along a continuous diameter of the coating obtained; the profilometry parameters were standardized for the thickness and the sweep along the diameter up to 3cm. This same equipment was used to characterize the number of macroparticles present, using the filter that recognizes heights from 2 to 10 microns.
The morphology was also characterized for visual recognition and showing the evolution of the macroparticles present at different positions of the substrate, using a scanning electron microscope (SEM). The chemical composition was studied by EDS, taken in the center of the sample. The adhesion of the coatings was evaluated using the test tape with a commercial adhesive tape to recognize the minimum adherence. The determination of the Wear was made by the Ball-on-disc test, using a 100Cr6 steel ball and 1N load; the hardness was measured with a team NanoIndenter Nanovea and using the Oliver and Pharr model with a maximum load of 5 mN; the thickness of the coating was measured and the indentation performed with the 10% depth criterion.
3. Results
3.1. Chemical characterization
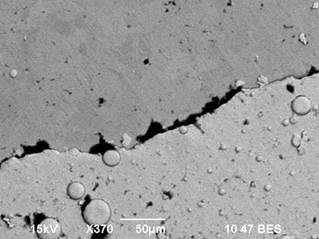
Fig. 2 shows a typical image obtained by SEM of a copper coating. In the upper part of the image, the stainless-steel substrate is observed, while in the lower part, the copper coating can be seen with the presence of the particulates typical of the deposition technique. Fig. 3 depicts a spectrum obtained by EDS on the copper film, taken in the center of the sample, with the presence of copper and, to a lesser extent, the elements making up the substrate.
Source: The Authors.
Figure 2 SEM image of the substrate (upper part) and the copper film (lower part).
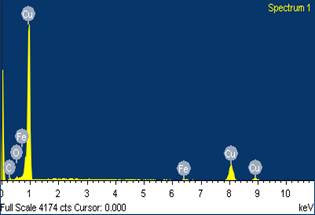
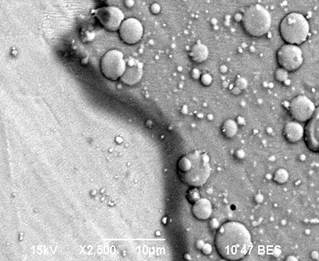
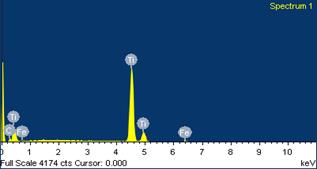
Fig. 4 shows a typical image of a titanium coating obtained by SEM. On the left appears the stainless steel substrate, while on the right, the titanium coating with the presence of macroparticles is observed. Fig. 5 displays a spectrum of the titanium film obtained by EDS, taken in the center of the sample. The presence of titanium and, to a lesser extent, the elements making up the substrate can be seen.
Source: The Authors.
Figure 4 SEM image of the substrate (left part) and the titanium film (right part).
3.2. Characterization magnetic field
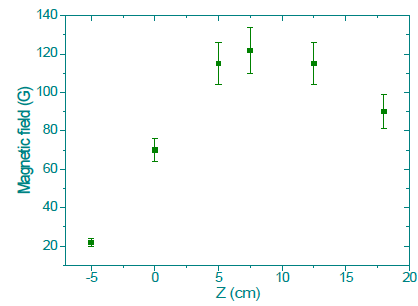
The characterization of the magnetic field, in the interior and along the filter, gives a profile with the maximum value in the center of the filter, 120G, which decreases towards the ends up to 60G. The outcome appears in Fig. 6.
3.3. Characterization of deposition rates
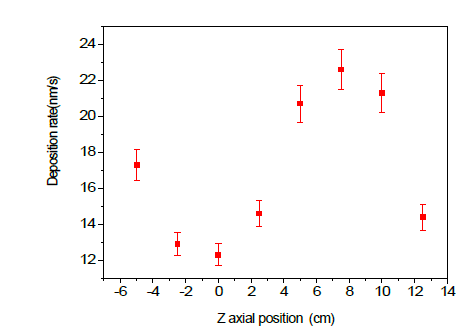
The rate of film deposition inside the magnetic concentrator is maximum where the magnetic field is maximum and decreases towards the ends of the duct, as shown in Fig. 7.
3.4. Discrete profile characterization
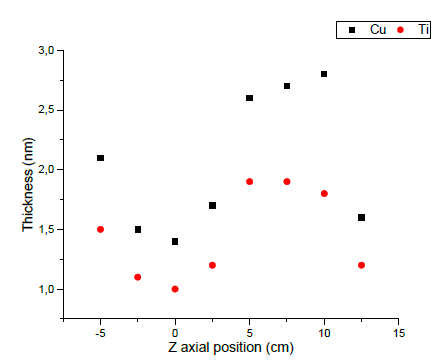
The average thickness results estimated for both copper and titanium coatings grown in different positions (z) along the straight pipe are plotted in Fig. 8. In both materials it is observed that for z <0 (closer to the cathode) the thickness decreases. This is due to the divergence of the ion jet ejected from the cathode surface in all possible angles. The lines of the magnetic field concentrate in zones (z> 0), confining the ionized particles to a region closer to the axis of symmetry, resulting in the increase of the deposition rate. The highest average thickness is observed for films grown for z in the range 5 - 10 cm. For z greater, the rate decreases again due to diffusion of the beam and the magnetic field lines begin to diverge.
Source: The Authors.
Figure 8 Average thickness of copper and titanium coatings depending on the position of the sample.
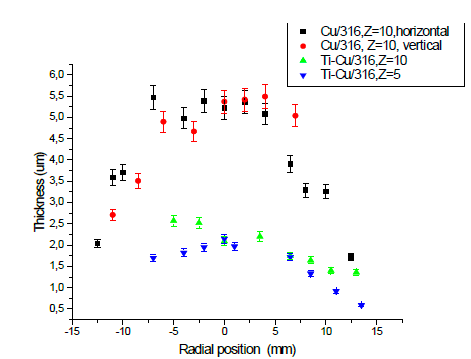
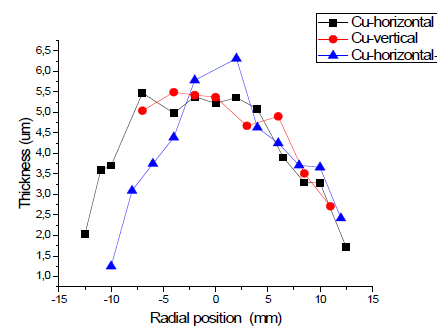
The profile of the coatings for both copper and titanium grown within the area with the highest deposition rate (z = 10 cm and z =5 cm) was studied. The thickness was measured with Calotest in different positions of each sample. For the profiles obtained along different directions (diameters) an average was calculated for each radial position, which are displayed in Fig. 9. Both materials show a region in the center of the samples where the thickness is uniform. For copper, this region is approximately 4 mm in radius, while for titanium it is about 8 mm. Towards the edges, the thickness decreases gradually, obtaining a oblate profile, with a higher gradient in the case of copper. The decrease in thickness when moving radially is due to the magnetic field that confines the ions to the central region.
3.5. Characterization of continuous profiles.
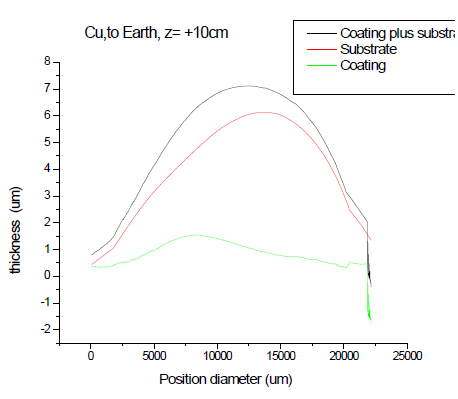
The profiles obtained with the profilometer for the coating of Cu are shown in Fig. 10. The upper curve corresponds to the coating plus the substrate, the middle curve is the profile of the substrate and the lower curve is the difference between the upper and the middle curve, which corresponds to the profile of the Cu coating.
Source: The Authors.
Figure 10 Profiles in a sample Cu / 316, Z = + 10cm, to earth and with temperature.
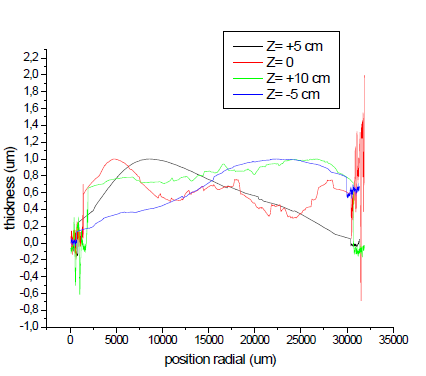
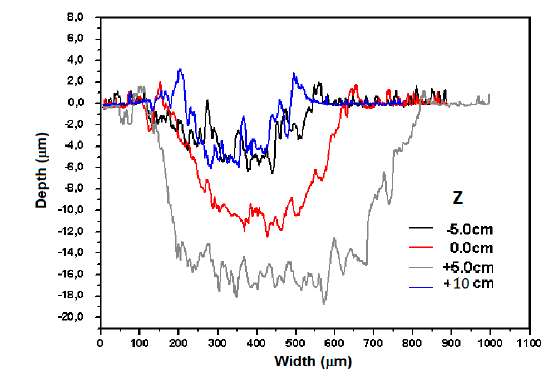
For different axial positions Ti coatings were made and the radial profiles measured with the profilometer, samples in the same floating condition, with concentrator polarized at +18V and at different positions with respect to the entrance of the magnetic concentrator (z=+5cm, z=0, z= -5cm, z=10cm). Fig. 11 displays the results.
Source: The Authors
Figure 11 Radial profiles of Ti coatings measured with the profilometer for different axial positions
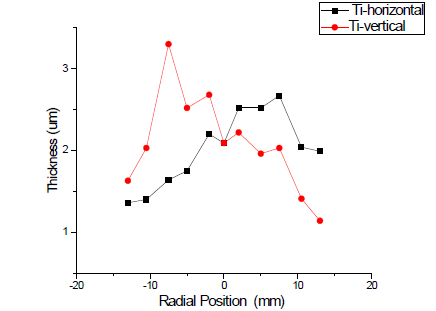
In another sample, the profiles were measured with the Calotest technique, along two diameters perpendicular to each other. The results are shown in Fig. 12.
Source: The Authors.
Figure 12 Radial profiles (Ti) for perpendicular diameters measured with the CALOTEST technique.
The profiles measured with Calotest for Cu coatings in different samples are shown in Fig. 13. The samples were placed under the same conditions: floating, with the filter polarized at + 18V and at an azimuth distance z = + 10cm with the filter polarized at + 18V and at an azimuth distance z = + 10cm.
3.6. Macroparticle characterization
3.6.1. With profilometer
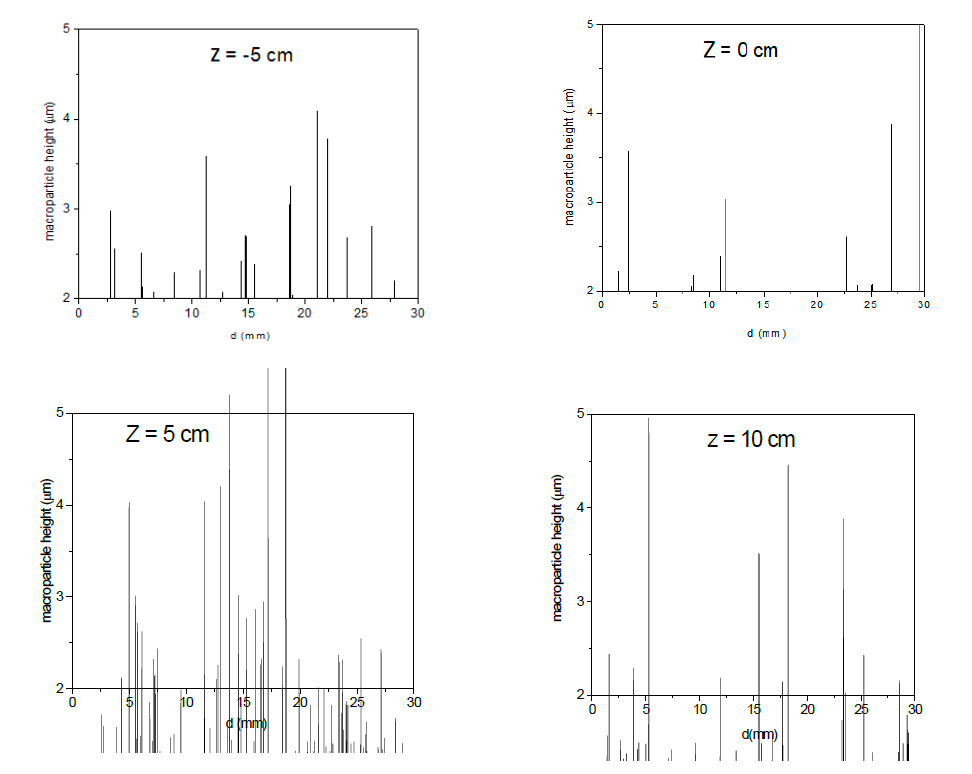
The titanium films grew at different positions have macro-particles with heights higher than 2 μm, along a diameter d, at different Z positions, -5cm, 0, +5cm and 10cm, the signals were obtained with a profilometer and shown in Fig. 14.
3.6.2. With SEM.
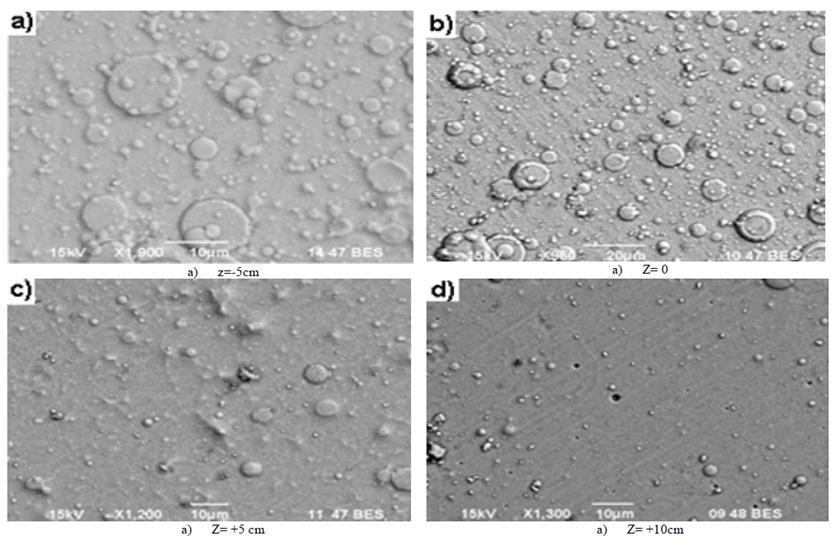
The placement of the substrates was farther from the cathode surface and the MP size and number diminished, thus decreasing the surface roughness, Fig. 15 illustrates the images.
3.7. Tribological and mechanical properties.
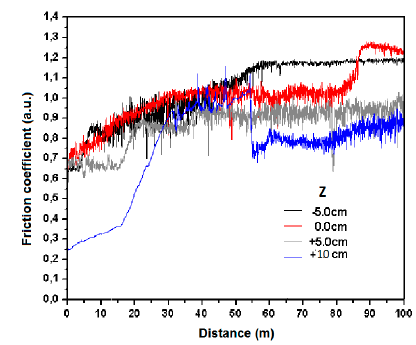
Ti films grown in all axial positions z were characterized. In the determination of the Wear, the results show that for the central positions where the field is maximum, the wear is minor, as shown in Fig. 16. The friction coefficient decreased as the cathode-sample distance increased, as shown in Fig. 17, This fact can be attributed to a lesser number and size of MPs on the coating.
Source: The Authors.
Figure 17 Relative friction coefficient as function of sliding distance in the ball-on-disc test.
The hardness of Ti films grown in all axial positions z, were characterized. The maximum depth for the charge used was approximately 100 nm. The results are summarized in Table 1.
Table 1 Values of the mechanical and tribological properties.
| Position Z(cm) | Hardness H(GPa) | Elastic modulus E (GPa) | wear rate mm 2 /Nm | Friction Coefficient |
|---|---|---|---|---|
| 5 | 7.6 | 149 | -3x10⁻⁷ | 1.0 |
| 0 | 8.2 | 133 | -8x10⁻⁷ | 0.97 |
| 5 | 5.2 | 138 | -2x10⁻⁶ | 0.83 |
| 10 | 8.7 | 162 | -3x10⁻⁶ | 0.72 |
Source: The Authors.
The recorded values can be associated with the nanohardness of the film. For the films obtained at different positions, the hardness and elastic modulus are higher where the field is maximum. Table 1 summarizes the values of the mechanical and tribological properties.
A different approach was also carried out to evaluate hardness at different radial positions, in several axial points, as shown in Table 2, recognizing the influence of the profile on hardness values.
Table 2 Hardness values for different radial positions.
| Position Z(cm) | Field (Gauss) | Hardness in (0,0) E (GPa) | Hardness in (0,-5mm) mm2/Nm | Hardness in(0,5mm) Coefficient |
|---|---|---|---|---|
| 5 | 22 | 7.8 | 3.7 | 9.4 |
| 0 | 70 | 8.3 | 9.9 | 8.6 |
| 5 | 120 | 11.8 | 10.5 | 11.0 |
| 10 | 120 | 6.1 | 5.2 | 9.4 |
Source: The Authors.
Studies of the mechanical properties of copper were not performed, considering that with titanium a response was obtained regarding the distribution of profiles and macroparticles in coatings by the continuous arc technique.
4. Discussion
Figs. 2-5 show that the coatings obtained are titanium and copper; Figs. 6 and 7 show that the intensity of the magnetic field in the duct depends on the axial position, as well as the deposition rate, which increase in the position where the magnetic field is maximum. Fig. 8 confirms the behavior of the deposition rates through the obtained thicknesses reflecting the same behavior. The radial profiles measured in copper and titanium with the Calotest and the Profilometer techniques show a variable distribution decreasing towards the ends for the same axial position. For different axial positions, the distribution is similar, flared but not symmetrical and moves from the center. There is a common recognized behavior in all cases: in a narrow region, in the center of each coating, it coincides with the value of the average thickness.
The figures that record the presence of macroparticles determined by profilometry and SEM images show that when the sample moves away from the cathode, the macroparticles decrease in quantity and size when they are less than 3 microns but the ones larger than 3 microns hold, if the sample approaches the center of the duct where the magnetic field is maximum. The SEM characterization shows the same result. The size and quantity of macroparticles decrease when the sample moves away from the cathode.
The figures depicting the tribological properties show that the wear and the coefficient of friction have the lowest values in the region where the magnetic field is maximum. The behavior is similar for the hardness and the elastic modulus.
The hardness values obtained at other points, both 5mm to the left and 5mm to the right on one of the spokes show variations generated by the profiles of the coating and of the substrate. The thickness can be greater or lesser and the inclination positive or negative, so the indenter does not incline perpendicularly, giving rise to readings higher or lower than the real value.
These results allow us to conclude that when using the continuous arc technique, the profiles of the coating depend on the radius and the axial position that do not have a symmetrical flared distribution, which reflects the plasma density profiles. In the region immediately adjacent to the substrate, these profiles change for each axial position. That is, when the plasma enters the magnetic concentrator its distribution is altered by the geometry of the concentrator.
The continuous arc deposition technique shows high deposition rates. For a deposition time of 6 min, we measured average thicknesses values of 2.7 and 1.8 μm for copper and titanium, respectively, in the region of maximum confinement of ions. The maximum thicknesses were obtained in the central region of the films and resulted in approximately 5 and 2 μm for Cu and Ti, respectively, as the coating influenced the measured values. Studies by EDS found that the films are composed of contamination-free metal. The hardness observed in titanium films is within the range of values reported in the literature. The coefficient of friction diminished due to the decrease of the surface roughness, when the substrate was placed farther from the cathode, well inside of the magnetic duct.
5. Conclusions
Hardness characterization is important in coatings produced by the continuous arc technique and in knowing the profiles of both substrates.
The coatings deposited by this technique show the presence of macroparticles, thus posing an engineering disadvantage in applications that require better tribological properties and / or resistance to corrosion. For such applications, the use of particulate filters is required. The studies carried out demonstrated that the position of the samples strongly influenced the homogeneity of the surface and the number of existing MPs on the coatings. The relevant results show that the profiles of the coatings are not uniformly distributed as they have a central region of maximum thickness which decreases towards the ends by up to 50%.
The films show the presence of macroparticles that decrease with increasing axial position; the coefficient of friction and the wear rate decreased when the substrate was placed further from the cathode. The highest values of hardness, the lowest coefficients of friction, and the lowest wear were obtained in the region where the magnetic field is highest.
Best mechanical, morphological and tribological properties, such as highest hardness, lowest coefficient of friction, and lower wear rate were obtained at the position where the magnetic field was maximum.

