


 English (pdf)
 Article in xml format
 Article references
 Send this article by e-mail
 Cited by SciELO
  Cited by Google
  Similars in
SciELO
Similars in
SciELO  Similars in Google
 Permalink
1. Introduction
Mining, aeronautics and defense are industries characterized by the intensive use of equipment to efficiently support a number of operations. Thus, the management of spare parts or components plays a key role due to its direct impact on equipment availability, minimal cost management and associated risk reduction [1,4,6,14]. In this regard, the management of components has attracted a great deal of interest, resulting in studies addressing its relation to downtime minimization, the calculation of optimal stock level, the development of software with holistic approach and so on [1].
However, due to the variety of processes and conditions in the industries, it is not feasible to generalize a strategy for all equipment or applying all different kinds of strategies to the same equipment [2]. In this sense, further studies aiming to elucidate the management of components for specific cases are required.
Among the equipment/machinery requiring specific strategies and analysis due to their large-scale, high capital cost, and impact on mineral extraction activities, are hydraulic excavators. These are considered critical pieces of equipment because they set the pace for production operations. Indeed, the division responsible for managing the repairable and non-repairable components of excavators constantly struggle with the risk of stopping the machinery due to the unavailability of stock-parts. This fact may cause significant earnings losses as well as the high cost of capital for the cost of the components involved, [3,7,8]. Moreover, due to the number of variables involved in the management decisions for these components, and despite the current methodologies for addressing the problem, these efforts have not been incorporated within the component management policies of the companies. Hence, it is important to provide stronger evidence for improving the understanding and applicability of these methodologies.
This study focuses on developing a cost optimization model after streamlining the replacement times for critical repairable components used in six EX5500 hydraulic excavators operating at an open-pit mining site. The model is based on assessing the benefits received from a base component replacement policy, which relies on the mean times between failures (MTBF) provided by the excavator manufacturer, and from a policy that estimates replacement times from the actual mean times between interventions (MTBI) obtained from the corrective and preventive intervention history records kept for the same excavator fleet.
2. Methodology and related theories
2.1. Analyzed equipment and operating conditions
This study is based on a real case where the components must withstand one year of operation for 6 model EX5500 hydraulic shovels, each with a bucket capacity of 35.5 m3, operating in an open pit gold mining site located between 3500 and 4100 meters above sea level. These are the highest capacity shovels that the company has, operating approximately 20 hours a day, 365 days per year and are assigned to the processes of extraction and loading onto 793C trucks.
2.2. Selection of critical components
The first step in spare parts management is to classify the components as either critical or non-critical [4]. For repairable critical components, the company decides the stock. So, according to the factory there are twenty-five repairable critical components per excavator. From this set of components, only the most critical were selected.
Considering the Pareto's main limit, i.e, pre-selection based on a single criterion, the DDC was used as an alternative for selection. This is a variant of the diagram of Jack-Knife for dispersion (DJK) used by Knights in 2001 to prioritize data due to unplanned downtime due to power failures. [2,5,9,10,12]
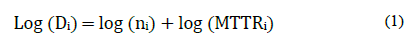
Starting from the maintenance unavailability in the period i (Di), which is a function of the failures frequency (ni) and the mean time to repair (MTTRi), the DJK uses a logarithmic scale that enables prioritizing due to maintenance unavailability, as shown in eq. (1):
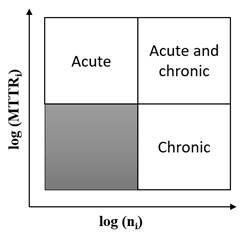
In Fig. 1, the X-axis represents the failure rate while the MTTR is shown in the Y-axis. The diagram is divided into four quadrants, which allows for identification of only acute failures (left-upper quadrant), chronic failures (right-lower quadrant), and acute and chronic failures (right-upper quadrant). The components with the record of events that approach the upper right quadrant are the most critical, since they generate the greatest unavailability [10].
Both, the DDC and DJK are logarithmic plots but the latter prioritized based on the overall cost per unit of time (Cg) which is obtained from the specific overall cost (Cgei) and the unavailability (Di) as shows eq. (2):

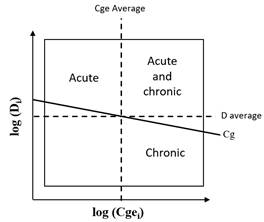
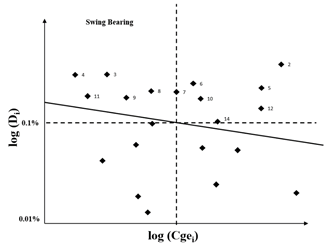
Fig. 2 presents the Cge versus the unavailability. Again, the upper right quadrant allows for identification of the components with the most critical record of events, but this time, they are used to generate greater Cg. Nonetheless, this study considers components above the overall cost line (oblique line) comprising both those that generate higher overall cost and higher unavailability.
The costs to be evaluated can be as extensive as required by the study and may vary according to the discipline. For instance, in maintenance, one may consider the direct cost, failure stopping cost, the cost of investment in reliability, among others. [11-13] In this study the cost of each component and the corresponding loss of earnings, valued at approximately 48 126 USD / hour, were taken into account.
2.3. Determination of the optimal replacement time for repairable components based on overall cost
2.3.1. MTBI parameter calculation
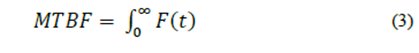
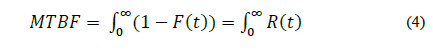
The proposed policy consists of determining the optimal replacement time for each repairable critical component based on the fault history of the excavators, instead of using the time provided by the supplier of the equipment (MTBF of manufacturer). In order to determine the optimal replacement time based on the historical fault record, we adopt the MTBF indicator, which means the average time between corrective maintenance incidents. The MTBF can be computed from eq. (3), but rewriting it in terms of the reliability metrics, it adopts the form expressed by eq. (4):
Where:
F(t) = failure function
R(t) = reliability function
On the other hand, in real scenarios where policies for preventive strategies are common, the MTBI (also known as MTBR) is more appropriate than MTBF. This is because the interventions include corrective and preventive maintenance [9,12,14]. In literature, it is common to use MTBF and MTBI interchangeably. Note however that this is valid only when the corrective strategy goes to infinity since in this limit, the MTBI also converges into eq. (4), [12,15].
The historical fault data in our study, incorporates censored data corresponding to components that were removed before failure, either due to manufacturer recommendation or indication from the condition monitoring area. We called this period the optimal mean time for replacing components (MTBIo). The difference between MTBI and MTBF beyond the definition, lies in the handling of the historical fault record, which by containing censored data may affect the reliability function [12]. The reliability is the probability of a piece of equipment operating for a given period under certain operating conditions. It is given by the failure rate function F(t) and the reliability rate R(t) that is equal to 1 - F(t) [16]. The reliability measurements at each failure time are important for determining the probability function model that best represents them. This function is in turn, fundamental for calculating the MTBI.
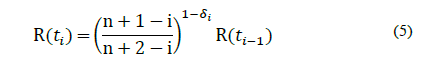
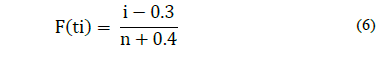
To determine the reliability metrics of critical components, the failure stopping time expressed in machine working hours were used. The data was sorted in ascending order and the output condition of the component was identified by using delta-one (δ=1) for censored data and delta-zero (δ=0) corrective data. Then, we proceeded to estimate the probability of failure. If the historical data contain censored data and fault data, we used the formula of Lewis, eq. (5), which estimates the probability of failure F(t) from the reliability R(t). On the other hand, if only fault data was available, Bernard's midrange formula was used for samples less than 100, eq. (6) [9] and [12]:
Where:
n = sample size
i = number of failure order
δ = 1 if censoring occurs
δ = 0 if failure occurs
R(t_(i-1)) = previous reliability
Where:
n = sample size
i = number of failure order
2.3.2. Calculation of replacement policy comparison parameters
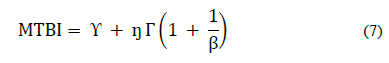
Once the probability of failure was calculated, the probability distribution that best fits the data was chosen. For this purpose, the linearization approach was used to plot the fault data on the X-axis and the probability of failure F(t) in the Y-axis, then the correlation coefficient R2 was calculated. The distribution with R2 closest to 1 is the criterion for selection. The modeled distributions for each component include: normal, exponential, and two- and three-parameter Weibull. The Weibull distribution is a special type of distribution that plays an important role in modeling fault distributions in reliability studies [9,14,17,19]. In fact, the distributions were adjusted to 2- and 3-parameters Weibull distributions to find the MTBI from eq. (7) [12]:
Where:
Beta (β) = is the shape parameter
Eta (ŋ) = is the scale parameter
Gamma (ϒ) = is the location parameter
The parameters, β, ŋ and ϒ, can be determined by using the probability density function (pdf) of the 3-parameter Weibull distribution of the form eq. (8):
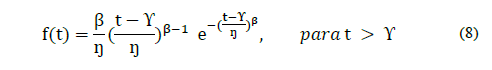
Here, the shape parameter (β) is dimensionless and indicates the failure mechanism. The parameters ŋ and ϒ are expressed in units of time. In our particular case, those are expressed in hours. The scale parameter (ŋ), is also known as the characteristic life parameter or characteristic time. The location parameter (ϒ) assists in locating the points on the abscissa where the function starts [9,18,20].
In addition, the location parameter can be calculated by trial and error [9]. In particular, our study used an Excel tool called solver, which seeks to maximize the correlation coefficient R2, varying gamma with the constraint that gamma must be less than or equal to the first number of failure order.
Once the distribution has been obtained and validated, the mean time between interventions, reliability and overall costs for each of the critical components is computed. Regarding the proposed policy, two MTBI measurements were made, one was defined as the mean time between corrective interventions labeled as MTBIc, and the other as the mean time between preventive interventions labeled as MTBIp,
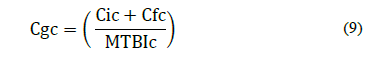
The MTBIc corresponds to the expected life calculated from the Weibull parameters and represents the optimal replacement time until failure. The associated overall corrective cost (Cgc), expressed in dollars per hour (USD/h), was obtained by eq. (9):
Where:
Cic = cost of corrective intervention
Cfc = cost of corrective failure
The Cic includes spare parts, personnel, among other. This study considered the component single price (PU) along with the machine installation hours (h-H) multiplied by the labor cost (Cmo), see eq. (10). Moreover, the Cfc was obtained from the cost of preventative intervention (Cip) multiplied by the cost of corrective failure, which is set by a 3 factor, commonly used in most mining sites:

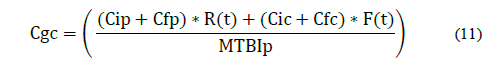
The MTBIp was also calculated from the Weibull parameters, then the overall cost of preventative (Cgp) expressed in dollars per hour (USD/h) was estimated from eq. (11) [9,12]:
Where:
Cip = cost of preventative intervention
Cfp = cost of preventative failure
Here, the Cip was considered equal to Cic, and the Cfp is set to zero. Then the operating time was ordered with their respective MTBIp and Cgp to find the minimum cost and the corresponding replacement time in hours.
Finally, for each component, the reliability and overall cost of the base policy and proposed policy were compared. Thus, two options arose: the overall cost and reliability of the MTBIc and the overall cost and reliability of the MTBIp.
3. Results for the case study
The DDC's analysis identified 14 repairable critical components located above the oblique line for overall cost (Fig. 3) -classified as components with greater criticality- as they represent those generating higher cost or unavailability.
This means a total of 27 components with greater criticality installed for each EX5500 excavator as detailed in Table 1.
Table 1 Details of installed components per EX5500 excavators.
| Number | Selected components | Total installed components per machine |
|---|---|---|
| 1 | Swing Bearing | 1 |
| 2 | Engine | 2 |
| 3 | Tumbler Shaft | 2 |
| 4 | Drive Tumblers | 2 |
| 5 | Swing Transmissions | 4 |
| 6 | Pump Transmissions | 2 |
| 7 | Bucket Tilt Cylinders | 2 |
| 8 | Front Idlers | 2 |
| 9 | Track Adjuster Cylinder | 2 |
| 10 | Arm Cylinder | 1 |
| 11 | Center Joint | 1 |
| 12 | Boom Cylinders | 2 |
| 13 | Bucket Open / Close Cylinders | 2 |
| 14 | Propel Transmissions | 2 |
| Total | 27 |
Source: The Authors.
Subsequently, the reliability metrics for each of the 14 components is determined. Table 2 presents the calculations for the Swing Bearing component that contains censored data in the historical fault record. For this case, Lewis’ formula was used.
Table 2 Calculation of F(t) and R(t) with censored data for the Swing Bearing component
| Number(i) | Working time in machine | Delta (δ) | Failure probability F(t) | Reliability R(t) |
|---|---|---|---|---|
| 1 | 9534.8 | 1 | 0% | 100% |
| 2 | 10747.6 | 0 | 20% | 80% |
| 3 | 12244 | 0 | 40% | 60% |
| 4 | 22715.7 | 0 | 60% | 40% |
| 5 | 27231.8 | 0 | 80% | 20% |
Source: The Authors.
The reliability metrics enable testing of models of probability distributions and validate the model that better adjusted to the data with the R2coefficient (Table 3).
Table 3 R2 per distribution type.
| Critical component | Normal (R2) | Exponential (R2) | Weibull 2P (R2) | Weibull 3P (R2) |
|---|---|---|---|---|
| Swing Bearing | 0.9161 | 0.9175 | 0.8992 | 0.9570 |
| Engine | 0.9028 | 0.8255 | 0.9399 | 0.9400 |
| Tumbler Shaft | 0.8178 | 0.5833 | 0.7821 | 0.7821 |
| Drive Tumblers | 0.9071 | 0.6591 | 0.7560 | 0.7560 |
| Swing Transmissions | 0.9699 | 0.9220 | 0.9444 | 0.9444 |
| Pump Transmissions | 0.9573 | 0.8901 | 0.9565 | 0.9565 |
| Bucket Tilt Cylinders | 0.9658 | 0.8723 | 0.9798 | 0.9852 |
| Front Idlers | 0.9131 | 0.9826 | 0.9398 | 0.9908 |
| Track Adjuster Cylinder | 0.9968 | 0.9458 | 0.9989 | 0.9989 |
| Arm Cylinder | 1.0000 | 1.0000 | 1.0000 | 1.0000 |
| Center Joint | 0.9189 | 0.9249 | 0.8685 | 0.8685 |
| Boom Cylinders | 0.8556 | 0.7322 | 0.8610 | 0.8610 |
| Bucket Open/Close Cylinders | 0.9210 | 0.9949 | 0.9888 | 0.9888 |
| Propel Transmissions | 0.9829 | 0.8803 | 0.9652 | 0.9652 |
Source: The Authors.
As can be seen, not all cases achieved the largest R2 for the 2- or 3-parameter Weibull distributions. In fact, as already stated, a Weibull distribution is needed to determine the MTBI. For the components where R2 was adjusted to normal, a Weibull distribution was used because the parameters beta and eta can be adjusted to a normal distribution when Beta is greater than 1 [9].
Table 4 shows the calculation of Weibull parameters for the Swing Bearing component, the same procedure was carried out for the other components.
Table 4 Weibull distribution parameters for Swing Bearing component
| Parameter | Weibull 2P | Weibull 3P |
|---|---|---|
| β | 1.76 | 0.45 |
| ŋ | 21,772 | 8,930 |
| ϒ | 0 | 10,434 |
Source: The Authors.
With the parameters obtained from the Weibull distribution and the costs provided by the company, we determine MTBIc, MTBIp, reliability and overall costs. Regarding the costs and considering the Swing Bearing component as an example, we noted that the new component has a cost of approximately 241 876 USD. On average, the component replacement time for a shovel, either by preventive or corrective maintenance, is 240 hours. Moreover, the average labor cost is 15 USD an hour.
Based on this information a Cip of 245 476 USD was obtained. Note that the Cic was considered equal to the Cip. In addition, the Cfp is set to zero since we are dealing with a preventive intervention. Then, the Cip multiplied by the adjustment factor 3 yields a Cfc of 736 427 USD (Table 5).
Table 5 Related costs to the Swing Bearing component
| Detail | Mount |
|---|---|
| Component cost USD | 241876 |
| Hours of installation in machinery | 240 |
| Labor Cost USD / hr | 15 |
| Cip USD | 245476 |
| Cic USD | 245476 |
| Cfp USD | 0 |
| Factor of failure cost | 3 |
| Cfc USD | 736427 |
Source: The Authors
In Table 6, a comparison between the base policy and the proposed one, as a function of exchange time, reliability and cost are shown.
Table 6 Comparison between policies for the Swing Bearing component.
| Base Policy | Policy with MTBI | ||||
|---|---|---|---|---|---|
| MTBF factory (hr) | 28000 | MTBIc (hr) | 32948 | MTBIp (hr) | 10250 |
| Reliability | 25.9% | Reliability | 22.1% | Reliability | 100% |
| Recommended overall cost USD / hr | 44.78 | Cgc USD/hr | 29.80 | Cgp USD/hr | 23.95 |
Source: The Authors.
In this case, it is convenient to work with the MTBIp as it yields the lowest cost and highest reliability. Table 7 shows the comparison for the total components.
Table 7 Comparison for the total components
| Component | 1 Swing Bearing | 2 Engine | 14 Propel Transmissions | Total |
|---|---|---|---|---|
| Base Policy | ||||
| MTBF (minus factory percentage of deviation) (hrs) | 28,000 | 13,500 | 24,500 | |
| Reliability | 26.00% | 40.00% | 9.00% | |
| Overall cost (USD/hr) | 44.78 | 118.78 | 59.8 | |
| Total cost per fleet (USD/year) | 1,961,539 | 5,202,613 | 2,619,080 | 23,364,718 |
| Proposed policy | ||||
| a) MTBIc (hours) | 32,948 | 16,397 | 14,664 | |
| Reliability | 22.00% | 34.00% | 47.00% | |
| Cgc (USD/hr) | 29.8 | 87.85 | 62.51 | |
| b) MTBIp (hours) | 10,250 | 18,100 | 9,300 | |
| Reliability | 100.00% | 31.00% | 77.00% | |
| Cgp (USD/hr) | 23.95 | 109.56 | 45.27 | |
| Total cost per fleet (USD/year) | 1,048,959 | 3,847,737 | 1,982,752 | 17,341,679 |
| Saving | ||||
| MTBIo (hours) | 10,250 | 16,397 | 9,300 | |
| Reliability | 100.00% | 34.00% | 77.00% | |
| Cgc o Cgp (USD/year) | 23.95 | 87.85 | 45.27 | |
| Saving per fleet (USD/year) | 912,579 | 1,354,876 | 636,328 | 6,023,039 |
Source: The Authors.
Note that in some cases the MTBIo matches the MTBIp and the MTBIc, but in none of the cases does it match the MTBF of manufacturer. In addition, the best MTBI coincides with the best level of reliability. Finally, the overall cost for the MTBIo multiplied by 6 shovels and by the 7300 hours of annual operation, provides the total cost per fleet for each component under the proposed policy. This value is compared to the total cost of the base policy that is obtained from the current overall cost that the company incurs for 6 shovels and 7300 annual operating hours. The results clearly indicate that the proposed policy would generate a savings of 6,023,039 USD.
4. Discussion
As a marginal contribution to the study, the Jack-knife cost-scatter plot is introduced as an alternative diagram to the Pareto chart for determining component criticality. Unlike the basic Jack-knife diagram, in which costs are not displayed as they are considered intrinsic based on their proportionality to the number and frequency of downtimes, this cost-scatter plot considers the two main criteria of interest-availability and cost-for spare part management [2,21].
Concerning the MTBI, it should be noted that only a few studies have provided substantial insights on the subject [9,12,15]. However, as shown in Table 2, in practice, the fault history data aligns better to the definition of MTBI rather than MTBF due to the fact that the components are not only replaced by failures but also by preventive or predictive strategies which produce censored data related to failures.
Then, by using Lewis and Bernard's formulas, we were able to calculate the reliability metrics (Table 2) which allow for the treatment of either censored or complete data, thus avoiding spurious behavior in the reliability function due to the presence of censoring [12]. Indeed, the reliability metrics lead us to determine the Weibull parameters as shown in Table 4, which presents an example for the Swing Bearing component.
The result of costs, shown in Table 5, includes only some of the costs for the sake of simplicity. Note however that each company may decide which costs to incorporate according to their needs. In fact, this is an issue that should be addressed in further studies. When dealing with extremely critical equipment like excavators, it is advisable to measure the risk not only based on the cost criteria [17], but also considering the reliability criteria.
Finally, the results shown in Tables 6 and 7 provide evidence of the proposed policy’s effectiveness when compared to the base policy. In fact, within the proposed policy model, it was possible to determine the optimal replacement time which can be either when the failure occurs or during a preventive intervention, depending on the lower overall cost and the highest level of reliability achieved.
Due to the variety of scenarios, further efforts to improve upon the proposed model, taking into account new variables [22] such as the level of degradation [23], failure and shock rates [24], delivery time of components [25], among others, are needed. Nonetheless, one should be aware that handling several parameters at the same time could result in complex solution systems [4].
5. Conclusions
The study demonstrates that using a policy based on the MTBI values obtained from the EX5500 hydraulic excavator history records, instead of the MTBF values provided by the manufacturer, optimizes the replacement time of critical repairable components, thus, reducing global component management costs while securing a higher level of reliability.
However, we must also consider that this cost optimization model only reflects the operation of the excavators assessed at the mining site under study, and that results could vary at other sites and for other machinery and equipment. Still, the methodology presented herein can be used as a reference for the management of critical repairable components.

