


 Inglês (pdf)
 Artigo em XML
 Referências do artigo
 Enviar este artigo por email
 Citado por SciELO
  Citado por Google
  Similares em
SciELO
Similares em
SciELO  Similares em Google
 Permalink
1. Introduction
The SAE BRASIL AeroDesign Competition programme is a challenge posed to engineering students whose main objective is to diffuse and exchange aeronautical engineering techniques and knowledge through practical applications and competition [1]. The main goal of the tournament is to develop a small-scale radio-controlled cargo transport aircraft able to complete a pre-established flight mission. By participating in the SAE AeroDesign programme, the student engages with a real case of aeronautical design from conception and detailed design, to construction and testing. The characteristics of an SAE Aero Design entry is a light and flexible aircraft with optimised internal structure attuned to specific flight conditions. Each prototype is manufactured to a high-specification stiffness, such as that of balsa wood, high-performance structural foam, carbon fibre, aramid, or glass. The materials cause the aircraft to be more susceptible to aeroelastic phenomena and unwanted vibrations that can interfere with stability and limit the operating envelope [2]. Therefore, designing complex aeroservoelastic control laws is an active area of research because these are necessary to suppress those aeroelastic instabilities [3,4]. Simsiriwong and Sullivan reported on static and vibration testing and finite element simulations of wing assembly [5,6] and, in [7,8], presented a description of a composite UAV wing, including its structural geometry, components layout, and material systems.
The knowledge of the dynamic behaviour of the structure is essential for reliable aircraft design. Therefore, the modal parameters such as natural frequencies, damping factors and vibrational modes are requested. Modal analysis is a fundamental technique to estimate those vibrational parameters [9-11]. It is performed through theoretical (analytical or numerical) and experimental approaches. The theoretical technique uses the description of a physical model, which is composed of the mass, rigidity and damping [12]. The modal analysis has also used to estimate the vibrational modes of the complex structure, aiming to validate and improve the Computer-Aided Engineering (CAE) dynamic modelling [17-21]. Several techniques employed the experimental dynamic response to calibrate the numerical models [13,14]. In the last decades, technological development in data acquisition and signal processing enabled the improvement in experimental tests, allowing a fast determination of the modal parameters [15]. The advantage in performing experiments is the obtention of prototypes measurement that faithfully describe the constructive and physical characteristics of the system used in service.
Ground Vibration Testing (GVT) is a standard experimental test used in aircraft design and widely used in the final stages of project development and certification in the aeronautics industry [16]. Mottershead et al. [22] applied GVT to a military Lynx helicopter to measure the normal elastic modes and afterwards calibrated the numerical model using the sensitivity method with finite element model updating. Gupta and Seiler [23] described the application of the GVT procedures to a series of flexible flying wing aircraft designed and built to study its aeroelastic behaviour. Assis et al. [24] performed the aeroelastic analysis of an AeroDesign aircraft wing with PKNL method and compared with experimental GVT.
The main objective of the work is to experimentally determine the modal parameters of the structure of the aircraft wing designed for the SAE BRASIL Aero Design Competition. The numerical study and model calibration are presented in [25]. However, because research studies have demonstrated the application of experimental modal analysis (EMA) in aircraft, the contribution of this paper is its presentation of a comprehensive technical report on the experimental modal analysis of the aircraft wing for the SAE AeroDesign Competition by showing in detail the experimental setup and post-processing technique. This paper used experimental ground vibration test (GVT) procedures and a modal analysis technique based on the EasyMod toolbox [26,27] to estimate modal frequencies and vibrational mode shapes. Updates to the experimental procedures include changing the range of excitation frequency and length of the signal, the positioning of the wing structure suspension, and testing different points of excitation to cover as many different vibration modes as possible. Results for different modal identification methods were verified using the modal assurance criterion (MAC) [28], which achieved excellent data correlation.
2. Theoretical background
The modal parameters extraction is a post-processing technique that can be performed by using the experimental modal analysis procedures. The frequency response function (FRF) measured from a dynamic system is associated with the modal parameters (frequency, damping and vibrational mode) via algorithms of identification in the time or frequency domain. Ewins [9] presented several procedures with distinct levels of complexity that involved analysis or curve fitting using part of an FRF and a set of related FRFs of the same structure.
2.1. Multiple-degree-of-freedom damped systems
In real structures, energy dissipation due to damping attenuates the amplitude of the free vibration of the system. The importance to include the damping in the numerical model is to check the effect on natural frequencies (eigenvalues) and modal vectors (eigenvectors) [29]. Describing the damping forms of a structure requires several energy dissipation mechanisms, as many systems exhibit damping characteristics that result in the combination of these dissipative mechanisms [30]. The most common damping models for analysis are the viscous, structural, Coulomb (dry friction) and hysteretic damping. The generalized equation of motion for the structural damping modelled in a multiple-degree-of-freedom (MDoF) system is given by
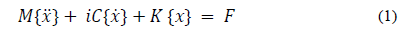
Where M, C and k are the n × n mass, damping and rigidity matrices respectively. The variables ẍ, ẋ ̇, x, F are n ×1 vectors of acceleration, velocity, displacement, and force, respectively [31]. The solution of the equation of motion is assumed as x(t)={X}e λt , where {X} is the displacement amplitude vector, λ is the eigenvalue and t is the time dependence of the system, respectively. By substituting x(t) into eq.(1) it gives the eigenvalue and eigenvector arrays associated with the system. The eigenvalue, λ r =ωr 2 , takes the form λr=±ωr √(1+ηr), where ω r is the natural frequency and ηr is the structural damping loss factor for the r-th mode. The parameter ηr can range from 2 ×10⁻⁵ for pure aluminium to 1.0 for hard rubber, as shown in Beards [32]. The next step is to diagonalize and normalize the system matrices by the mass matrix, similar to the process developed for non-damped systems [12]. The objective is to determine the system's receptance matrix, based on the input of a harmonic force, given by the general solution


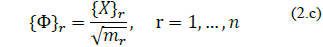
Upon imposing the boundary conditions, the typical eigenvalue problem described in eq. (2a) is solved for the non-trivial solution. The modal vector {Φ}r is normalized by the orthogonalized mass matrix, as can be seen in eqs. (2.b) and (2.c). The parameter ωr2 is the eigenvalue resulting in the natural frequency. By pre-multiplying eq. (2a) with the transposed modal matrix normalized by the mass [Φ], we have
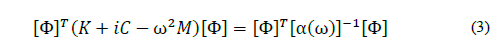
Where eq. (3) determines the receptance matrix by interrelating the input and output parameters of a linear discrete mechanical system which is submitted to harmonic force. Rearranging eq. (3) yields,
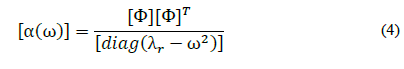
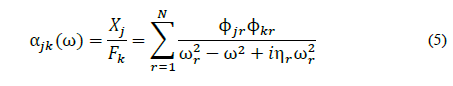
The FRF array of [α(ω)] holds the symmetry property and the reciprocity principle, so that αjk=αkj. Finally, we can rewrite the receptance as
2.2. Modal parameter extraction
Among the estimation techniques, an established method is the one-degree of freedom (1DoF) curve fitting, known as Circle-Fit. The method is based on the fact that at frequencies close to the natural frequency, the mobility function can be approximated to a 1DoF system added to a constant compensation term that corresponds to the other modes. The procedure works by adjusting the curve of a circle to the measured data points and approaching the system polar phase graph of the frequency response function (FRF) which has a circular nature (Nyquist plot). The method is versatile, nonetheless, care must be taken when using it in structures that have very close resonance peaks or very damped modes, which may cause a lack of the complete circular form [10]. The Circle-Fit is a well-established technique, however, in some cases it cannot be used, e.g. in complex structures with undefined modes or with high modal density. This technique can be applied for well-spaced natural frequencies, as it does not demonstrate to be reliable for the identification of different modes with close natural frequencies. The Circle-Fit method is based on the circularity of the Nyquist contour. Considering the structural damping mechanism, the receptance function (α) forms a perfect circular outline, described by
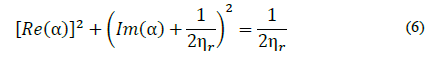
Where Re(α) and Im(α) are the real and imaginary parts of the receptance matrix. The receptance FRF of a structurally damped MDoF system is given by eq. (5). If one intends to analyze the r-th mode, the following equation applies,
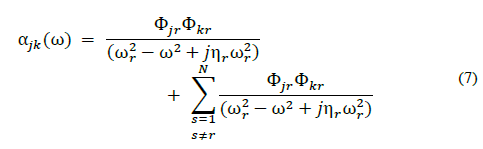
The sum term on the right-hand side of eq. (7) can be approximated to a complex constant, resulting in
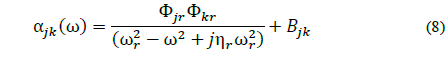
The circularity of the Nyquist outline will not change when the circle is displaced at a distance from the origin of the complex plane by the complex constant Bjk. The procedure consists of first finding the natural frequency, then deriving the damping factor and finally the modal constant. After selecting the FRF points in the resonant peak location, the natural frequency can be found where the maximum arc change occurs in the Nyquist circle. Fig. 1 presents the representation of a Nyquist circle.
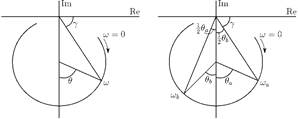
For the relevant angles presented, the following holds true
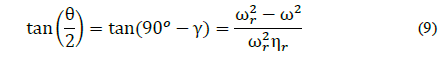
Where it can be inferred that
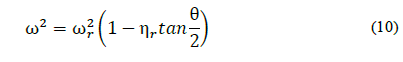
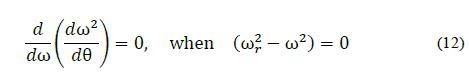
Differentiating eq. (10) with respect to θ yields a function that describes the rate of change of the circle arc, given by
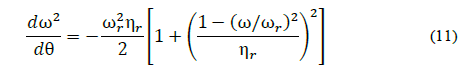
by assuming maximum value when ω=ωr, it can be demonstrated by means of the following derivation of the
eq.(11) with respect to the frequency and equating it to zero (critical point of the function), as shown by,
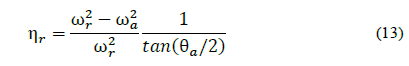
The damping factor can be determined from the cartesian points of the FRF, e.g. the point “a” of Fig.1, by using the eq. (10) rewritten as
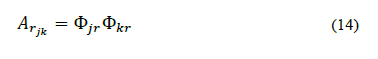
Theoretically, the damping loss factor must be constant. However, due to measurement noise, non-linearity and errors, the estimated damping loss factor varies for different data points [9]. This variation may be useful to indicate the accuracy of the analysis. The modal constant, A rjk , can be extracted from the Nyquist contour, and it is expressed using the modal forms,
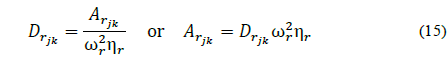
In addition, the modal constant can also be obtained from the diameter D rjk , which is conveniently quantized at the location of the natural frequency. Hence the modal phase angle can be found as,
Once the modal parameters have been extracted, it is common to make a comparison between the predicted dynamic behaviour of the test framework and those observed in experiments. The process of verifying the accuracy of dynamically predicted and experimentally measured parameters is essentially the validation of a model. One method that is commonly used is the MAC (Modal Assurance Criterion).
The typical frequency response function matrix contains unwanted data concerning a modal vector, and this can be attributed to changes in excitation locations or modal data extraction techniques. Therefore, the consistency of the estimated modal vectors may be useful when evaluating experimental modal vectors, where the results can be contrasted employing a scalar modal guarantee criterion [28]. The MAC evaluates the degree of consistency, or linearity, between the estimated modal vectors, and is given by:
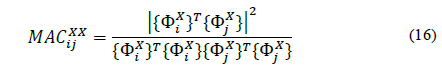
Where {ΦX} is the modal vector associated with the experimentally estimated modes i and j.
The criterion returns values between zero (representing no consistent match) and one (representing a consistent match). Thus, if the modal vectors under consideration exhibit a consistent linear relationship, the modal assurance criterion should approximate the unit, hence [MAC]≃[I], where[I] is the identity matrix. It is important to note that the MAC criterion does not indicate an effective measure of orthogonality between modes, but a consistent correspondence.
The EasyMod is an open-source toolbox, integrated with MATLAB and Scilab to perform modal analysis. This tool has a series of functions that allows the identification of the modal parameters and subsequently validates them. Currently, the functions available are the Circle-Fit, as previously presented in this paper, the Line-Fit and the Least Square Complex Exponential methods. In addition, some relevant functions are offered to complete a modal analysis: operations in the FRF, FRF generation from mass, damping and stiffness matrices, MAC and modal collinearity [33]. Therefore, the estimation of modal parameters was performed with EasyMod due to its practicality and accuracy, as presented in [34-36]. A complete EasyMod user-guide is available in the following reference [33].
3. Experimental analysis using the GVT technique
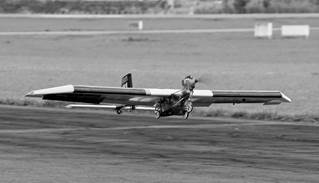
The aircraft analysed in this paper and designed by the Draco Volans team of the University of Brasilia to meet the specifications established in the regulations of the XIX SAE Aero Design Competition is shown in Fig. 2.
Source: The Authors.
Figure 2 Aircraft prototype designed for the XIX SAE Brazil AeroDesign Competition.
3.1. Structure details
The designed aircraft assumed a conventional airplane concept, which presents performance advantages in several areas about other aircraft concepts concerning the imposed regulations. The design is composed of two independent parts, one is the structure of the fuselage and tailboom, and the wing composes the other.
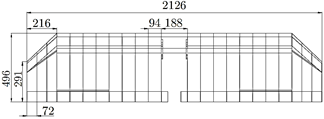
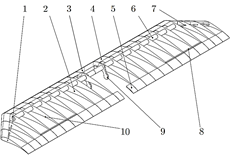
The aircraft is a lightweight structure, weighing 645 g; it has a wingspan of 2126 mm, a chord at the root of 496 mm, a chord at the tip of 291 mm, and it was designed to withstand critical situations of in-flight loading and forced landing. The components used to build the main structure were laminated sandwich plates of structural foam and carbon fibre for the central ribs; pultruded carbon tubes for the end wing spars; thin wall tube laminated with bidirectional carbon fibre for the main spar; balsa wood for the ribs, leading, and trailing edges; and part of the leading edge was made from F7 Styrofoam. The main dimensions of the structure are shown in Fig. 3, and the final structural layout in Fig. 4. Table 1 listed the components and their locations in the wing.
Source: The Authors.
Figure 4 Structural layout and wing detailing designed by Draco Volans Aerodesign team.
Table 1 Detailing of prototype components.
| Item | Specification |
|---|---|
| 1 | Bushing for secondary spars (thickness: 25 mm, 2 units) |
| 2 | Balsa wood rib (thickness: 3 mm) |
| 3 | Styrofoam F7 leading edge |
| 4 | Balsa wood leading edge (thickness: 1 mm) |
| 5 | Balsa wood trailing edge (thickness: 1 mm) |
| 6 | Main spar (laminated carbon fiber and epoxy resin) |
| 7 | Secondary spar (carbon fiber pultruded tube-OD8xID5.5 mm) |
| 8 | Aileron spar |
| 9 | Central rib (2 units) |
| 10 | Aileron servo-controller (2 units) |
Source: The Authors.
The wing cover was made with MicroLite adhesive plastic. All components of the lateral section were fixed using TEKBOND-793 quick curing glue, which fills gaps up to 0.1 mm [37]. The components of the central section were joined by the application of AMPREG A-26-SLOW resin, due to its mechanical strength.
3.2. Setup
The setup for the GVT is shown in Figs. 5 and 6. To simulate a free-free boundary condition, the wing was suspended using a light foam. We have tested to hang the wing by strings, but with the excitation, it was excessively moving due to its lightweight, therefore affecting the measured response.
Source: The Authors.
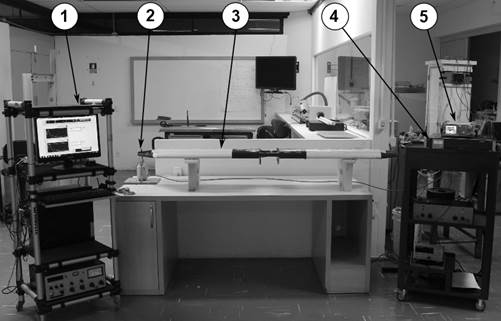
Figure 5 Experiment assembly. (1) Acquisition system (hardware National Instruments model NI cDAQ-9174 and software LabVIEW), (2) Excitation (shaker) and response (accelerometer and load cell) set, (3) DV-2017 wing suspended in light foam, (4) Signal amplifier TIRA vib BAA 60, (5) Signal generator Minipa MFG-4205B.

Source: The Authors.
Figure 6 (a) Excitation set fixing detail. (1) Electrodynamic shaker TIRA vib 50018, (2) Stinger, (3) Load cell ICP®208C01, (4) Accelerometer ICP®352C33. (b) Detail on the wing suspension by the light foam.
In this experiment, the excitation force could be provided by either an impact hammer or an electrodynamic shaker that allows the excitation with a wide range of possibilities. The impulse produced by the hammer imposes only instantaneous energy excitation, while the electrodynamic shaker provides the excitation energy for a specific time and in a controlled way, such as a sine sweep, burst signal, etc. Another advantage of the electrodynamic shaker excitation in this test was that the response signal could be averaged with various measurements, hence reducing measurement noise. Regarding the types of excitation signals provided by the electrodynamic shaker, a logarithmic chirp is a good option because it is a continuous signal that can excite both the lower and higher frequencies [38].
The experiment was conducted with non-symmetrical excitations in the structure, outside the elastic line of the wing. After initial tests on the wing prototype, and referring on the works developed in [39-41], the nodes chosen for excitation were the 1st and 9th, as depicted in Figs. 7 and 8. The selected excitation points were in the regions of high stiffness to avoid influences of the shaker in the experiment and regarding the energy in each mode. In this case, the optimal placement of accelerometers and excitation for modal vibration tests were on the wing ribs and main spar.
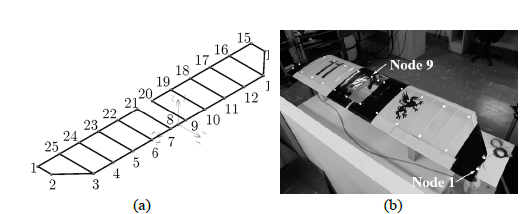
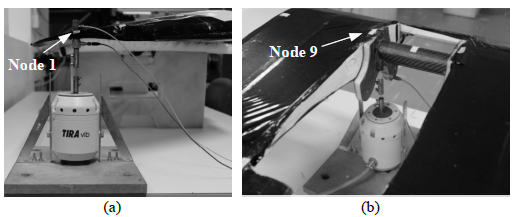
Fig. 6(a) shows the attachment of the excitation set to the structure, where the shaker used generates forces up to 18 N and has a frequency range of 2 to 18000 Hz. The shaker is connected to the wing structure using a stinger and a load cell model ICP®208C01. It was glued to the excitation node using wax to avoid posterior damages during the experiment to the wing surface, which was manufactured from MicroLite plastic. Previous publications of GVT experiments in aircraft also used wax to connect the stinger to the structure, demonstrating effective attachment for the excitation of vibrational modes [23]. The load cell used measures both tensile and compression forces and operates in a frequency range of 0.01 Hz to 3600 Hz and force amplitude range of ± 44.5 N. The stinger is placed between the shaker and the load cell. The purpose of the stinger is to uncouple the effects of the shaker from the structure, and to transmit only axial loads to the structure, reducing the possibility of inserting transverse forces. The impact of coupling interaction between electrodynamic shaker and structure is treated in [42,43]. Hence, the use of the stinger ensures a correct excitation of the wing and uncoupled shaker-structure.
3.3. Procedures
The data acquisition hardware National Instruments model NI cDAQ-9174 shown in Fig. 5 was used to measure and collect the data. Channel 1 was used to input data from the load cell, and channel 2 connected the accelerometer, as shown in Fig. 6(a). The measurements were performed at 25 nodes in a mesh distributed over the wing surface, including the excitation point. The mesh was distributed so that each rib had two measuring points, as displayed in Fig.7, one on the main spar and one on the trailing edge. Based on this configuration, the mesh is able to register both bending and torsion modes [19].
Before starting each GVT data collection, the wing was subjected to the input vibration for 10 seconds. It ensured the excitation stabilization, and that the wing was effectively supported by the foams, without the observation of abnormalities or excessive vibrations. The initial experiments performed introduced a linear sweep-sine signal, spanning a frequency range of 2 to 500 Hz, lasting 1 second. However, to improve the experiment data quality, the length of the signal was increased, also the sweep was changed from linear to logarithmic, and the frequency sweep band was reduced. Because it is a lightweight structure with large dimensions, the first expected frequencies are low [29]. The use of a logarithmic sweep allows the low frequencies to be excited for a longer period. The decrease in the input frequency spectrum follows the same idea. These changes resulted in data with less noise and more accurate measurements [23]. Thus, the input signal adopted was a sine with the logarithmic sweep, covering a spectrum of frequencies from 2 to 150 Hz, lasting 4 seconds.
An important aspect of the experimental test was the positioning of the supports to simulate a free-free boundary condition. In the initial tests, the foam supports were placed closer to the wing's center. It created an imbalance when the structure was vibrating, resulting in a constant detachment of the excitation assembly from the structure, that caused pauses on the tests several times. The solution adopted was to increase the distance between the foam supports, approaching them to the half of the wingspan of the ailerons, as can be observed in Fig. 6(b). Regarding the excitation positions and response measurement, several points were tested to improve the quality of the results and allowing to excite a greater number of modes. Two excitation nodes proved to be more suitable, the first being node 1 (trailing edge of the right end of the wing) and the second being node 9 (above the left-centre profile). By exciting at node 1, it was possible to obtain the modes 1st, 2nd, 3rd bending and 1st torsion modes; by exciting at node-9, it was possible to determine the 2nd torsion mode. Figs. 7 and 8 displays the selected nodes. We maintained those two excitation points within all tests to guarantee consistency in the measurement results.
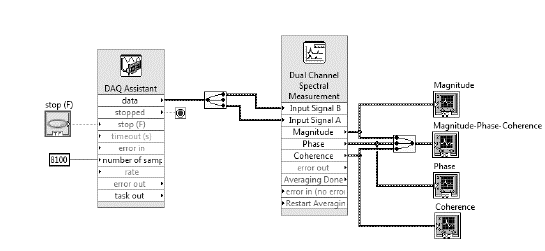
In summary, the complete experiment consists of a GVT with 25 measurements performed successively. The duration of each test was approximately 2 minutes. The collected data were processed through the FFT analyzer of the LabVIEW software, as shown in the schematic Fig.9. The FRFs and the coherence functions were saved in individual text files and later processed in the EasyMod toolbox, within the MATLAB software, through which the modal parameters were extracted.
3.4. Data acquisition
The data acquisition occurred through the use of two sensors: a load cell ICP® 208C01 and an accelerometer ICP®352C33. The first sensor has a sensitivity of 112.41 mV/kN, covering a measurement frequency range of 0.01 to 36000 Hz. The second sensor has a sensitivity of 10.2 mV/(m/s2), covering a frequency range of measurement from 0.5 to 10000 Hz.
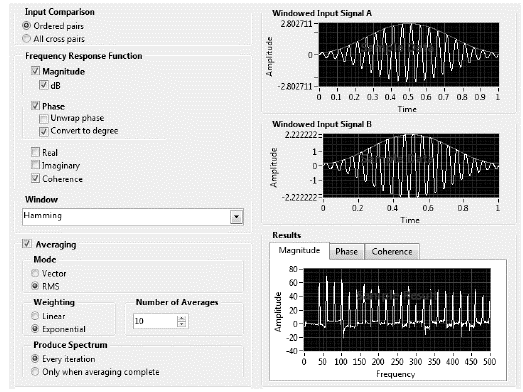
The software used with the acquisition system was the LabVIEW. Fig. 9 presents the block diagram developed for the input of the two signals, one characterized by the acceleration magnitude and other by the force magnitude. The LabVIEW dual-channel spectral measured function processes the signal from the time domain to the frequency domain and returns the FRF magnitude, phase and coherence functions. The block diagram (Fig.10) also presents the analyzer setup, where we considered the output of the magnitude in dB, the output of the phase in degrees, Hamming-type windowing, and the use of RMS mean with the exponential weighting of the obtained signals. A total of 10 signals per test were used to calculate the average response. The sampling rate used for the sensors was 1,024k data per second, with a total of 4,092k data to be measured. This value of sampling frequency satisfied Shannon’s Sampling Theorem, as the signal was sampled at a rate more than two times the maximum frequency component in the signal to retain all frequency components [38]. Henceforth, each analysis signal had a total duration of 4 seconds.
3.5. Data post-processing
The EasyMod and its implemented functions were used to estimate the modal parameters from the experimental data [33]. The flowchart of Fig. 11 presented the algorithm implemented to obtain the modal parameters and applied to the MAC for the correlation of the vibrational modes obtained.
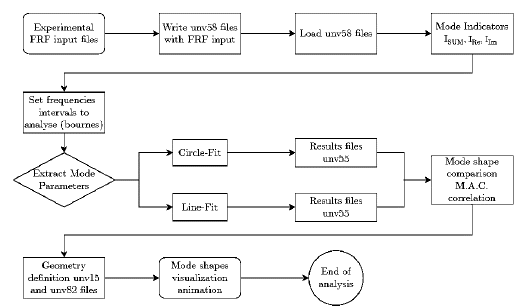
The procedure applied to post-processing the data was to export the measured FRFs to the EasyMod under the file extension 'unv58'. Each FRF is related to the measurement point indicated in the nodal mesh adopted, as presented in Fig. 7(a). EasyMod requires the user to indicate the frequency range where the resonant frequency might occur. In our case, the first seven resonance frequencies were found using the mode indicators (Fig. 13), and the frequency interval setting described in Table 2. Circle-Fit, Line-Fit, and Least-Square Complex Exponential methods are the estimators available in EasyMod. As our experimental FRFs resulted in distinct and separated mode shapes, the software provided a good estimation by using Circle-Fit and Line-Fit methods. Next steps were to read the estimated modal parameters and compare the results obtained by both estimation techniques using the MAC. The animation and visualization of the mode shape were performed in the EasyAnim software.
Source: The Authors
Figure 12 Frequency response functions (magnitude, phase and coherence) for excitation and response at node 1.
4. Experimental results
This section presents the experimental results obtained by GVT. The results of the experimental model presented were compared with the numerical results in [25]. Fig. 12 shows the experimental spectrum plotted by magnitude (acceleration) [dB], phase and coherence graphs for excitation and response obtained at node 1. From 70 Hz and further, the damping significantly dominates the structural response, attenuating the peaks of resonant frequencies, which makes it difficult to estimate modal parameters from this value of frequency. The coherence of the measurement has a good correlation between input and output signals with its value close to the unit.
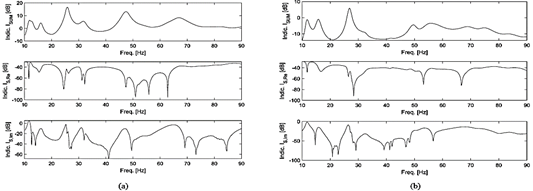
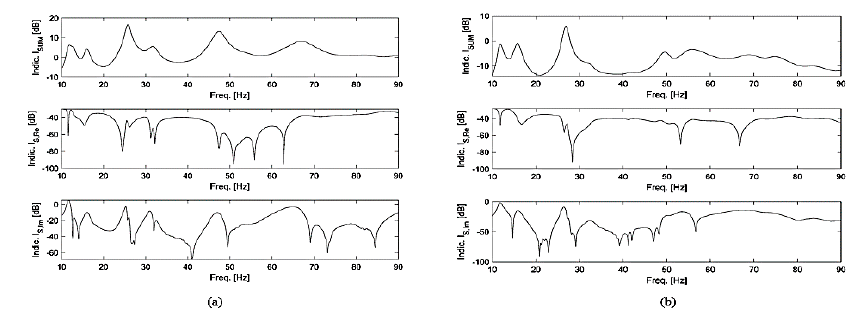
As previously described, both the Line-Fit and Circle-Fit methods were used to extract the modal parameters. The identification using the EasyMod starts with a mode indicator to check the local frequency range to analyze. Fig. 13 shows the graph of modal indicators that were used to determine the frequency intervals to be analysed by modal extraction methods. The upper graph in Figs. 13(a) and (b) displays the magnitude measured at node 1 and 9, respectively. The middle graphs of Fig. 13 (a) and (b) are the real part of the magnitude, followed for the imaginary part of the magnitude (bottom graph). Table 2 shows the intervals considered for analysis in each resonance frequency range.
Source: The Authors.
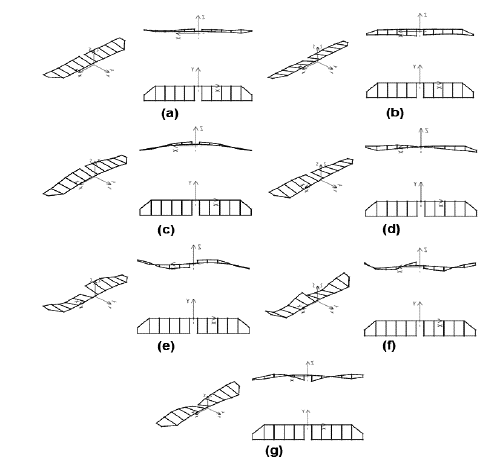
Figure 14 Visualization of the first seven vibrational modes identified by the Line-Fit method. (a) The first mode of suspension (12.0 Hz), (b) Second mode of suspension (16.1 Hz), (c) First bending mode (26.0 Hz), (d) First torsion mode (31.8 Hz), (e) Second bending mode (47.7 Hz), (f) Second torsion mode (54.4 Hz), (g) Third bending mode (67.1 Hz).
After the identification of the frequency range, seven vibration modes were identified being 1st and 2nd suspension modes at 12 Hz and 15.9 Hz; 1st, 1st and 3rd bending modes at 26.0, 47.8 and 67.1 Hz; and 1st and 1st torsion modes at 31.9 and 55.3 Hz, respectively. Fig. 14(a-g) contains the visualization of the seven vibrational modes obtained with the Line-Fit method.
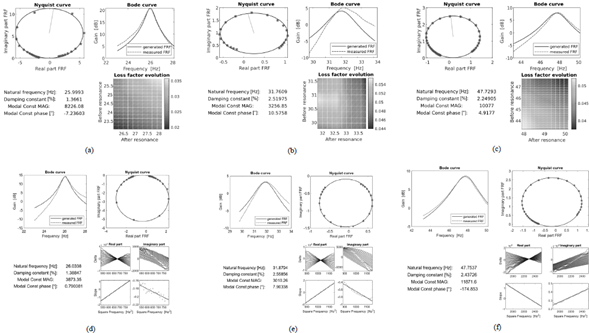
The graphical plot of the Circle-Fit and Line-Fit extraction methods, including the identified frequencies, are presented in Figs.15. The graphs on Fig. 15 (a-c) show the Circle-Fit estimation results by Nyquist curve fitting, bode curve for each resonance peak, loss factor evolution, and the summary box contain the natural frequency, the loss factor and the modal constants. The Nyquist curve fitting estimation is shown in the asterisks (*) that follows the circle line demonstrating the Nyquist plot that projects the real-imaginary plane FRF. As the asterisks are close to the reading circle, the more accurate is the modal estimation. Another way to evaluate the estimation of the modal parameters is with the bode curve or diagram. It consists of comparing the measured resonance peak in a logarithm scale with an estimated bode curve, the estimation accuracy regarding the fitting of the curves. EasyMod also estimates the structural damping factor by analyzing the mode shape before and after the resonance, and a mean among the values give the parameter final result. For the first suspension mode, the estimated natural frequency with the Circle-Fit method is at 11.9 Hz and the damping constant at 4%. The results obtained for the seven mode shapes followed the estimations presented in Fig. 15 are summarised in Table 3.
Source: The Authors.
Figure 15 Graphical results for Circle-Fit (a-c) and Line-Fit (d-f) methods obtained with EasyMod. (a,d) First bending mode, (b,e) First torsion mode, (c,f) Second bending mode.
Table 3 Summary of the experimental results post-processed.
| Mode | Line-Fit [Hz] | Damping [%] | Circle-Fit [Hz] | Damping [%] |
|---|---|---|---|---|
| 1-1st s | 12.0 | 4.04 | 11.9 | 4.21 |
| 2-2nd s | 15.9 | 4.07 | 16.0 | 3.66 |
| 3-1st b | 26.0 | 1.39 | 26.0 | 1.37 |
| 4-1st t | 31.9 | 2.56 | 31.8 | 2.52 |
| 5-2nd b | 47.8 | 2.44 | 47.8 | 2.25 |
| 6-2nd t | 55.3 | 4.51 | 54.3 | 3.48 |
| 7-3rd b | 67.1 | 3.60 | 67.1 | 3.58 |
s=suspension, b=bending, t=torsion.
Source: The Authors.
The frequencies identified by the Line-Fit extraction method are plotted in Fig. 15 (d-f). Similarly, to the Circle-Fit, it is given the Nyquist curve fitting, bode curve for each resonance peak, loss factor evolution based on Dobson’s method [11], and the summary box contain the natural frequency, the loss factor and the modal constants. By selecting a frequency range around the natural frequency, one can obtain a series of straight lines for both the real and imaginary parts of function the resonance frequency (H2). The slopes of the lines in Fig. 15 (d-f) (both real and imaginary parts) can be estimated and plotted against (H2) and used to estimate the damping constant. In both methods, the seven modes were estimated and returned similar values of frequency and damping rate, which respectively are summarized in Table 3.
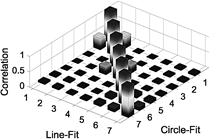
The modes identified were similar to the symmetric and fundamental asymmetric modes of bending and twisting. Those modes were also identified in the numerical model presented in [25]. The MAC criterion was used to verify the correlation between the modes obtained by the Line-Fit and Circle-Fit methods. Fig. 16 shows a comparison between both estimation to the diagonal dominance of the MAC array for all modes.methods predicted modes. The pairing of modes is close according Despite the small loss of correlation in the matrix, the analysis resulted in an accurate modal correlation estimation.
4. Conclusion
GVT was performed on the SAE AeroDesign team prototype aircraft wing, using the standard setup for modal analysis. Harmonic excitation was used, applied by an electrodynamic shaker, and response was measured using a load cell and an accelerometer. The resulting experimental data were processed using the EasyMod toolbox, making it possible to obtain seven vibrational modes of the wing; the first two were modes of suspension and the others were interleaved bending and torsion modes. It was found that torsion modes are difficult to excite. Thus, careful selection of the excitation location is required to precisely identify these mode shapes. Also, small modifications - such as changing the position of the foam suspension, decreasing the frequency range of the input signal, or using different nodes for excitation - can make a significant difference in the identification of modal parameters. Two methods of modal extraction (circle-fit and line-fit) were used and compared employing the MAC; this showed a correlation between the obtained modes. Both methods also returned values close to the estimated modal parameters.

