


 Inglés (pdf)
 Articulo en XML
 Referencias del artículo
 Enviar articulo por email
 Citado por SciELO
  Citado por Google
  Similares en
SciELO
Similares en
SciELO  Similares en Google
 Permalink
1. Introduction
Interference and pulse tests provide information to establish reservoir characteristics, predict reservoir behavior, and diagnose formation damage. These tests are mainly performed to either find hydraulic connectivity or determine the permeability and porosity in the domain of both wells. Based on this, the transmissivity (kh/μ) and storage capacity (фc t h) can be estimated, [8,9].
[19] studied the double-porosity model and found two main parameters to characterize a naturally fractured reservoir: the fracture storativity coefficient (ω) and the interporosity flow parameter (λ). For that, they assumed the matrix has high storage but low flow capacity, radial flow is only through the fracture networks, the reservoir is horizontal and infinite, flow rate is constant, and gravity effects and vertical pressure gradients are negligible. Those assumptions were also studied by [12], who concluded that the study made by Warren and Root was accurate for double-porosity reservoirs only during late time behavior in a pressure test.
According to [10], an interference test is a multiple-well test where there is at least one active and one observation well. The active well can be either a producer or an injector, and the observation well is shut in. The purpose of this test is to determine reservoir information that is not possible with another kind of pressure test. This test is conducted by measuring the pressure response in one or more observation wells caused by the opening or shutting| in of a neighbor well. Its advantage is the estimation of transmissivity of a fracture system, storage in the matrix and fractures, and size and block diffusivity. That is why [14] presented equations to analyze this test, which consider the interaction among fractures and the matrix rock.
Several authors have conducted studies of the interference test neglecting the wellbore storage coefficient and skin effect of the active well. A method to analyze interference data including wellbore storage and skin was presented by [17]. As a result, [15] presented a technique whereby wellbore storage and skin existing in one well are correlated. After that, [4] proposed the development pressure derivative type curve for use in build-up and drawdown tests in double-porosity reservoirs.
Double-porosity systems are formations with two porous systems. Each system has different porosity and permeability and can participate in the production process. These systems are usually naturally fractured reservoirs, where the fractures have high permeability and low storativity. On the other hand, the matrix has high storativity but low permeability. [3] presented a mathematical model for this kind of system where the matrix behavior operates under pseudosteady state conditions.
The model used for decline-type curve analysis was developed for the case of a well producing a constant pressure. [18] considered the pressure response at a constant pressure test in single porosity reservoirs. They plotted log-log-type curves for various interference wells. [5] presented a solution model as a function of Laplace transform including wellbore skin; however, their types of curves were only for zero skin. In addition, they did not present a single log-log-type curve for various combinations of these parameters, λ, ω, and r D .
Another method to characterize a naturally fractured reservoir using characteristic points found on the pressure derivative plot was proposed for interpretation of single-well pressure tests. This method utilizes an expression developed for the characteristic points and slopes of pressure and pressure derivative log-log plot. The values of these points are used in analytical solutions to obtain reservoir parameters, [7].
The interference test also can be used in an anisotropic system to estimate the horizontal and vertical permeability. The type curve matching for horizontal and vertical permeability was proposed by [16]. [11] used those type curves in two field cases. They found the type curves reliable when there is a low degree of anisotropy and if there is just one observation well in the direction of maximum permeability. This enhances the reliability of interference analysis. Based on Warren and Root’s model, [19], [13] assumed an anisotropic matrix, so they developed equations to determine the horizontal and vertical permeability and the anisotropic angle. [2] developed a numerical solution for anisotropic systems. After that, [2] tested the numerical solution in single- and double-porosity systems and found the model reliable for both cases.
This research presents the effects of λ, ω, and r D on the pressure response of an observation well in an infinite reservoir and an interpretation methodology is presented for the estimation of the interporosity flow parameter and the storativity ratio following the idea proposed by [8]. Wellbore storage and skin effects are neglected in both the producing and observation wells, for which new equations were developed to characterize double-porosity reservoirs following the philosophy of the TDS Technique which uses characteristic points and features found on the pressure and pressure derivative plot as described in [7-9]. The developed equations were successfully tested with two synthetic and one field example.
2. Mathematical model
The mathematical model proposed by [6] represents a naturally fractured reservoir as a double-porosity model that is homogeneous and describes the response of the system fracture and matrix combination. It was developed with the following assumptions:
Infinite reservoir extension with closed upper and lower boundaries.
Slightly compressible fluid, single phase and laminar flow.
The porosity of any medium is independent of the pressure changes of another medium.
The flow to the well occurs only through the most permeable medium, and the less permeable medium acts as a source.
The diffusivity equation for the above assumptions is given by:
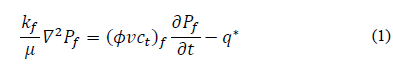
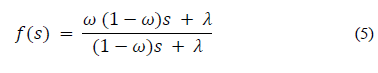
Equation 1 can be rewritten in the Laplacian space as:
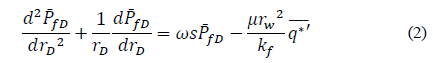
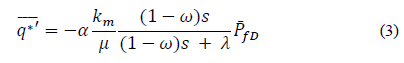
Substituting eq. (2) into eq. (3) gives the diffusivity equation for a double-porosity reservoir.
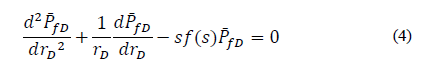
Where:
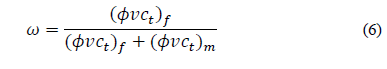
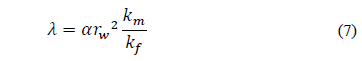
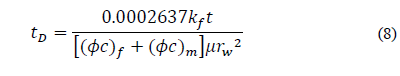
[13] gave the dimensionless time, pressure, and derivative pressure:
3. Well behavior
As mentioned before, three parameters can alter the pressure and pressure derivative behavior in an interference test:
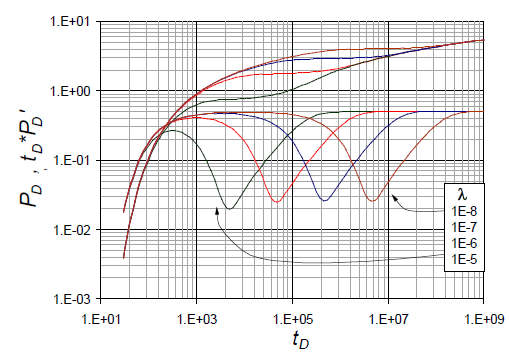
3.1. Case 1
Considers the dimensionless radius and storativity ratio as being constant and the interporosity flow as variable (Fig. 1). In the log-log plot, one can observe the pressure derivative is the same, but the minimum time is different to all. Furthermore, the pressure drop is greater when the interporosity flow is lower; however, at a dimensionless time of 1x10⁸ the drop pressure is the same for all. In addition, when the interporosity flow parameter is very small the early radial flow regime can be observed.
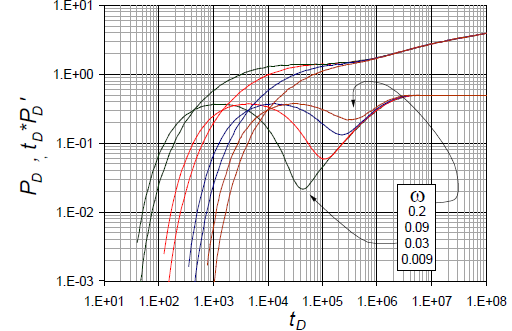
3.2. Case 2
Considers the dimensionless radius and interporosity flow as being constant and the storativity ratio as variable (Fig. 2). The storativity ratio affects the time response because it requires a longer time to obtain a complete interpretable set of pressure data. In addition, for dimensionless time greater than 1x10⁵ the pressure drop will yield the same for all values. Finally, this affects the minimum pressure derivative point. The relationship between the storativity ratio and the minimum point is directly proportional.
3.3. Case 3
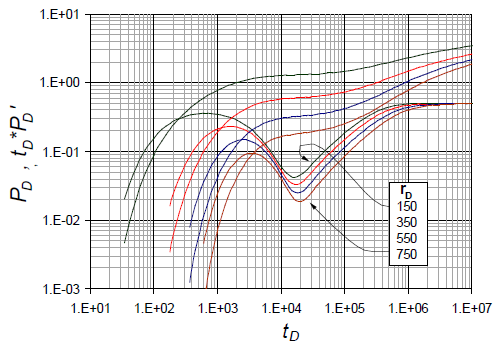
Considers both the interporosity flow parameter and the storativity ratio as being constant. The dimensionless radius is variable (Fig. 3). For the same time, the pressure drop is lower as the dimensionless radius is greater. Furthermore, the radius affects the values of the maximum and minimum pressure derivative points, so if the radius is greater, then these points will be lower.
4. Interpretation technique
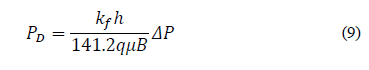
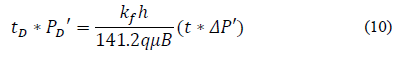
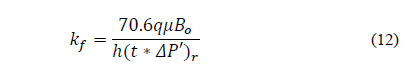
Radial regime. The governing equation developed for this flow regime is:
Replacing the dimensionless quantities, eq. (10) goes into eq. (11) and solves for the fracture permeability, k f :
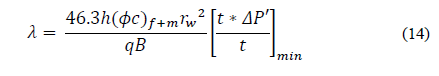
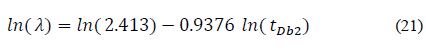
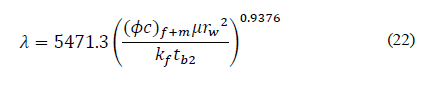
Unit slope: The governing equation for the unit slope that crosses through the minimum pressure derivative is:

Replacing dimensionless variables and solving for interporosity flow parameter, λ, gives:
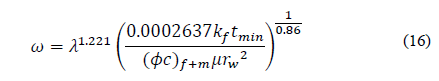
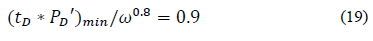
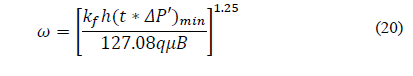
Minimum time: The governing equation for the minimum time of the pressure derivative is:
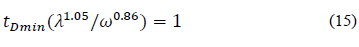
Replacing the dimensionless variables and solving for storativity ratio, ω, gives:
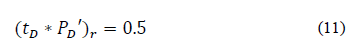
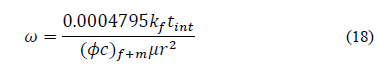
Pressure and derivative pressure intersection: The governing equation is:
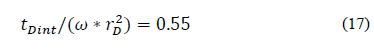
Replacing the dimensionless variables and solving for storativity ratio, ω, gives:
Minimum pressure derivative: The governing equation of the minimum point of the pressure derivative is:
Replacing the dimensionless variables and solving for storativity ratio, ω, gives:
Relationship between interporosity flow and beginning radial flow time: The governing equation is:
Replacing dimensionless variables and solving for interporosity flow parameter, λ, gives:
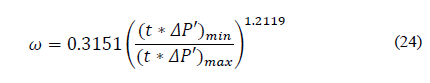
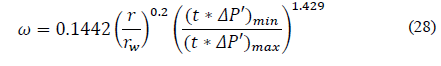
Relationship between the storativity ratio and the maximum and minimum derivative ratio: The governing equation is:
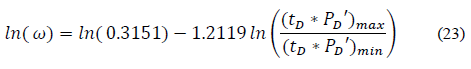
Replacing dimensionless variables and solving for storage capacity, ω, gives:
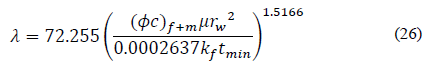
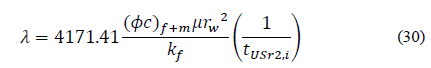
Relationship between interporosity flow and the minimum time of minimum derivative: The governing equation is:
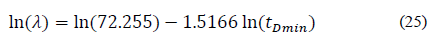
Replacing dimensionless variables and solving for interporosity flow parameter, λ, gives:
Relationship between the dimensionless ratio and storativity ratio and the maximum and minimum derivative ratios: The governing equation is:
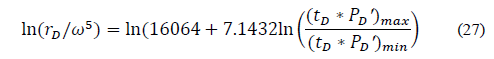
Replacing dimensionless variables and solving storativity ratio, ω, gives:
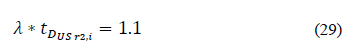
4.1. Intersection Point
Eq. (29) gives the intersection point between the unit slope and the radial regime flow.
Intersection of the unit slope that crosses through the minimum derivative and radial regime:
Replacing dimensionless variables and solving for interporosity flow parameter, λ, gives:
5. Examples
Figs. 4, 5 and 6 were built for the synthetic examples.
Source: The Authors.
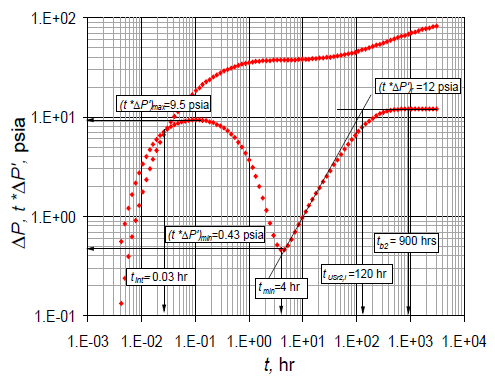
Figure 4 Pressure and pressure derivative vs. time log-log plot for synthetic example 1.
Source: The Authors.
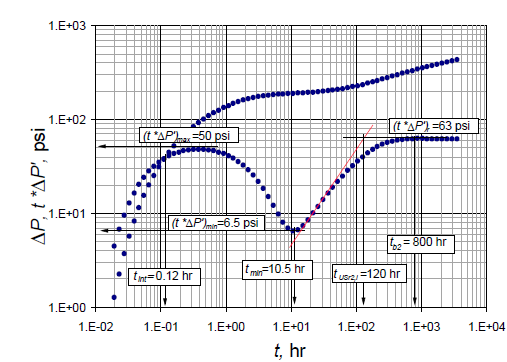
Figure 5 Pressure and pressure derivative vs. time log-log plot for synthetic example 2.
Source: The Authors.
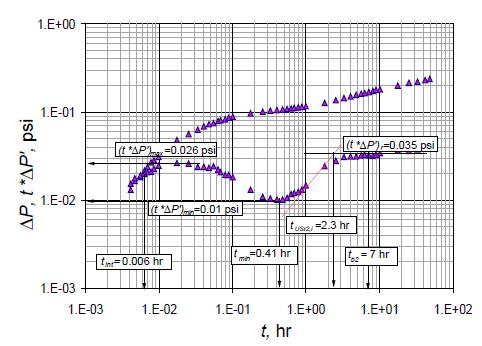
Figure 6 Pressure and pressure derivative vs. time log-log plot for the field example.
5.1. Synthetic Example 1
An interference test was simulated for a naturally fractured reservoir (Fig. 4), and data are presented in Table 1. It is required to estimate the storativity ratio coefficient and the interporosity flow parameter.
Table 1 Input data for synthetic example.
| Parameter | Synthetic Example 1 | Synthetic Example 2 | Field Example |
|---|---|---|---|
| h, ft | 100 | 30 | 100 |
| r w , ft | 0.25 | 0.3 | 0.73 |
| μ, cp | 0.65 | 1.2 | 0.3 |
| k f , md | 40 | 25 | - |
| ((c t ) t , psi-1 | 8x10⁻⁷ | 7x10⁻⁷ | 5x10⁻⁶ |
| q, STB/D | 1000 | 550 | 250 |
| B o , bbl/STB | 1.05 | 1.02 | 1 |
| P i , psia | 3000 | 2750 | 3750 |
| r, ft | 375 | 252 | 180 |
Source: The Authors.
Solution: The naturally fractured reservoir has the following parameters used as input for the simulation:
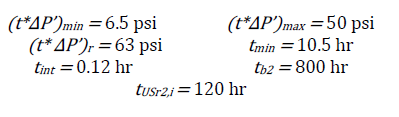
The following characteristic points were read from Fig. 4:
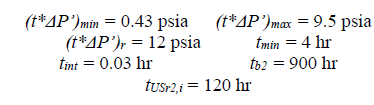
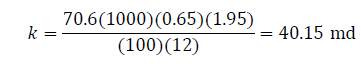
Eq. (11) helps find the fracture permeability:
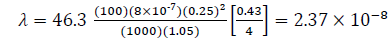
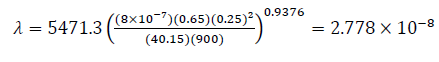
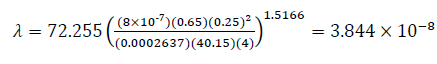
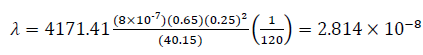
Eqs. (14), (22), (26), and (30) help find the interporosity flow parameter, λ, so that:
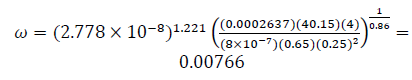
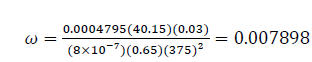
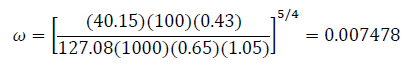
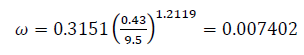
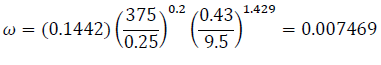
Then, Eqs. (16), (18), (20), (24), and (28) find the fracture storativity ratio, ω:
5.2. Synthetic Example 2
An interference test was simulated for a naturally fractured reservoir (Fig. 5) and data are presented in Table 2. As for the synthetic example 1, it is required the estimation of both the storativity ratio and the interporosity flow parameter.
Table 2 Comparison of results for synthetic example 1.
| Eq. | Parameter | Real | This work | Error, % |
|---|---|---|---|---|
| 14 | λ | 2.75x10⁻⁸ | 2.37 x10⁻⁸ | 13.82 |
| 22 | 2.778 x10⁻⁸ | 1.02 | ||
| 26 | 3.844 x10⁻⁸ | 39.78 | ||
| 30 | 2.814 x10⁻⁸ | 2.31 | ||
| 16 | ω | 0.0075 | 0.00766 | 2.13 |
| 18 | 0.007898 | 5.31 | ||
| 20 24 | 0.007478 | 0.29 | ||
| 24 | 0.007402 | 1.31 | ||
| 28 | 0.007469 | 0.41 |
Source: The Authors.
Solution: The below are the input values used to generate the pressure data:
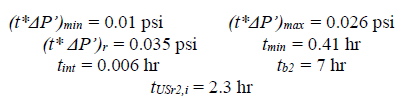
The following characteristic points were read Fig. 5:
The above data were used to find the reservoir parameters as reported in Table 3.
5.3. Field example
Data for the field example were taken from [6], from which pressure data were digitized and the pressure derivative was estimated in this work and reported in Fig. 6. Both the storativity ratio and the interporosity flow parameter are required to be calculated.
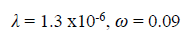
Solution: [6] reported the following parameters:
From Fig. 6, the characteristic points below were used to estimate the naturally fractured reservoir parameters, which are then presented in Table 4.
Table 4 Comparison of results for the field example.
| Eq. | Parameter | Real | This work | Error, % |
|---|---|---|---|---|
| 14 | λ | 1.3 x10⁻⁶ | 1.204 x10⁻⁶ | 7.42 |
| 22 | 1.792 x10⁻⁶ | 37.87 | ||
| 26 | 6.372 x10⁻⁷ | 50.98 | ||
| 30 | 1.050 x10⁻⁶ | 19.27 | ||
| 16 | ω | 0.09 | 0.08867 | 1.48 |
| 18 | 0.08956 | 0.49 | ||
| 20 24 | 0.1002 | 11.32 | ||
| 24 | 0.09898 | 9.98 | ||
| 28 | 0.1107 | 23.06 |
Source: The Authors.
6. Comments on the results
It can be seen from the three examples that the results of the interpretation technique match well with the input values. Even though some errors were greater than 10%, the estimation of the naturally fractured parameters accept errors of one order of magnitude. It is interesting to see the results from the field example where the pressure data were digitized and then pressure derivative was calculated. The results are very acceptable.
7. Conclusions
Nine new equations are presented for the characterization of naturally fractured double-porosity reservoirs using characteristic points found on the pressure and pressure derivative log-log plot so storativity ratio and the interporosity flow parameter are estimated from several sources. The developed expressions were successfully tested with examples.
The interporosity flow parameter can be estimated from the minimum derivative, minimum time, beginning radial flow time, and the intersection point between the unit slope and radial regime points.
The storativity ratio can be determined from the minimum and maximum derivative, minimum time, and the intersection point between pressure and derivative pressure.
Nomenclature
All the units are in the oil-field units.
BFormation volume factor, rbbl/STB
c t Total compressibility, 1/psi
hReservoir thickness, ft
k Permeability, md
k f Natural fracture intrinsic permeability, md
PPressure, psia
P D Dimensionless pressure
P fD Dimensionless fracture pressure
P * fD (s) Laplace transform of the dimensionless fracture
pressure
P i Initial reservoir pressure, psi
qFlow rate, STB/d
rRadius, ft
r D Dimensionless radius
S Laplace parameter, skin factor
t Time, hr
t D Dimensionless time
t D *P D ’Dimensionless pressure derivative
vDetermined volume and total volume ratio
Greek
Δ Difference operator
αMatrix shape form, ft-2
фPorosity, fraction
λInterporosity flow parameter
μViscosity, cp
ωStorativity ratio

