


 Inglês (pdf)
 Artigo em XML
 Referências do artigo
 Enviar este artigo por email
 Citado por SciELO
  Citado por Google
  Similares em
SciELO
Similares em
SciELO  Similares em Google
 Permalink
1. Introduction
Among the most representative biological raw materials are those that are starchy, consisting of cereals (rice, corn, wheat, barley, and oats) with a starch content between 30% and 80%, legumes (chickpeas, lentils, soybeans, and beans) with a starch content between 25% and 50%, and tubers (potatoes, cassavas, and yams) with a starch content between 60% and 90% [1,2]. All of these materials are made up of starch, which depending on the botanical source, contains certain amounts of amylose and amylopectin [3,4]. This gives starchy materials the properties to be the substrates of various bioprocesses in the pharmaceutical and textile industries, and in food and energy production processes. The main components of amylaceous materials are glucose polymers and other components in smaller proportions, such as lipids, proteins, and fiber; the common pretreatments used are physical processes, such as grinding, which look to decrease the particle size and increase the available surface area [5].
The amylaceous materials are mainly composed of glucose molecules connected by links α-1,4, which form a linear chain called amylose and α-1,6, which form a branched chain called amylopectine. Together, they form amorphous and crystalline regions, which are packaged in granules that form the native structure of amylaceous materials [6]. The crystalline region is composed of lateral chains of amylopectin that give rise to a secondary structure of double helices. The double helices are composed of hydrogen bonds, whereas the amorphous regions are composed of amylose and non-packaged amylopectin [7]. Enzymatic hydrolysis of amylaceous materials is one of the most important processes at the industrial level. It consists of three stages, generally carried out in a batch mode: gelatinization, liquefaction, and saccharification. In the gelatinization stage, the native structure of starch is altered, leaching the amorphous region and weakening the second structure of the crystalline region, and obtaining a more susceptible starch for the first enzymatic attack [8,9]. The endo-enzyme α-amylase is commonly used in the liquefaction stage, randomly hydrolyzing the α-1,4 bonds of amylose to obtain maltodextrin [10]. In the saccharification stage, amyloglucosidase is used, which is an exo-enzyme that hydrolyzes the α-1,4 and α-1,6 bonds in amylopectin to obtain glucose as a principal product [2]. At the end of each enzymatic process, the enzymes must be deactivated in order to stop the reaction. For this, there are methods such as pH deactivation, adding amounts of strong acids or bases to the sample [11,12], and temperature deactivation, in which the sample is boiled for periods between 5 and 15 min [11,13,14], or a combination of both [15].
In enzymatic hydrolysis processes, inhibitory effects may occur during the liquefaction or saccharification stages owing to high concentrations of starch or glucose present. These inhibitory effects are not desirable because they can cause a decrease in the catalytic activity of the enzyme. Studies such as those carried out by [2,16-18] demonstrate how, at high concentrations of starch, a decrease in enzymatic activity can be generated during hydrolysis or how glucose can act as a competitive inhibitor of the process.
In the literature, several investigations on starchy raw materials and their characteristics are reported [1,19-22]. Papers that use enzymes of this type and characterize and evaluate their application in enzymatic hydrolysis processes are also reported [2,23-25]. However, there are few references that focus on the unification of concepts and a detailed understanding of the dynamics of the processes for their proper use. The objective of this paper is to generate advances in the comprehension of an enzymatic hydrolysis process of wheat starch, beginning with the characterization of wheat starch and the determination of enzyme activity and deactivation enzyme methods. Also, an analysis of the dynamic behavior of components such as maltodextrins, maltose, and glucose in both stages; the effect of the enzyme substrate (E/S) ratio in the saccharification stage; and an analysis of the possible inhibitory effects by products such as glucose were made.
2. Materials and methods
2.1. Materials
This investigation used wheat starch from TECNNAS S.A. (Medellín, Colombia) and made a characterization for determining the content of starch and other interesting components.
A thermostable α-amylase (E.C.3.2.1.3) was derived from a genetically modified strain of Bacillus. Its enzyme activity and protein content were determined. One unit of enzyme activity for α-amylase is defined as the quantity of enzyme necessary to hydrolyze one milligram of maltose at 90°C over a period of 15 min.
The amyloglucosidase (E.C.3.2.1.3) was produced by controlled fermentation of a selected strain of Aspergillus niger. Its enzyme activity and protein content were determined. One unit of enzyme activity for amyloglucosidase is defined as the quantity of enzyme necessary to hydrolyze one milligram of glucose at 25°C over a period of 30 min.
2.2. Reactor
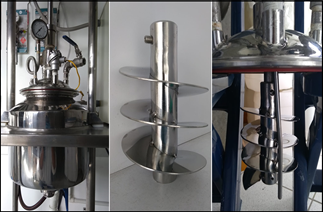
Fig. 1 shows the reaction unit, composed of 304 stainless steel, with an effective volume capacity of 3 L. It has an agitation system with a helix-type agitator and a heating system with thermal oil and a heating resistance. The unit also has a temperature control system with a sinusoidal valve that allows the entry of water for cooling the system.
2.3. Raw material characterization
The characterization of wheat starch was made based on techniques of biomass characterization developed by the National Renewable Energy Laboratory and modified by the Bioprocess and Reactive Flows Research Group. It consists of the preparation of samples for compositional analysis and the determination of total solids, ash, and extractives in the biomass. It also consists of the determination of protein content by the Kjeldahl method (analysis method based on NTC 4657) and the determination of starch by the polarimetric method of Ewers (ISO-10520).
2.4. Determination of enzymes protein content
For protein content determination in enzymes, the Bradford method was used. This method consists of the combination of Coomassie blue colorant and protein. The calibration curve used a standard solution of bovine serum albumin [26].
2.5. Determination of enzymatic activity
The enzyme activity of α-amylase was determined using the 3,5-Dinitrosalicylic acid method (DNS) from the standard curve of maltose from 0.05 to 2.0 g/L and a previously gelatinized 1% w/v starch solution. Each sample was prepared from the mixed starch solution, fumaric buffer, and α-amylase enzyme solution at 20°C for a period of three minutes. Then, DNS was added and allowed to boil for five minutes. Next, the samples were cooled with ice for a period of 10 min. Finally, the absorbance sample was read at 540 nm. To correct each absorbance, it was necessary, under the same conditions, to apply substrate and enzyme controls, according to eq. (1).
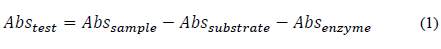
Here, Abs testis the real absorbance of the sample, Abs sample is the absorbance read on the spectrophotometer, Abs substrate is the absorbance of the control of the substrate used, and Abs enzyme is the absorbance of the enzymatic solution used.
Once the absorbance of the test was calculated, the maltose calibration curve equation was read and the number of milligrams of maltose released was obtained. This process was carried out with several dilution factors in order to find the enzyme dilution that allowed one milligram of maltose to be obtained. Then, an enzyme concentration graph was made on a logarithmic scale with respect to the amount of maltose released. From the equation of the curve, this concentration and the dilution factor (fd α - amylase ) were determined, which was multiplied by the activity proposed in Eq. (2).
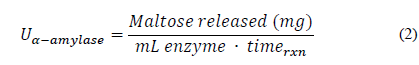
Here U α-amylase is the enzymatic activity of α-amylase, “Maltose released” is the amount of maltose quantified by high-efficiency liquid chromatography (HPLC) after enzymatic hydrolysis, mL enzyme is the amount of enzyme used in the assay, and time rxn is the time at which enzymatic hydrolysis occurs.
The amyloglucosidase activity was determined by HPLC using a column (Aminex HPX-87H) at a temperature of 50°C, movil phase sulfuric acid 50 mM-water, and a flow rate of 0.6 ml/min. The technique used a standard calibration curve of glucose from 0.1 to 2.0 g/L with a retention time of 9.278 minutes. A solution of maltose 2% w/v was used as a source of substrate. Each sample was prepared by mixing a starch solution, fumaric buffer, and amyloglucosidase enzyme solution at 25°C for a period of 30 min.
Once the glucose concentration was calculated by HPLC, the amount of glucose released was obtained. This process was performed with several dilution factors in order to find the enzyme dilution that allows one milligram of glucose to be obtained. Then, a concentration graph of enzyme was made on a logarithmic scale with respect to the amount of glucose released. The equation of the curve for this concentration was determined, along with the dilution factor (fd AMG ), which was multiplied by the activity proposed in Eq. (3).
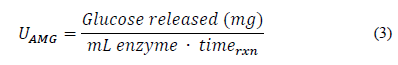
Here, U AMG is the enzymatic activity of amyloglucosidase, “Glucose released” is the amount of glucose quantified by HPLC after enzymatic hydrolysis, i mL enzyme is the amount of enzyme used in the assay, and time rxn is the time at which enzymatic hydrolysis occurs.
2.6. Enzymatic Hydrolysis
With the purpose of analyzing the effect of the E/S ratio, an enzymatic hydrolysis was made in a volume of 3L, changing the E/S ratio in the saccharification stage. In the literature, it is possible find many ratios in various units, but using an enzyme density and a starch of dilute of 1.2 and 1.0 g/ml, respectively, these values can be taken as a generic unit of liters of amyloglucosidase per metric ton of dry starch LAMG⁄TM dry starch . Maximum values for the E/S ratio can be found according to the enzyme used (recommended in the data sheet) of 0.88 L AMG ⁄TM dry starch equivalent to 0.11% p/p; [16] present values of 1.00 L AMG ⁄TM dry starch equivalent to 0.10% v/v; and [12] present values of 1.5 L AMG ⁄TM dry starch , equivalent to 0.18% p/p. For this test, the latter one was taken as a working value together with the one recommended in the technical card for the amyloglucosidase used.
2.6.1. Gelatinization stage
In this stage, 3 L of wheat starch solution (20% w/w) was prepared in a fumaric acid buffer with a pH of 5.8 units. The solution was subjected to gradual heating from room temperature until it reached a temperature between 90°C and 95°C. This process took approximately two hours, and when the gelatinization temperature was reached there was a 15-min delay and then gradual cooling was started until the solution reached the liquefaction temperature of 60°C. This took half an hour, and during this stage the process was agitated at 300 rpm.
2.6.2. Liquefaction stage
The pH of the previously gelatinized solution was adjusted to 5.8 units with white fumaric acid and NaOH. When it reached the liquefaction temperature, 163 μL of α-amylase, equivalent to an E/S ratio of 0.036% w/w, was added and the solution was agitated at 300 rpm.
Samplings were made at appropriate time intervals to obtain the kinetics of the process, and all stages took two hours. Each sampling volume was replaced with fumaric acid at a pH of 5.8 in order to always maintain the reaction volume [27]. After that, the solution was centrifuged at 10,000 rpm at 4°C for a period of seven minutes, and the hydrolysis reaction was stopped with HCl 1M at a pH of 1.0. Finally, the concentrations of glucose, maltose, and maltodextrins were determined by HPLC under the same conditions presented in section 2.5, with a retention time of 9.278 min for glucose, 7.697 min for maltose, and 6.258 and 6.999 min for the maltodextrins.
2.6.3. Saccharification stage
When the liquefaction stage was finished, the pH of the solution was adjusted to 4.3 units with white fumaric acid and NaOH, and the temperature was verified at 60°C. In the first experiment, 473.24 μL of amyloglucosidase equivalent to E/S ratio of 0.11% w/w was added. In the second experiment, 774.39 μL of amyloglucosidase equivalent to E/S ratio of 0.18% w/w was added and the solution was agitated at 300 rpm.
Samplings were made at appropriate time intervals to obtain the kinetics of the process, and all stages took 6.5 h. Each sampling volume was replaced with fumaric acid at a pH of 4.3 in order to always maintain the reaction volume [27]. After that, the solution was centrifuged at 10,000 rpm at 4°C for a period of seven minutes, and the hydrolysis reaction was stopped with HCl 1M at pH 1.0. Finally, the concentrations of glucose, maltose, and maltodextrins were determined by HPLC under the same conditions presented in section 2.5 and with the same retention times.
2.7. Enzymatic deactivation
Two methods of enzyme deactivation were evaluated. The first one was thermal shock, in which the sample was heated to the boiling point for 10 min [13,14] then cooled in an ice bath for 10 min. The second one was a change to the pH of the sample until 1.0 units with HCl 1.0M solution [12,15]. In both cases, a duplicate of the sample was taken at the end of the enzymatic hydrolysis: 15 min of gelatinization in an autoclave, 60 min of liquefaction, and 80 min of saccharification, all in a 200-mL volume, with a solid percentage of 20%.
For enzymatic deactivation, the gelatinization stage was carried out in autoclave for 15 min at pressures below 5 psi. The pH was adjusted to 5.8 units with fumaric acid and NaOH, and the solution was taken to a bain-marie at 60°C. After 15 min of stabilization, 10.88 μL of enzyme α-amylase (equivalent to an E/S ratio of 0.036% w/w) was added, and the system was agitated at 200 rpm. After two hours, the pH was adjusted to 4.3 units and there was a 15-min delay while the system stabilized and 31.55 μL of enzyme amiloglucosidase (equivalent to an E/S ratio of 0.11% w/w) was added. The system was then agitated at 200 rpm. Samples were taken for four hours, and the extracted volume was replaced with a fumaric acid buffer at pH 4.3 units in order to always maintain the reaction volume [27]. The glucose, maltose, and maltodextrin concentrations were determined by HPLC at the end of the process and six hours later under the same conditions presented in section 2.5 and with the same retention times. These times are referred to as the initial and final times.
2.8. Enzymatic inhibition by product
An analysis of inhibitory effects by product, specifically glucose, was performed. For the test, a sample, a solution of starch and glucose in a fumaric acid buffer, and a standard to which glucose was not added were used. The last two had an effective volume of 200 mL and a solids percentage of 20%, which was equivalent to 40 g of starch and 160 g of fumaric buffer.
According to previous experiments, for the percentage of solids used, the maximum concentration of glucose reached in the saccharification stage was approximately 180 g/L for a time of 4 h in this stage and 6 h in the overall process, for an amount of enzyme of 10.3 μL α-amylase (E/S ratio = 0.036% w/w) and 51.6 μL amyloglucosidase (E/S ratio = 0.18% w/w). Based on these data, 36 g of glucose was added to the sample at the beginning of the process to obtain an initial concentration of 180 g/L and the standard without initial glucose added was taken as the point of comparison to analyze the possible inhibitory effects.
The enzymatic hydrolysis process was made similar to the enzyme deactivation assay. Samples were taken only in the saccharification stage because the objective was to analyze whether the presence of glucose had a negative effect in this stage of the process. The extracted volume was replaced with the fumaric acid buffer at a pH of 4.3 in order to maintain the reaction volume [27]. The concentrations of glucose, maltose, and maltodextrins were calculated in the sample and standard by HPLC under the same conditions presented in section 2.5 and with the same retention times.
3. Results and discussion
3.1. Raw material characterization
Table 1 shows the various elements to be characterized in a starchy material. It was determined that an amount of starch of 89.80% was available for the enzymatic hydrolysis process.
Table 1 Characterization of wheat starch.
| Component | Value (%) |
|---|---|
| Moisture | 7.87±0.22 |
| Solids | 92.13±0.22 |
| Starch | 89.80±0.01 |
| Ashes | 0.15±0.0002 |
| Protein | 2.30 |
| Total | 92.25 |
Source: The Authors.
[20] report values between 67% and 69% for wheat starch. Although there is a considerable difference, the determined value is at the upper limit of normal starch content for this type of cereal [1,2]. It is similar to the reported values for potato or cassava with values between 60% and 92% [1,2,28,29], making it suitable for this type of hydrolysis process.
The total value of the characterization is equivalent to 92.25%, which is associated with the content of starch, ash, and protein. The protein content may be of interest given the possibility of forming starch-protein-lipid complexes [30], but given its proportion of 2.30% with respect to 89.80%, starch is not significant. The determination of extractants is equivalent to 2.26% in water, 1.02% in ethanol, and 0.03% in hexane, but they are not presented in Table 1 because they are included in the starch. They are of interest in the process because they are associated with inorganic material, non-structural sugars, or nitrogen materials; chlorophyll residues, waxes, and other minor components; and lipids from starch production. This is important because materials such as lipids can generate starch-lipid complexes [8,9,30] and decrease their availability for hydrolysis processes. Comparing the lipid content with the others reported can rule this out and lead to the conclusion that there is a high degree of purity of starch, which makes it a suitable raw material as a standard for the scaling of this type of process. The remaining percentage can be associated with organic and inorganic materials (raw fiber and minerals, among others) in the biomass, owing to its production process.
3.2. Determination of protein content in α-amylase and amyloglucosidase
From the results of Table 2, an amount of protein is observed in the α-amylase and amyloglucosidase samples, with values of 4,211 and 3,782 mg/mL, respectively. It was not possible to find, either in the reviewed literature or in the technical data sheets of the suppliers, reported data that would allow a comparison of the results, so this method can provide a first approach to the characterization of enzymes and their protein content. In addition, it will allow for the expression of the enzymatic activity by the amount of protein as a specific activity.
3.3. Determination of enzyme activity for α-amylase
For several dilutions of the α-amylase enzyme, the amounts of maltose released in 15 min of reaction at 90°C were determined by the DNS method, as already reported in section 2.5. The maltose calibration curve between 0.05 and 2.00 g/L has a correlation coefficient of R2 of 0.9991 and is represented by Eq. (4).

Here, "Concentration (g/l)" is the maltose concentration in the calibration curve and Abs is the absorbance of the determined maltose concentration.
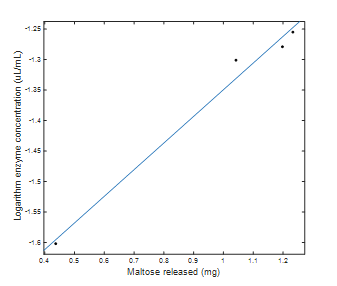
Fig. 2 shows the regression for the enzyme concentration on a logarithmic scale with respect to the amount of maltose released. It has a correlation coefficient R2 of 0.9845 and is represented by Eq. (5).
Source: The Authors.
Figure 2 Logarithmic scale enzyme concentration with respect to milligrams of maltose released.
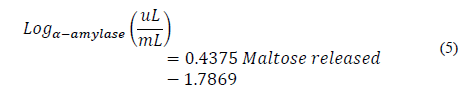
Here, Log α-amylase (uL/mL) is the logarithm of the concentration of the enzyme α-amylase.
From Eq. (5), the logarithm of the concentration of α-amylase needed to release exactly one milligram of maltose is calculated, which corresponds to a concentration of 0.0447 μL of α-amylase/ml in solution. From the above, the activity of the enzyme is calculated as 1,490 U, which, expressed per mg of protein, is 354 U/mg. Based on this activity value, it is possible to calculate the units of α-amylase that will be added to the starch solution during liquefaction as 3.1 U/g of starch.
3.4. Determination of enzyme activity for amyloglucosidase
For several dilutions of the enzyme amyloglucosidase, the amounts of glucose released in 30 min of reaction at 25°C were determined by HPLC, as already reported in section 2.5.
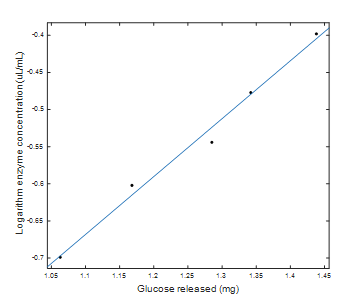
Fig. 3 shows the regression for the logarithmic scale enzyme concentration with respect to the amount of maltose released. It has a correlation coefficient R2 of 0.9881 and is represented by Eq. (6).
Source: The Authors.
Figure 3 Logarithmic scale enzyme concentration with respect to milligrams of glucose released.
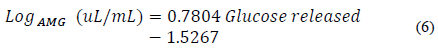
Here, Log AMG (uL/mL) is the logarithm of the concentration of the enzyme α-amylase.
From Eq. (6), the logarithm of the concentration of amyloglucosidase needed to release exactly one milligram of glucose is calculated, which corresponds to a concentration of 0.1793 μL of amyloglucosidase per milliliter of solution. From the above, the enzyme activity is calculated as 186 U which, expressed per milligram of protein, is 49 U/mg. Based on this activity value, it is possible to calculate the amyloglucosidase units that were added to the starch solution during saccharification as 0.4 U/g starch.
3.5. Enzymatic Hydrolysis
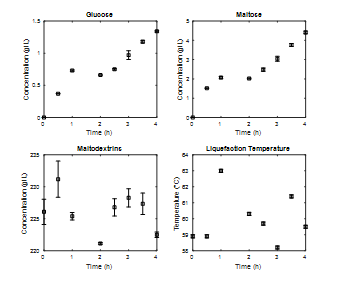
An analysis of the kinetics of maltodextrin consumption and glucose and maltose production was carried out for four hours in the liquefaction stage (Fig. 4), working with a substrate enzyme ratio of 0.036% w/w. The temperature variation is also shown throughout the stage.
Source: The Authors.
Figure 4 Enzymatic kinetics stage of liquefaction at 3L, percentage of solids 20%, operating temperature 60°C, E/S ratio 0.036%p/p.
The concentration of maltodextrins is significant from the beginning of the liquefaction process, which may be due to heating ramps during the gelatinization [31]. As for the concentration of glucose and maltose, a slight increase is observed, which was expected, taking into account the role of α-amylase on starch. The fact that the increase in the concentration of both sugars during the liquefaction process is not represented may be due to the interaction of two factors. The operating temperature of the liquefaction process
(60°C) used by other authors [32,33] is not the temperature reported as optimal for the enzyme (90°C) [15,17,25,35,36], and the E/S relation used, 0.3 L α-amylase / TM dry starch (0.036%w/w) , was not enough to avoid complete saturation of the enzyme with starch because it was lower than the value reported in the enzyme’s technical data sheet, 1.40 L α-amylase / TM dry starch , or by other authors, such as 0.8 L α-amylase / TM dry starch [36] or 2.50 L α-amylase / TM dry starch [24].
This does not mean that operating at lower temperatures with respect to the optimum value does not generate significant product concentrations in the process. One can think of the use of an I/O ratio greater than that used, which would have a direct effect on the activity of the enzyme. Although it was not observed that the process reached a steady state in the concentration of both sugars, the increase for each elapsed hour did not justify continuing the process for more than two hours. For the process temperature, it was observed that the control system managed to keep it at 5% above and below the operating value (60°C).
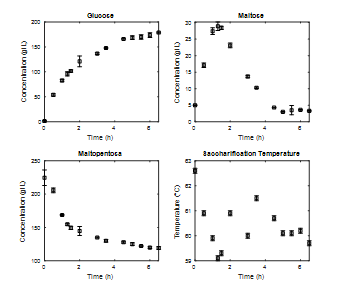
The results of saccharification kinetics for an E/S ratio of 0.11% w/w are presented in Fig. 5. During this stage of hydrolysis, a significant increase in the glucose concentration is observed, especially during the first hours until a stationary value is reached after five hours. As for the concentration of maltose, its maximum value is observed at close to 1.5 h of processing. This value corresponds to the maximum concentration of maltose reached during the entire hydrolysis process and indicates that at the beginning of the saccharification process the enzyme amyloglucosidase consumed maltodextrins to produce maltose and glucose. After a while, however, it began to consume the disaccharide formed and produced only glucose. This effect is confirmed by observing the kinetics of the maltodextrins, where a higher consumption slope is observed at the beginning of the process and later begins to stabilize. Based on the reaction mechanisms during enzymatic hydrolysis proposed by [16] and [12], increased glucose production from maltodextrins from maltose is expected. This behavior is observed in the first hour of saccharification, where the speed of glucose production is higher than in the rest of the process.
Source: The Authors.
Figure 5 Enzymatic kinetics saccharification stage at 3L, percentage of solids 20%, operating temperature 60°C, E/S ratio 0.11%w/w.
According to the definition of the function of the enzyme amyloglucosidase, there is no reason for it to stop producing glucose from maltodextrins, and it should do so only from maltose until it is completely depleted, as observed in the concentration of maltodextrins that are stabilized at values close to 100 g/L. To explain this behavior, it was evaluated whether there was any type of inhibition by product that would prevent the enzyme from continuing using maltodextrins as a substrate. However, as will be discussed later, it was possible to show that the glucose concentration was not harmful to the process.
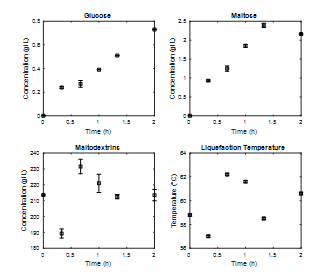
After this, the enzymatic hydrolysis process was repeated with an E/S ratio of 0.036% w/w in the liquefaction stage and 0.18% w/w in the saccharification stage. Again, Fig. 6 shows how in the liquefaction stage maltodextrins have high concentrations from the beginning of the process and deviations in some of their values, which are associated with difficulty in the quantification methodology. As mentioned earlier, there is no significant increase in the concentration of glucose and maltose, so the process is reduced to two hours. Again, it is observed how the process temperature seeks to stabilize for values close to 60°C.
Source: The Authors.
Figure 6 Enzymatic kinetics stage of liquefaction at 3L, percentage of solids 20%, operating temperature 60°C, E/S ratio 0.036%p/p.
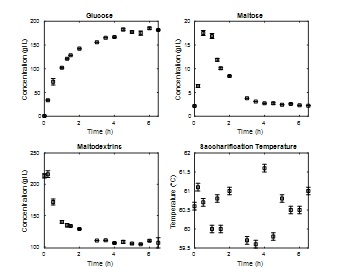
For the saccharification stage, it can be observed in Fig. 7 that the greatest increase in glucose occurs in the first two hours of the process, reaching steady-state values close to those reported in Fig. 5. For maltose, its maximum value can be observed as close to 0.5 h and after four hours of processing decreases to values below 5 g/L. The concentration of maltodextrins decreases with a greater slope than the previous process, reaching a steady state much faster. Again, the process temperature oscillates around the expected value.
Source: The Authors.
Figure 7 Enzymatic kinetics saccharification stage at 3L, percentage of solids 20%, operating temperature 60°C, E/S ratio 0.18%w/w.
It is interesting how a 0.07% increase in the E/S ratio allows an increase in the speed of the process (reaction speed) [27], thereby reaching stable values in less time. It is also highlighted how the time to reach the maximum maltose concentration is reduced by a third, although it does not reach the same value. A general comparison of the concentrations of each of the compounds of interest reaches the expected values in both cases. In other words, increases in the E/S ratio generate increases in the reaction rates of the process without significantly affecting the output concentrations.
In Figs. 4 and 6 there are differences in the liquefaction stage with respect to the concentrations of components. This behavior is associated with the low concentrations of glucose and maltose generated. The concentration of maltodextrins was similar in both cases and present variations in the kinetics of this stage.
Comparing these results with those obtained by [12], there is a significant decrease in the concentration of glucose and maltose (amounts greater than 50 g/L) but similar amounts for maltodextrins (around 230 g/L). These differences can be associated with variations in the process conditions, especially in the E/S ratio of 0.060% w/w compared with that used in this experiment (0.036% w/w). For four hours of saccharification, a concentration higher than 400 g/L was reached by doubling the concentration
found in this experiment for that time. The process conditions were similar, but the difference is attributed to effects associated with the previous stage. Other investigations such as those carried out by [24] obtained reduced sugar concentrations, higher than 20 and 150 g/L, in the liquefaction and saccharification stages. However, by using an E/S ratio of 0.3% w/w in both stages, concentrations were higher in both cases compared with that used in this experiment.
3.6. Enzyme deactivation
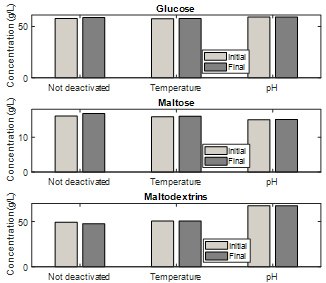
In Fig. 8 it is observed that both methods of enzymatic deactivation are adequate; however, pH inactivation shows less difference between glucose and maltose concentrations after six hours. In addition, their data have a lower standard deviation compared with the heat inactivation data. The above indicates that the structure of the enzymes used was affected more by acidic pH values than by sudden temperature variations. It is also an indication that the pH inactivation method had fewer sources of error than the heat inactivation method, producing fewer variable values among duplicates. Consequently, owing to the simplicity of the pH inactivation method and its better preservation of the samples over time, this method was chosen to perform all of the enzymatic hydrolysis assays.
3.7. Enzymatic inhibition by product
The concentrations of glucose, maltose, and maltodextrins for the sample and standard are presented in Fig. 9, as well as the process temperature. When analyzing the maltodextrins and maltose, it can be observed that in both cases similar concentrations are reached at the end of hydrolysis for both the sample and standard, although they are slightly higher in the sample. This guarantees that the inhibitory effect of glucose on the process was minimal and that its presence in high concentrations changed only the rate of consumption of maltodextrins and the rates of production and consumption of maltose in the first two hours of saccharification. Finally, however, the dynamics of both tests reach similar stationary values.
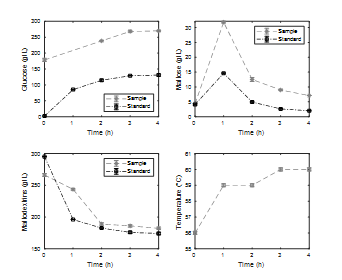
Studies such as those carried out by [16] present an analysis of glucose inhibitory effects in the saccharification stage. They carried out two tests under the same conditions: Temperature of 45°C and pH of 4.5, with an E/S ratio of 0.12% w/w, one without added glucose and another with the addition of 100 g/L of glucose. It was found that for times longer than 20 h, both trials showed similar and higher than 75% glucose starch conversions but at lower times the glucose conversion was higher in the test without added glucose. This allowed corroboration of competitive inhibition. When compared with the results obtained in this experiment, it was not possible to conclude whether this type of inhibition exists, although the addition of glucose had no significant effects on the process.
4. Conclusions
The efficacy of enzymatic deactivation pretreatments with temperature and pH on the enzymes used was analyzed, determining that for the latter the initial concentrations of glucose, maltose, and maltodextrins were on average 57.52, 15.89, and 50.65 g/L, and at the final time of six hours were 57.65, 16.04, and 50.74 g/L, respectively. This led to the selection of the pH deactivation method, given its ease of application with respect to temperature.
It was possible to show how the presence of glucose, in concentrations close to 36 g/L for volumes of 200 mL, in enzymatic hydrolysis processes of wheat starch under the conditions of the processes used did not generate inhibitory effects on the processes.
The variation of the E/S ratio from 0.11% w/w to 0.18% w/w in the saccharification stage, while maintaining the other process conditions, allowed us to observe a significant reduction in reaction times and achieve similar stable values in both tests. This suggested the possibility of reducing the time of the saccharification stage from 6.5 to 4.0 h
In this study, the possibility of general advances in the understanding of the enzymatic hydrolysis processes of wheat starch was established, and a clear route was proposed for the detailed characterization of the process. This was based on the characterization of raw materials and enzymes and the determination of deactivation and inhibition of enzymatic effects, up to the analysis of variations in the E/S ratio for the saccharification stage.

